

1. Introduction
Standardizing herbal formulations is crucial to ensuring the efficacy, safety, and reproducibility of herbal medicines. Standardization involves quantifying and maintaining the consistency of active compounds, such as phenols and flavonoids, which play a pivotal role in disease management (Gonfa et al., 2023). These bioactive compounds, abundant in many medicinal plants, are well known for their potent antioxidant properties. By neutralizing free radicals and reducing oxidative stress, they help mitigate the development of chronic diseases such as cancer, diabetes, and cardiovascular disorders (Demeke et al., 2021).
In addition, their anti-inflammatory effects help regulate immune responses, making them valuable in managing arthritis and other inflammatory conditions.
In pain management, flavonoids and phenols can modulate pain pathways, providing relief without the adverse effects associated with synthetic drugs. Furthermore, these compounds contribute significantly to burn and wound healing by promoting tissue repair, reducing the risk of infections, and accelerating recovery (Parmanik et al., 2025). By maintaining bioactive compounds at standardized levels, herbal formulations can deliver consistent therapeutic outcomes, contributing to holistic disease management (Upadhyay, et al. 2018).
India, renowned for its vast repository of medicinal plants, has a rich tradition of herbal medicine, forming the foundation of Ayurveda, Siddha, and Unani systems. The country’s diverse climate and geography support the growth of numerous medicinal plants, many of which possess potent therapeutic properties (Rudrapal et al., 2023) As global interest in natural and holistic health grows, India’s herbal formulations, whether single herbs or polyherbal combinations, have found their place in both domestic and international markets (Upadhyay et al., 2023).
Polyherbal formulations leverage the synergistic effects of multiple herbs, enhancing therapeutic efficacy and reducing side effects, making them highly effective in managing complex diseases. This holistic approach addresses multiple pathways of disease, offering a more comprehensive treatment option. Upadhyay et al., 2023).
Mimusops elengi L or Bakul, is a plant that is high in flavonoids, alkaloids, saponins, and tannins, among other phytochemicals. It is important in traditional medicine because of its many biological actions, which include anti-inflammatory, antibacterial, cardioprotective, and antioxidant capabilities. (Srivastava et al., 2023). Psidium guajava L (Guava) is abundant in bioactive compounds such as quercetin, flavonoids, carotenoids, and tannins. Both the leaves and fruits exhibit antioxidant, antimicrobial, anti-diabetic, and anti-inflammatory properties, making guava effective in treating digestive and respiratory disorders. (Amadike et al., 2022).
Aegle marmelos L (Bael), native to the Indian subcontinent, thrives in arid forests. It contains flavonoids, coumarins, alkaloids, and tannins, contributing to its wide range of biological activities, including anti-inflammatory, anti-diabetic, antibacterial, and hepatoprotective properties. Bael is commonly used for managing diabetes and digestive ailments (Monika et al., 2022).
In spite of the well-documented medicinal properties of Mimusops elengi, Psidium guajava, and Aegle marmelos, research on their combined therapeutic potential remains limited. Most studies focus on individual plant extracts, overlooking the possible synergistic interactions that could enhance efficacy and bioavailability. In additional, variations in phytochemical composition because of differences in geographical location, harvesting time, and extraction methods pose significant challenges in maintaining consistency across formulations. The absence of standardized protocols for polyherbal formulations further limits their clinical applicability and regulatory approval. Therefore, this study aims to bridge these gaps by developing a well-characterized polyherbal formulation with defined phytochemical content, validated antioxidant properties, and confirmed safety for dermal applications. Establishing such standardization will pave the way for broader therapeutic applications and facilitate the integration of traditional herbal medicine into mainstream healthcare.
We propose that combining these three plants will create a synergistic effect against diseases mediated by inflammation and oxidative stress, largely because of their flavonoid and phenol content. This study aimed to standardize and evaluate the combined plants’ pharmacognostic, phytochemical, and bioactive properties. We specifically measured the total phenol and flavonoid content and antioxidant capacity and conducted acute and subacute dermal toxicity tests. By integrating these plants, our goal was to enhance their therapeutic potential, ensuring that the combined formulation offers superior protection against oxidative damage and inflammatory responses compared to each plant individually. This thorough evaluation confirms the formulation’s safety and its potential effectiveness in managing conditions related to inflammation and oxidative stress.
2. Materials and Methods
2.1. Procurement and Taxonomic Verification of Plant Specimens
The leaves were collected and identified in the month of March and April. After preparing the herbarium, the identification was authenticated by Dr. Navin K. Ambasht from the Department of Botany at Christ Church College, Kanpur, Uttar Pradesh, India.
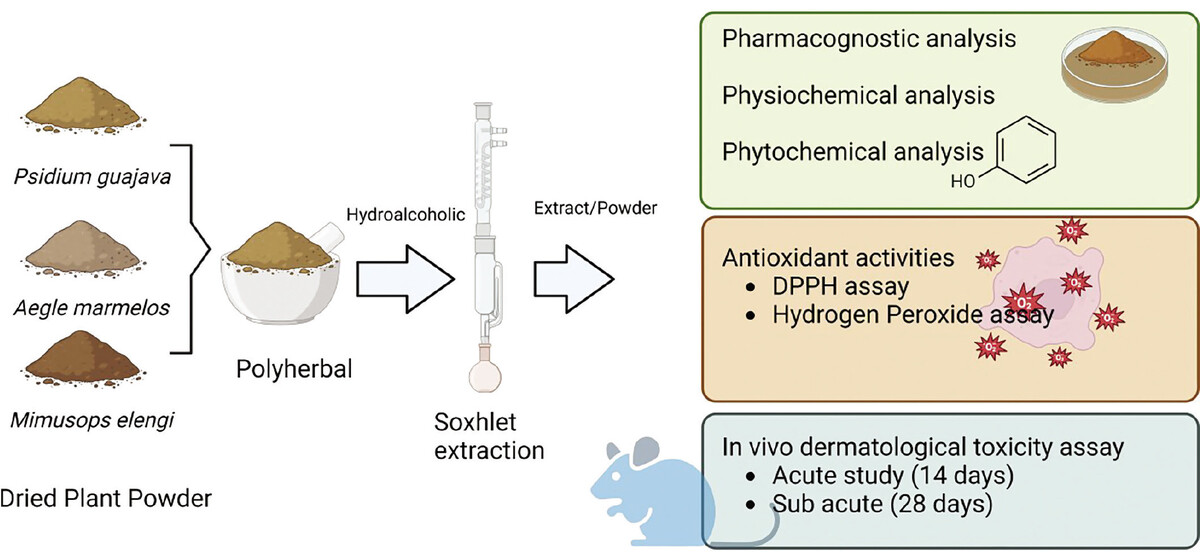
2.2. Polyherbal formulation preparation and physiochemical evaluation
The dried leaf materials were ground and mixed (Psidium guajava, Aegle marmelos, and Mimusops elengi) in a 2:2:1 ratio. The dried leaves powder was extracted using a Soxhlet apparatus with petroleum ether for defatting, followed by hydroalcoholic extraction (70:30 ratio) (HAPHE). HAPHE extracts were dried and stored in airtight containers for further analysis. The physicochemical properties of the polyherbal extract were quantitatively analyzed, including assessments of total ash, water-soluble ash, acid-insoluble ash, water-soluble extractives, and moisture content, following standard methodologies. HAPHE was used to screen phytochemical constituents such as alkaloids, glycosides, flavonoids, tannins, phytosterols, phenol, and protein.
2.3. FTIR spectroscopy
To perform FTIR analysis of the polyherbal extract, first prepare the sample by drying and grinding it into a fine powder. Combine a small quantity of the powdered extract with potassium bromide (KBr) to create a pellet. Insert the pellet into the FTIR spectrometer and measure the spectrum within the 4000–400 cm–1 range. Make sure the instrument is properly calibrated and perform background subtraction to remove any interference. Analyze the resulting FTIR spectrum to identify characteristic functional groups and chemical bonds based on peak positions and intensities (Upadhyay et al., 2018).
2.4. Estimation of bioactive compound content
2.4.1. Determination of total phenolics (TP)
TP was measured using the Folin-Ciocalteu reagent (Singleton et al., 1999). To prepare the sample, 1 ml of HAPHE solution was diluted with distilled water, combined with Folin-Ciocalteu reagent and sodium carbonate, and then incubated. The absorbance was recorded at 760 nm, and the TP was quantified as gallic acid equivalents (GAE). The result was 2.6498 mg GAE per gram of the original plant extract.
2.4.2. Determination of total flavonoids (TF)
TF was measured using the aluminum chloride colorimetric method (Dhivya et al., 2017). One milliliter of HAPHE or standard catechin solution was mixed with distilled water, sodium nitrite, and aluminum chloride, followed by sodium hydroxide. The absorbance was measured at 510 nm, and TFC was expressed as quercetin equivalents (QE). Quercetin Equivalent: 0.7958 mg QE for the original 1 g of plant extract.
2.5. Evaluation of Antioxidant Activity
2.5.1. 1, 1-DIPHENYL-2-PICRYLHYDRAZYL (DPPH) radical scavenging assay
The antioxidant activity of the HAPHE sample was assessed using the DPPH method as described by (khatoon et al., 2013). The ability of the formulation to neutralize free radicals was evaluated by observing the decrease in DPPH absorbance in an ethanol solution. A starting absorbance of 0.925 was recorded from a DPPH stock solution (0.1 mM) prepared in ethanol. To this, 1 ml of the stock solution was mixed with 3 mL of the test solution at various concentrations (50, 100, 150, 200, 250, and 300 µg/mL). After a 30-minute incubation period, the absorbance was measured at 517 nm. Ascorbic acid at the same concentrations was used as a standard for comparison. The scavenging activity was expressed as a percentage inhibition, calculated using the formula provided.
2.5.2. Hydrogen peroxide (H2O2) scavenging assay
The ability of HAPHE to scavenge H2O2 was assessed following the method by (Deutsch et al., 1998) (40 mM) was prepared in a phosphate buffer with a pH of 7.4. A 0.6 mL solution of H2O2 (40 mM) was combined with HAPHE at various concentrations (50, 100, 150, 200, 250, and 300 µg/mL). After a 10-minute incubation, the absorbance of hydrogen peroxide was measured at 230 nm, compared to a control solution containing only the phosphate buffer. The percentage inhibition of H2O2 by HAPHE and the standard (ascorbic acid) was calculated using the formula:
Where A1 is the absorbance in the presence of the test sample and standards, and A0 is the absorbance of the control.
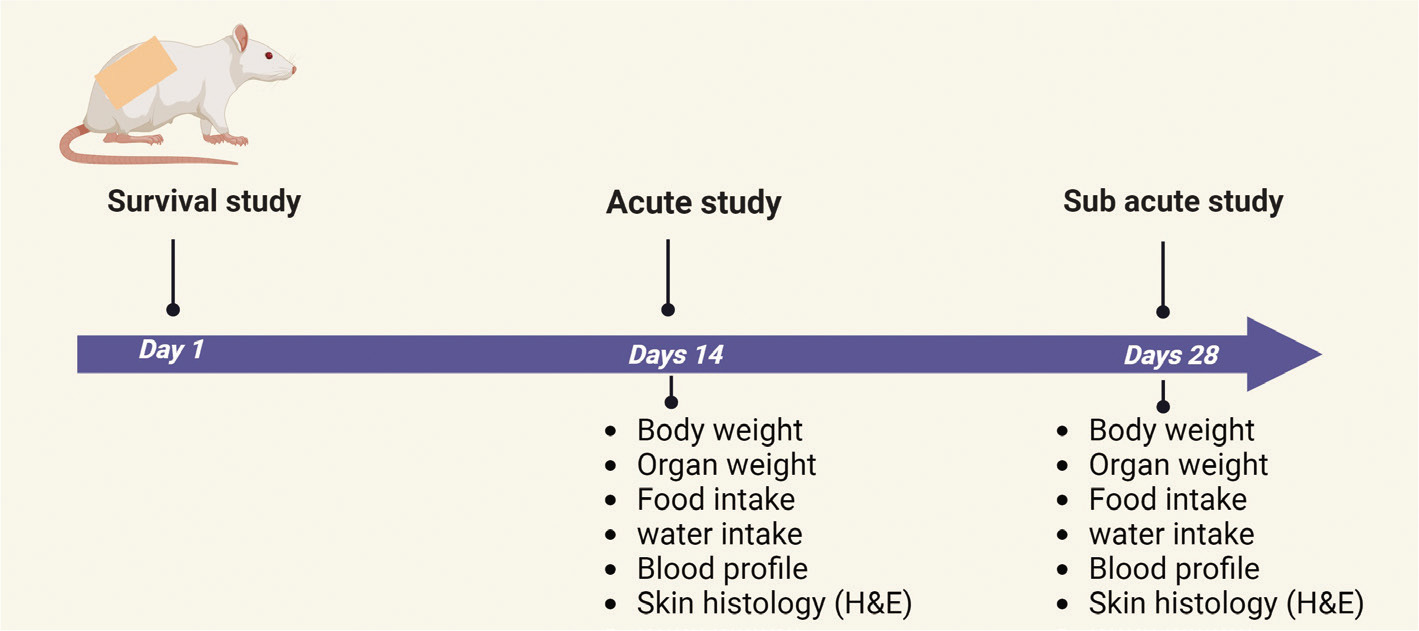
2.6. Experimental design
The in vivo dermal toxicity was designed in rats as per Figure 1. The application of HAPHE was used tropically on the skin, and the parameters were evaluated as guidelines after ethical approval.
2.6.1. Animals
In this study, Sprague-Dawley rats of both sexes, weighing between 180 and 220 g, were utilized. The rats were divided into groups and kept in the same animal room under controlled conditions: temperature (22 ± 2 °C), humidity (55 ± 10%), and a 12-hour light/dark cycle at the Animal House, KIET School of Pharmacy (KSOP), Ghaziabad, India. The study protocol received approval from the Institutional Animal Ethical Committee of KIET (Permission number: IAEC/KSOP/2023/07). The rats were given RO water and fed commercial rat pellets ad libitum. They were acclimated for 1 week before the study began.
2.6.2. HAPHE application
The rats were anesthetized with an intramuscular injection of ketamine (50 mg/kg) and xylazine (5 mg/kg) as described by (Struck et al., 2011). The fur on the dorsal thoracic area, covering about 10% of the body surface, was trimmed with an electric clipper and further shaved using a hair remover. The shaved region (as shown in the figure 4, 7) was then treated with either HAPHE or a vehicle (white paraffin). The substance was left on the skin for 24 hours, typically under a semi-occlusive dressing to prevent evaporation or removal.
2.6.3. Acute dermal toxicity
The acute dermal toxicity study was conducted following OECD guideline No. 402 with slight modifications (Test No. 402, 2017). The rats were divided into four groups (two animals per group): control, vehicle (20% soft white paraffin applied topically), 50 mg/kg (HAPHE-1), 300 mg/kg (HAPHE-2), and 2000 mg/kg (HAPHE-3). After dosing, food was withheld for an additional 3–4 hours. The animals were observed individually during the first 30 minutes, then at 2, 4, and 6 hours post-dosing, and subsequently once daily for 14 days for clinical signs of toxicity, including mortality, respiratory patterns, changes in general behavior, skin, eyes, fur, and somatomotor activity. General characteristics such as eye condition, touch response, activity level, and movement were noted before and after treatment without using any specific scoring method or instruments. All rats were monitored for mortality, edema, erythema, changes in the eyes, mucous membranes, behavior (e.g., salivation, tremors, convulsions, lethargy), and breathing patterns.
2.6.4. Sub-acute dermal toxicity study
Following a slightly modified version of the OECD guidelines no. 410 (Test No. 410, 2017), rats were assigned to four groups of five animals each. The groups included a control group treated topically with 20% soft white paraffin and three experimental groups receiving 750 mg/kg (HAPHE-1), 1250 mg/kg (HAPHE-2), and 1850 mg/kg (HAPHE-3), respectively, for 28 consecutive days.
2.7. Body weight, food, and water consumption
The body weight of the rats in each group was documented before dose administration, then weekly throughout the treatment period, and finally on the day of sacrifice. Daily records of food and water intake were kept. The quantities of food and water given to each group were measured in advance, and the leftovers were measured the following day to determine the differences. These differences were noted as daily food consumption (g/rat/day) and water consumption (mL/rat/day) (Upadhyay et al., 2019).
2.8. Blood analysis
Blood samples (1.5 mL) were drawn from the retro-orbital region of the rats for hematological and biochemical analyses after 14 and 28 days. The blood was collected in EDTA-coated tubes for hematological analysis, while for biochemical analysis, it was collected in dry tubes.
2.8.1. Hematological analysis
Blood samples collected in heparinized tubes were analyzed for various hematological parameters, including red blood cell (RBC) count, white blood cell (WBC) count, neutrophils (NP), lymphocytes (LC), monocytes (MC), eosinophils (EP), hemoglobin (Hb), platelets (PL), and packed cell volume (PCV), using an automated analyzer (KX-21 Hematology Analyzer, Sysmex Corporation, USA). The percentage of each WBC type was also determined manually from the blood smear that was stained using Wright’s stain, followed by the determination of the absolute number of each WBC type by multiplying the percentage value with the total WBC number (Upadhyay et al., 2019).
2.8.2. Biochemical analysis
Serum was obtained from blood in dry tubes and centrifuged for 15 minutes at 3000 rpm at 37°C. It was then kept at -20°C until analysis. With the Erba Chem 5 semi-auto analyzer, biochemical parameters were measured, including serum glutamic oxaloacetic transaminase (SGOT), serum glutamic pyruvic transaminase (SGPT) (Coral Clinical System), alkaline phosphatase (ALP) (Arkray Healthcare Pvt. Ltd.), and creatinine kinase (Coral Clinical System) (Upadhyay et al., 2019).
2.9. Organ weight
Following the study’s conclusion, the rats were carefully exsanguinated to reduce the amount of blood in their organs and were humanely killed (CO2 Overflow) in accordance with accepted ethical rules. The liver, kidney, and heart, among other relevant organs, were meticulously dissected and removed. After carefully rinsing each organ with physiological saline to eliminate any blood or tissue fragments, any adhering fat and connective tissues were cut away. A precision analytical balance was used to weigh the cleaned and cut organs right away, making sure the balance was calibrated correctly. Every organ’s weight was measured to the closest 0.001 g (1 mg). Relative organ weights were determined with precision by normalizing the organ weight to the animal’s body weight (organ weight/body weight × 100). All organ weight data were methodically recorded for additional examination (Ko et al., 2016).
2.10. Histological analysis
Organs, including the skin, liver, and kidneys, were removed and preserved in 10% formaldehyde for histological examination. The paraffin-embedded tissues were sliced into 5 mm sections and stained with hematoxylin and eosin. These stained sections were then observed, and all measurements were taken using a Nikon Eclipse e200 microscope equipped with a Cat Cam 300-3.0 MP camera. The images were transferred to a computer and analyzed using the Scope Tek Scope Photo ×86, 3.1.475 microscopic instrument (Upadhyay et al., 2019).
3. Results
3.1. Pharmacognostical and physiochemical standardization of HAPHE
Using techniques for sensory evaluation, the color, odor, look, texture, and taste of the HAPHE powder were evaluated. Organoleptic studies showed that the HAPHE powder had a brown color, a taste that was slightly bitter, a little rough texture, and no distinct odor. Following an evaluation of the physicochemical characteristics, the following values were found: total ash value: 11.5%; acid insoluble ash value: 0.5%; water soluble ash value: 3.5; alcohol soluble extractive value: 20.3%; water soluble extractive value: 34.2%; and loss on drying: 7.33% (Table 1). The low percentage of drying loss is advantageous as it can prevent the formation of germs and fungi, allowing for extended storage times. In additional, we employed HAPHE for the initial screening of phytochemicals and discovered the existence of proteins, carbohydrates, flavonoids, phytosterols, glycosides, tannins, and tannins incapable of obtaining the alkaloids (Table 2). The presence of these phytochemicals showed anti-inflammatory, antioxidant, cardioprotective, neuroprotective, and other metabolic disease management (Sieberi, et al., 2020).
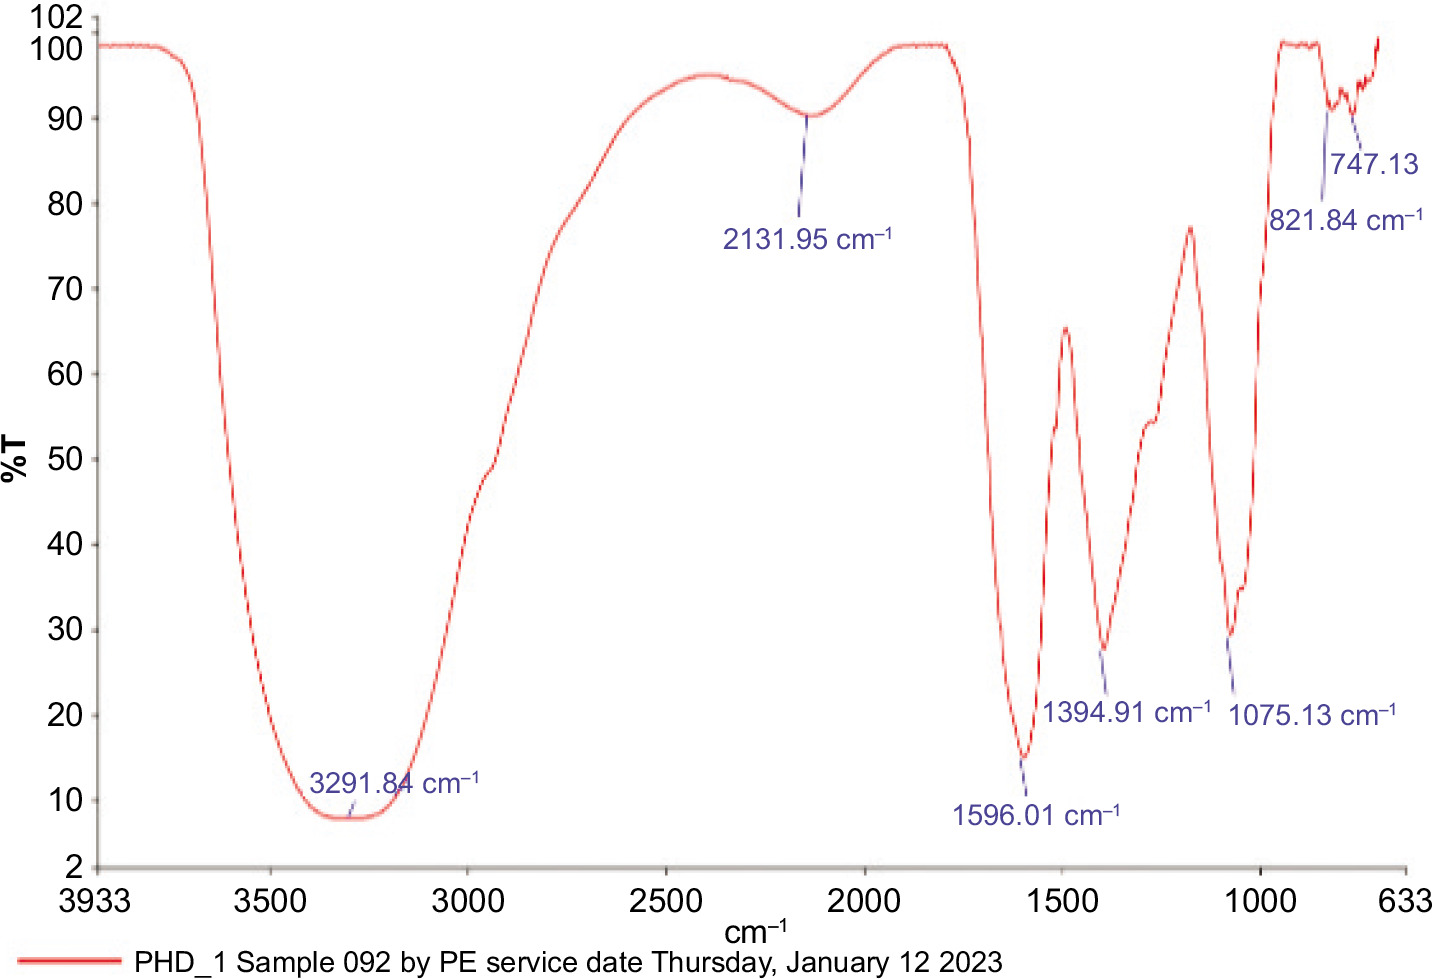
3.2. FTIR spectroscopy of HAPHE
FT-IR spectra of the polyherbal samples were recorded on a PerkinElmer FTIR spectrometer over the 4000–700 cm−1 range to identify functional groups responsible for the bioactivities. The FTIR analysis of the polyherbal extract highlights its significant therapeutic potential, revealing the presence of various functional groups associated with bioactive properties (Dalir, et al., 2020).(Figure 2). Key absorption bands were identified, including N-H (amines, amides) at 3291.84 cm−1, alkynes, allenes, ketenes, and isocyanates (X=C=Y) at 2131.95 cm−1, and N-H (amines, amides) at 1596.01 cm−1. Additionally, the presence of C-X (fluorides, halides) at 1394.91 cm−1, C-N, C-O (alcohols, ethers, esters, carboxylic acids) at 1075.13 cm−1, and C-X at 767.13 cm−1 was observed. These functional groups suggest the presence of flavone, quercetin, amines, halides, alkynes, and other compounds known for their anti-inflammatory and wound-healing properties.
3.3. Total phenol and flavonoids of HAPHE
3.3.1. Total phenolic content
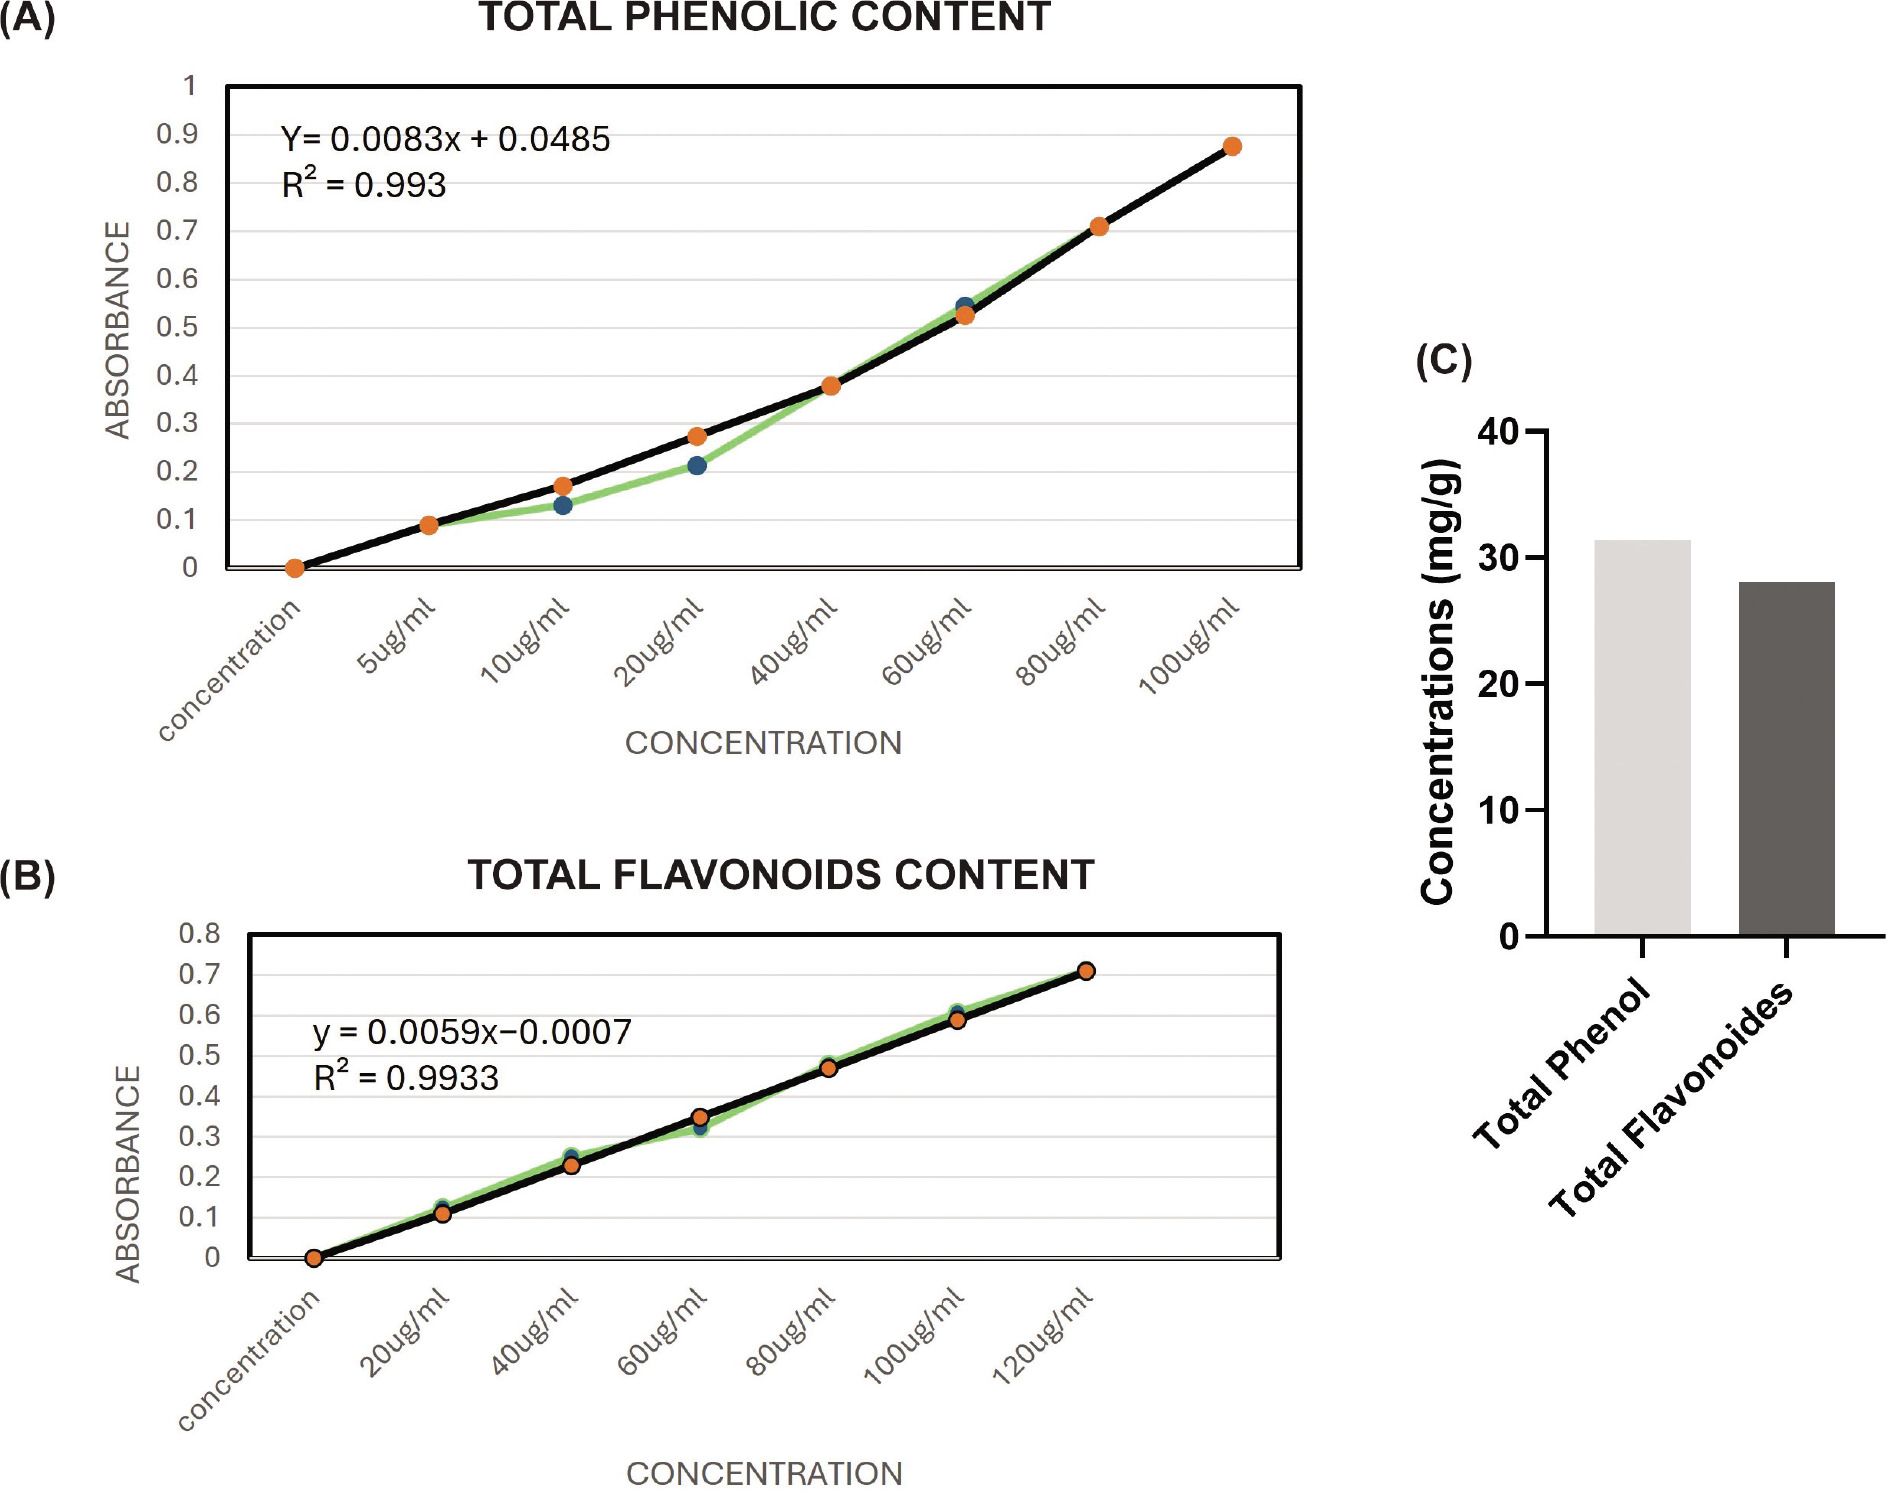
The Folin-Ciocalteu technique was used to determine the total phenol content. The reference used to create the standard curve (y = 0.0083x + 0.0485, R² = 0.993) (Figure 3A) was the equivalent of gallic acid. Figure 3C shows that the total phenol concentration in HAPHE was determined to be 31.38 mg/g gallic acid equivalent (Figure 3C).
3.3.2. Total flavonoids content
The AlCl3 colorimetric method was used to determine the total flavonoid concentration. The standard curve (y = 0.0059x – 0.0007, R² = 0.993) for quercetin was used as the reference (Figure 3B). It was shown that HAPHE contained a total of 28.10 mg/g of flavonoids, or quercetin equivalent (Figure 3C).
3.4. Antioxidant activities of the HAPHE
Numerous studies on plants and polyherbal extracts have highlighted their antioxidant activities, attributed to their phenolic and flavonoid content, which offer significant therapeutic benefits in disease management. We utilized HAPHE to assess antioxidant activities through DPPH radical scavenging and H2O2 peroxidase assays.
3.4.1 DPPH Radical Scavenging Assay
The antioxidant activity was evaluated using the DPPH radical scavenging method. The reduction in DPPH absorbance in an ethanol solution indicated the formulation’s capacity to scavenge free radicals. The percentage inhibition was calculated and compared with ascorbic acid. The percentage IC50 value was calculated and found 37.96 µg/ml in the standard (ascorbic acid), and in HAPHE, the IC50 was 44.35 µg/ml (Table 3).
3.4.2. Hydrogen peroxide Scavenging assay
The [15] method measured the H2O2 scavenging activity. Ascorbic acid and hydrogen peroxide’s percentage inhibition were computed and compared. In HAPHE, the IC50 value was 39.73 µg/ml, whereas in the standard (ascorbic acid), it was 24.02 µg/ml (Table 4).
3.5. HAPHE showed no toxicity in acute dermal toxicity
After HAPHE application on the rat’s skin to the assigned group (Figure 4), the survival study was conducted for 24 hrs. In the Kaplan-Meier graph, no mortality was recorded (Figure 5A). The average body weight was recorded on Day 1 and Day 14 and was found to be significantly increased in all groups of HAPHE. HAPHE-3 (P<0.0001) showed higher body weight among others from day to day 14 (Figure 5B). The food weight was not found significant in HAPHE-3 (P=0.0012) and HAPHE-1, but HAPHE-2 (P<0.0001) showed significant changes from the control (Figure 5D). The water intake also showed non-significant changes in HAPHE-1 (P=0.0139 and HAPHE-3 (P=0.996) treatment from the control. However,HAPHE-2 (P<0.0001) showed significant changes (Figure 5C). After euthanasia, the organ weight was calculated of the collected liver, kidney, and spleen after day 14. It was found non-significant from the control in HAPHE-1, HAPHE-2, and HAPHE-3 (Figure 5E). The behavior parameters were also observed and found no changes in HAPHE groups (Table 5). Further, the hematological analysis was done from the isolated blood after day 14, and no significant changes were found in the control group (Table 6). The histopathological image of the skin has not shown any morphological changes of the skin (Figure 6). Overall, in the acute study, we didn’t find a toxicity effect of HAPHE at any dose in rats, behavioral, physiological, biochemical, or pathological, over the skin application.
Table 5
Behavioral changes monitored during acute dermal toxicity study.
Table 6
Effects of HAPHE application (14 days) on Haematological Parameters in Rats.
Figure 4
The image showed the shaved area before and after HAPHE was applied for acute dermal toxicity. HAPHE-1 (50 mg/kg), HAPHE-2 (300 mg/kg) and HAPHE-3 (2000 mg/kg).
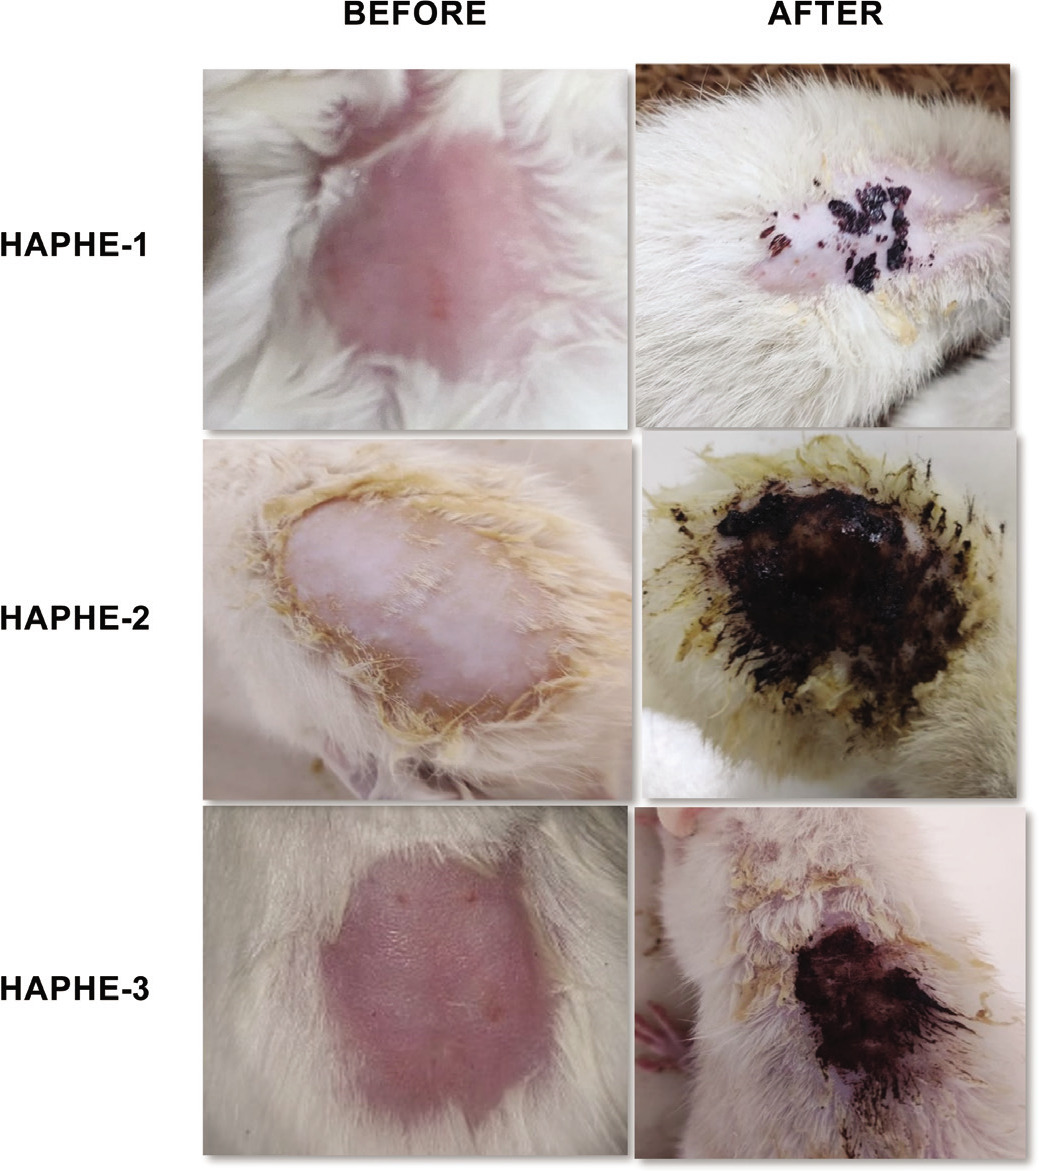
Figure 5
Acute dermal toxicity study of HAPHE in rats for 14 days. (A) Kaplan–Meier graph for survival study of rats for 24 hours after application of the HAPHE on the skin. (B) Average body weight (g) was recorded on day 1 and day 14 of rats. (C) Average water intake/rat (ml) (D) Average food intake of g/rat (E) Organ weight of the rat after day 14 (g/100 g body weight) of liver, kidney, and spleen. Control- 20% soft white paraffin, HAPHE-1 (50 mg/kg), HAPHE-2 (300 mg/kg), and HAPHE-3 (2000 mg/kg). n=3, Data present in the Mean±SEM.
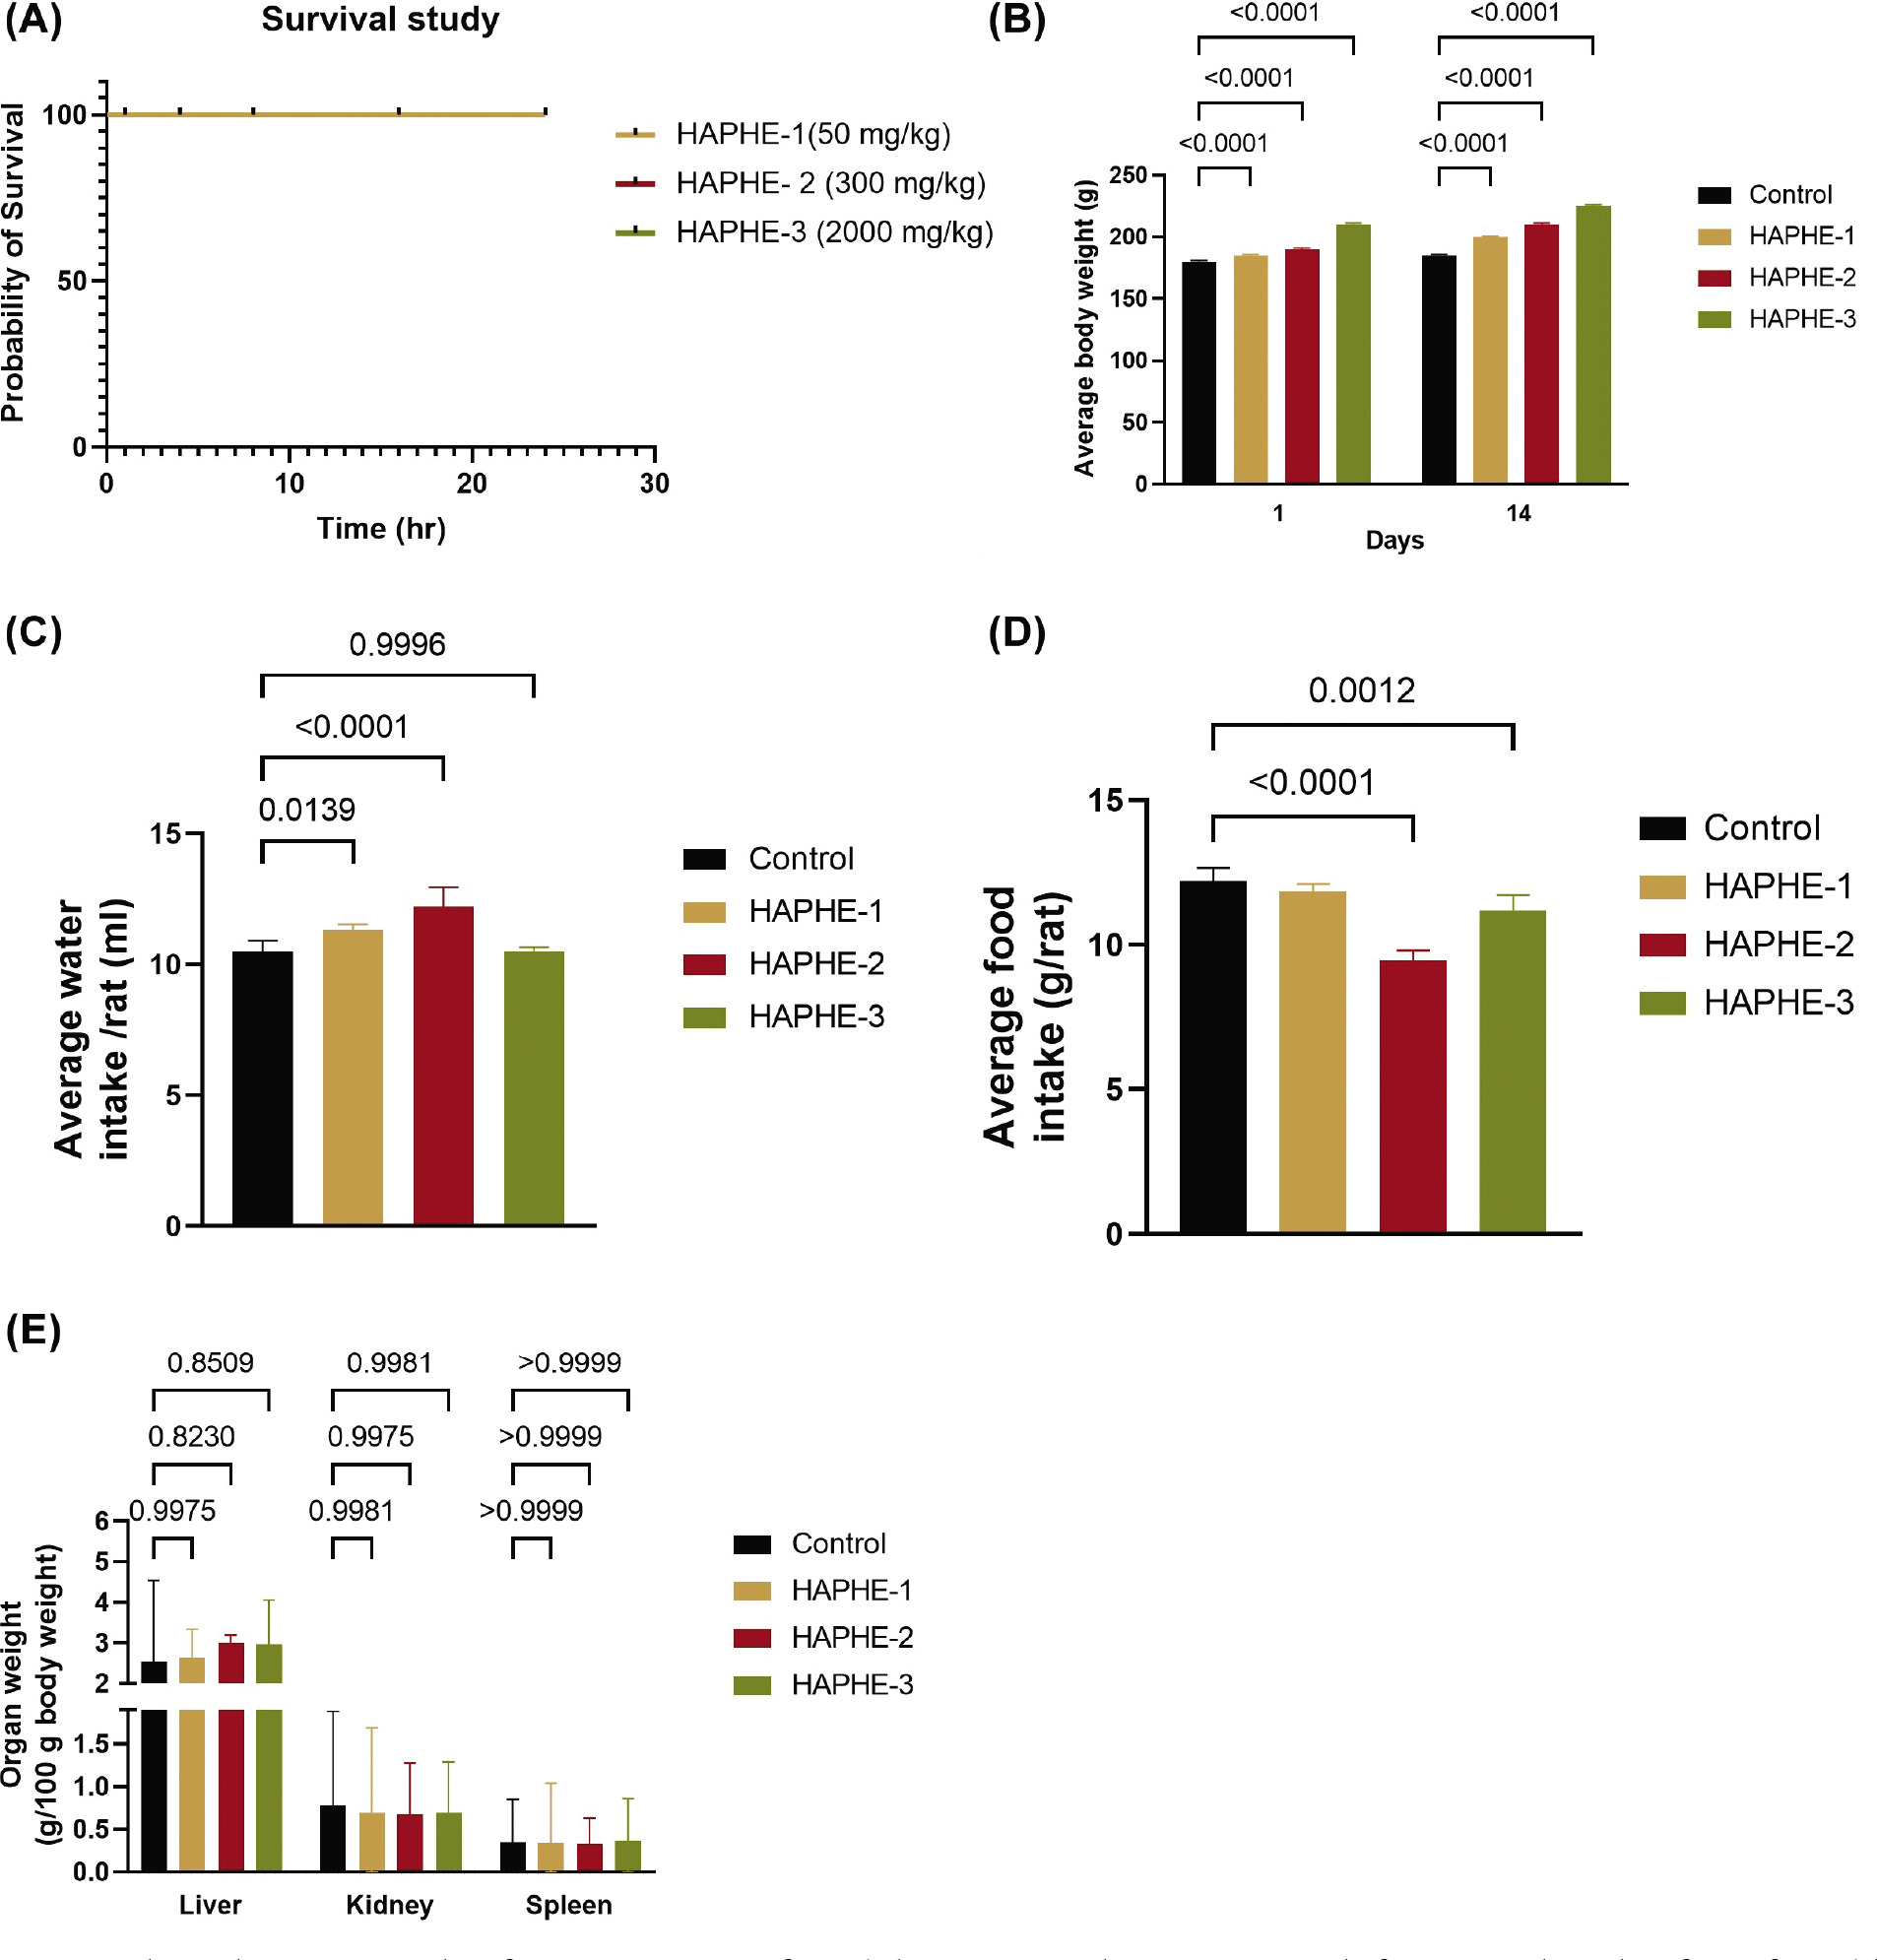
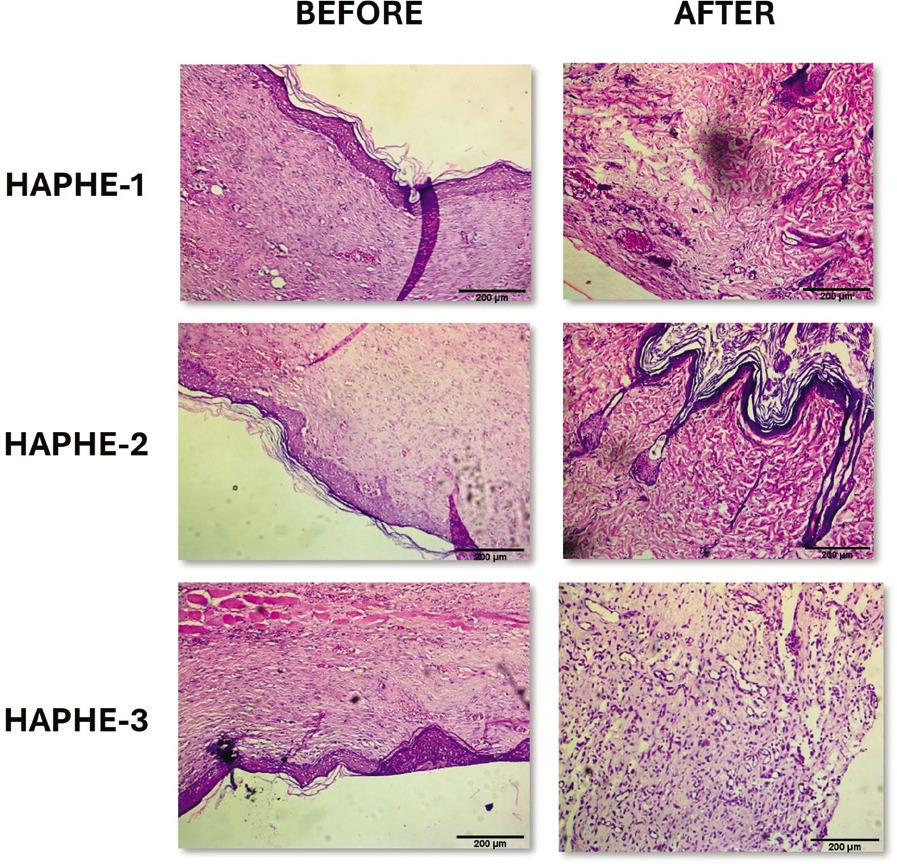
Figure 6
Histopathology slides of skin after 14 days of acute dermal toxicity studies on rats before and after HAPHE. There are no significant pathological lesions observed in all groups in the dermal toxicity study of HAPHE (H & E staining 10 × magnification). HAPHE-1 (50 mg/kg), HAPHE-2 (300 mg/kg), and HAPHE-3 (2000 mg/kg). Scale bar 200µm.
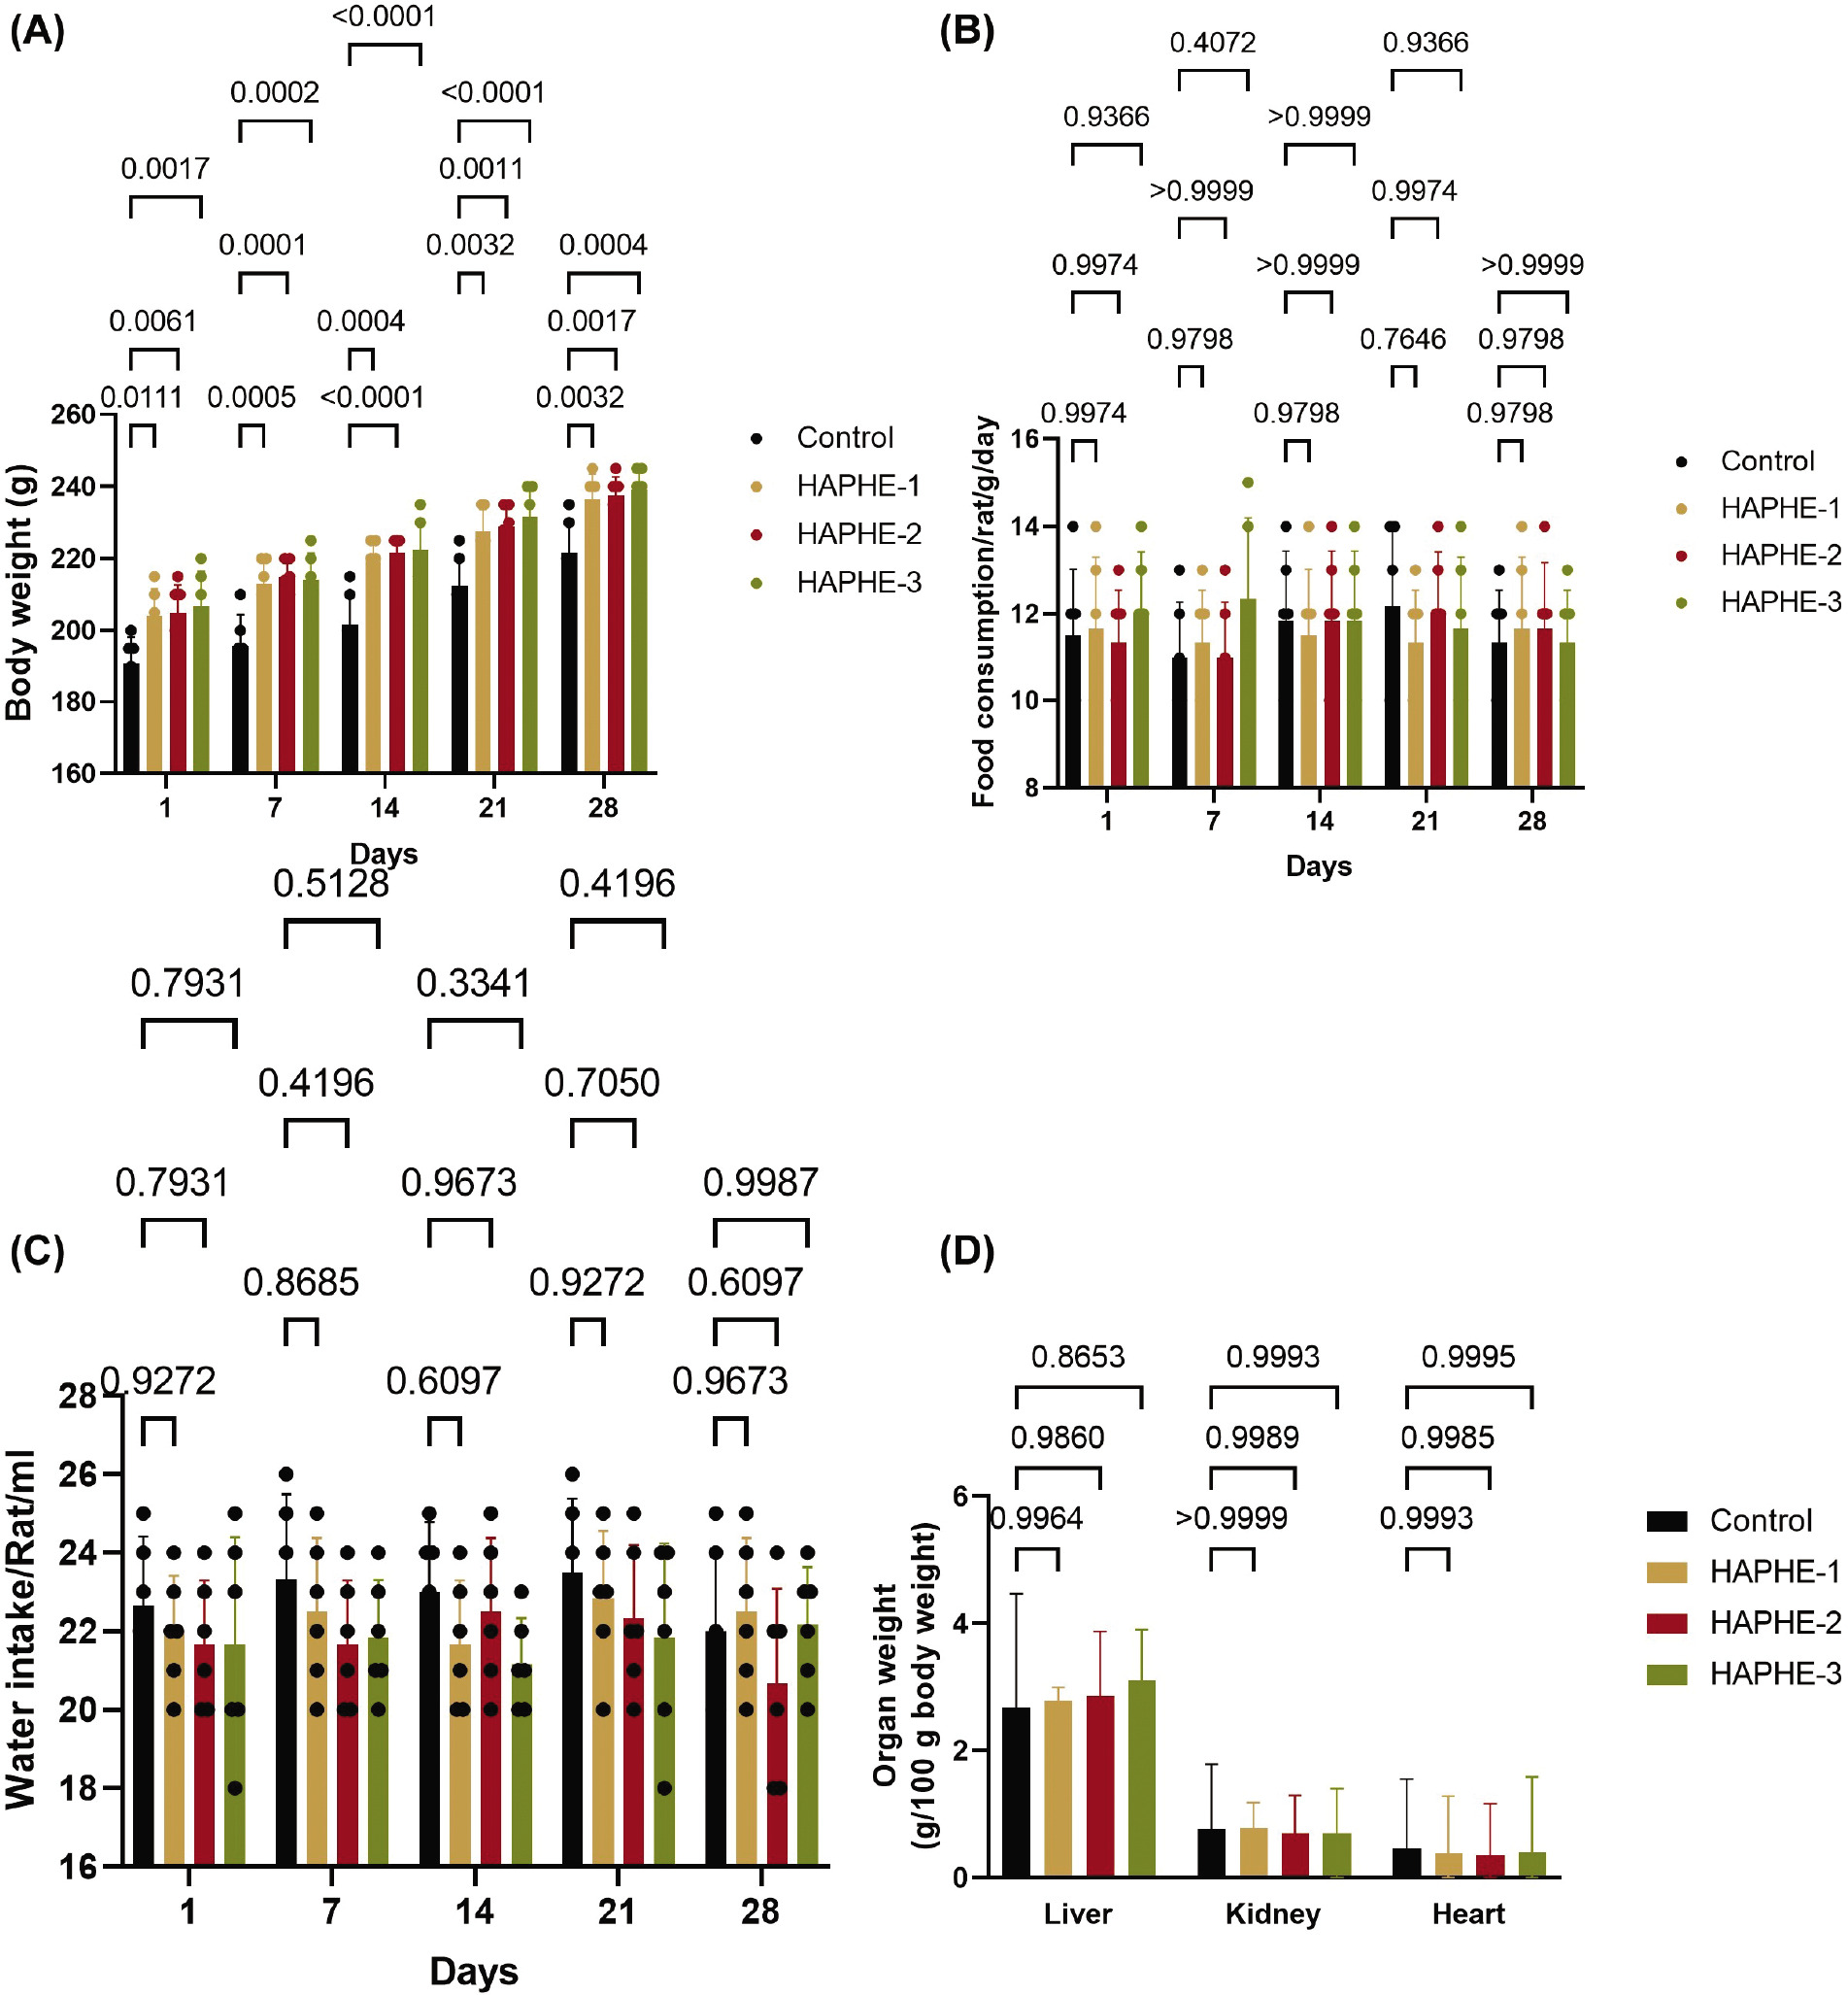
3.6. HAPHE showed no toxicity in Subacute dermal toxicity
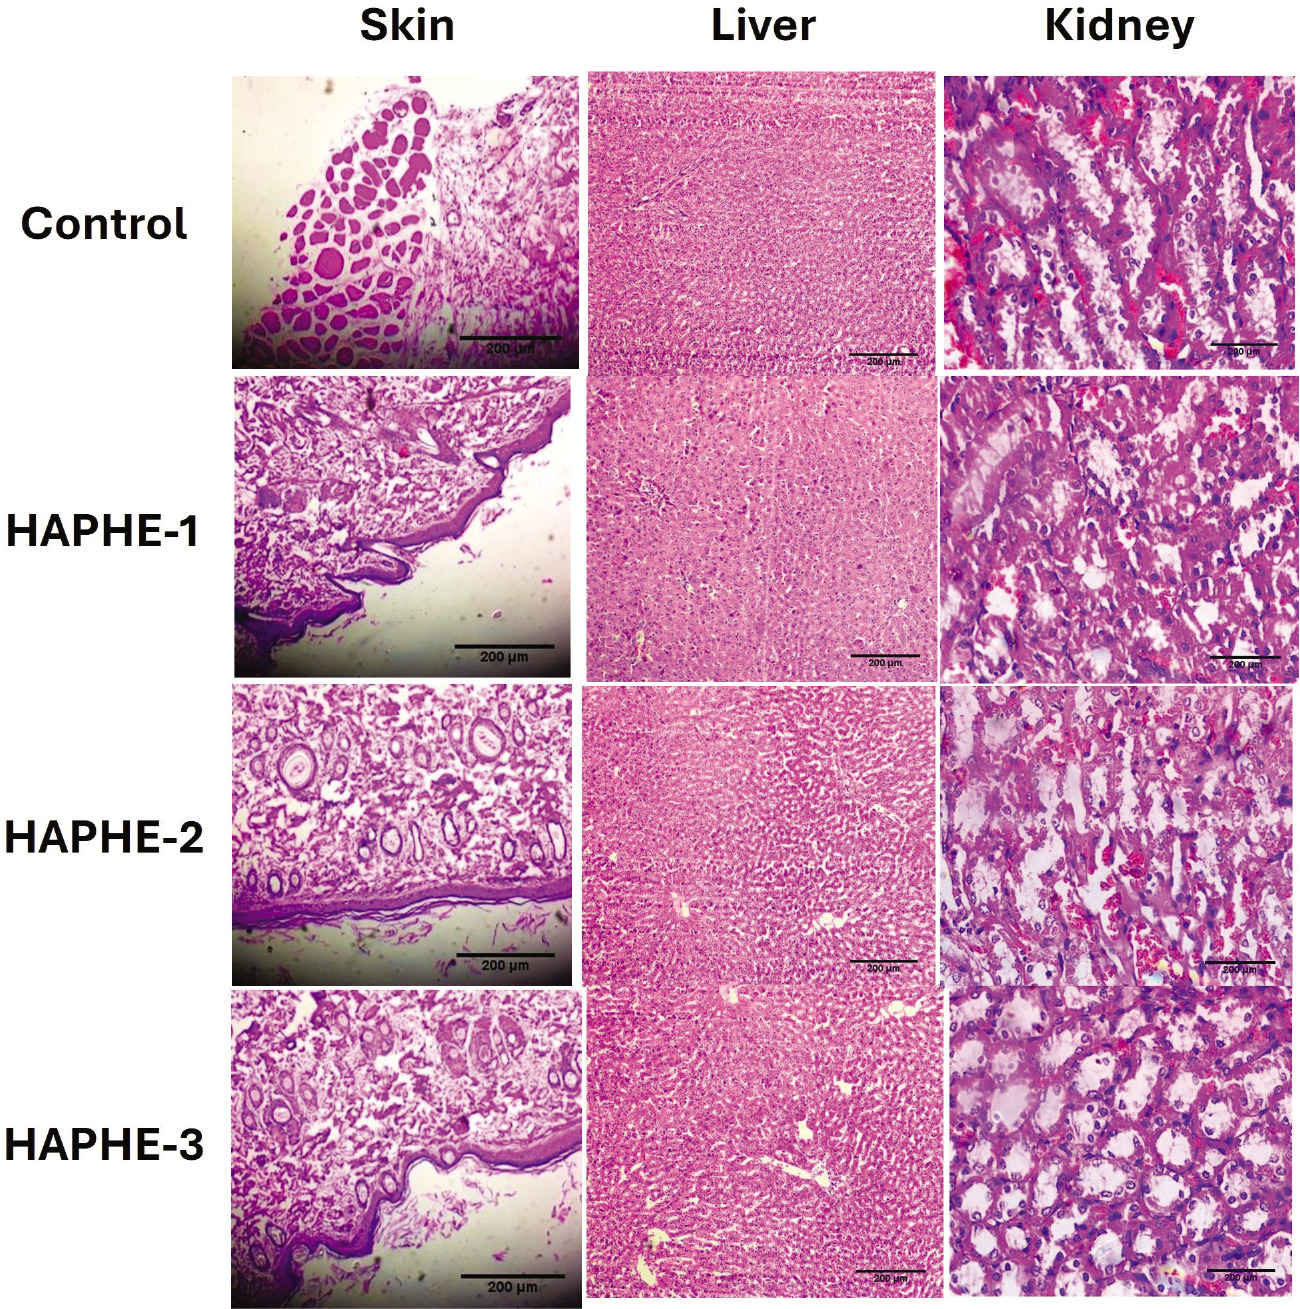
In the acute study, we didn’t find any symptoms or toxicity effects. Then, we further did the sub-acute dermal toxicity for 28 days and recorded the body weight, food weight, water intake, and organ weight. The study monitored food and water consumption, body and organ weight, and hematological and biochemical parameters. The representative image showed the dermal application of HAPHE and control group (Figure 7). The body weight was recorded from day 1 to day 28 of the control and all groups of HAPHE and found non-significant after application on the skin (Figure 8A). The food intake showed a normal pattern from day 1 to day 28 (Figure 8B) and showed no significant changes from the control in HAPHE groups. Similarly, the water intake also showed no significant changes from the control in HAPHE groups (Figure 8C). The organ weight after euthanasia on day 28, the liver, kidney, and heart didn’t show significant changes from the control (Figure 8D). The hematological parameter from the blood showed no significant changes from the control, and all parameters were in the range and showed no toxicity effect in the circulatory system (Table 7). Similarly, the liver and kidney parameters also showed no changes from the range and were found nonsignificant in comparison to the control (Table 8). The histopathological image of the essential organs, skin, liver, kidney, and heart, did not show any changes in the morphology, indicating the no toxicity effect of HAPHE during application over skin at a high dose (Figure 9). These non-significant changes of HAPHE-1, HAPHE-2, and HAPHE-3 showed no toxic effect over dermal application in rats and are safe to use.
Table 7
Effects of 28 days of dermal application of the HAPHE on Haematological Parameters in Rats.
[i] All statistical data was expressed in mean ± SEM (n=6) and determined by one-way ANOVA followed by Tukey’s multiple comparison test, and no significant effect was observed. Control - 20% soft white paraffin, HAPHE-1 (750 mg/kg), HAPHE-2 (1250 mg/kg), and HAPHE-3 (1850 mg/kg). RBC - Red blood cells, N - Neutrophils, L- Lymphocytes, E - Eosinophils, Hb - Hemoglobin, WBC - White blood cells.
Table 8
Effect of 28 days of dermal application of the HAPHE on serum liver and kidney biomarkers.
Figure 7
Representative image of the Clipped skin area of a negative control rat (white paraffin) and applied with HAPHE.
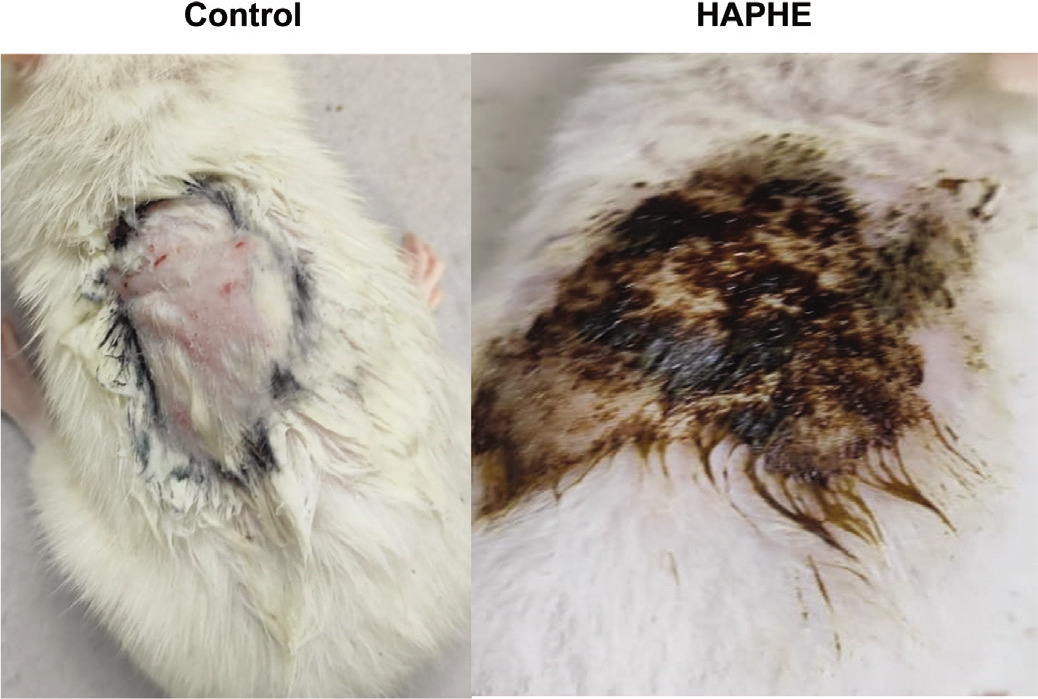
Figure 8
Subacute dermal toxicity study of HAPHE in rats for 28 days. (A) Average body weight (g) was recorded on days 1, 7. 14, 21, and 28 of rats. (C) Average water intake/rat (ml) (D) Average food intake of g/rat (E) Organ weight of the rat after day 14 (g/100 g body weight) of liver, kidney, and spleen. Control- 20% soft white paraffin, HAPHE-1 (750 mg/kg), HAPHE-2 (1250 mg/kg), and HAPHE-3 (1850 mg/kg). n=6, Data present in the Mean±SEM.
4. Discussion
Standardizing herbal formulations is crucial for ensuring their efficacy, safety, and consistency. This process involves quantifying and maintaining the consistency of active compounds, such as phenols and flavonoids, which are vital in managing various diseases (Shahidi et al., 2015). These compounds, found abundantly in many medicinal plants, are known for their strong antioxidant properties. They help neutralize free radicals and reduce oxidative stress, which is a significant factor in the development of chronic diseases like cancer, diabetes, and cardiovascular disorders (Sharifi-Rad et al., 2020). Moreover, phenols and flavonoids possess anti-inflammatory properties that play a key role in regulating inflammatory responses. This makes them particularly beneficial in managing conditions such as arthritis and other inflammatory disorders (Sadhu et al., 2014).
The WHO guidelines for herbal formulation standardization emphasize ensuring the safety, efficacy, and quality of herbal medicines, especially in the post-COVID era. This includes rigorous identification and quantification of active compounds, quality control processes, and adherence to Good Manufacturing Practices (GMP), (Demeke et al., 2021), (Alhazmi et al., 2021). The guidelines also recommend clinical validation of efficacy through controlled trials. After COVID-19, the importance of traditional medicine has grown, and WHO advocates integrating these practices with evidence-based approaches to enhance global health resilience and ensure that herbal formulations meet international standards for therapeutic use (Demeke et al., 2021).
The study at hand investigates a polyherbal formulation composed of three plants: Mimusops elengi, Psidium guajava, and Aegle marmelos. These plants are rich in bioactive compounds such as alkaloids, flavonoids, tannins, and other phytochemicals, which contribute to their therapeutic effects, including antioxidant, anti-inflammatory, antimicrobial, and cardioprotective activities (Batiha et al., 2020). Based on the previously published research studies of individual plants, we combined these three for our study to check the effectiveness of formulation in a synergistic way to mitigate the disease through multiple targets.
The standardization of the formulation HAPHE was performed to validate the formulation for further development. Preliminary phytochemicals in the formulation will help us find lead molecules against complicated diseases. The FTIR spectroscopy of HAPHE showed the functional group of the phenol and flavonoids, indicating the higher content present in this extract. Additionally, quantitative methods confirmed that the total phenol content was 31.38 mg/g gallic acid equivalent, and the total flavonoid content was 28.10 mg/g quercetin equivalent. These values are important as they correlate with the formulation’s antioxidant activities. The antioxidant activity was further assessed using the DPPH radical scavenging method and the H2O2 scavenging assay. The IC50 values for HAPHE in these assays were 44.35 µg/ml and 39.73 µg/ml, respectively, indicating its strong antioxidant potential.
Ensuring the safety of herbal formulations is paramount. This study evaluated the safety of HAPHE through acute and subacute dermal toxicity tests. In the acute study, no mortality or significant changes in body weight, food intake, water intake, or organ weight were observed in the rats treated with HAPHE. Hematological, biochemical, and histopathological analyses also revealed no significant differences from the control group, indicating that HAPHE did not induce any toxic effects. Similarly, the subacute dermal toxicity study showed no significant changes in any assessed parameters, confirming the formulation’s safety.
5. Conclusion
This study successfully developed and standardized a polyherbal formulation composed of Mimusops elengi, Psidium guajava, and Aegle marmelos, demonstrating its therapeutic potential in managing inflammation and oxidative stress-related conditions. The formulation exhibited significant antioxidant activity, attributed to its rich polyphenol and flavonoid content, which are known to neutralize reactive oxygen species and reduce cellular damage. Furthermore, the in vivo safety evaluation confirmed the formulation’s non-toxic nature, as no adverse effects were observed in acute and subacute dermal toxicity studies. These findings validate the formulation’s suitability for topical application, ensuring its potential for safe and effective use in therapeutic interventions. Standardization is a critical factor in herbal medicine, as variations in phytochemical composition can affect efficacy and reproducibility. This study emphasizes the importance of maintaining consistent bioactive compound levels to ensure uniform therapeutic benefits. By addressing this challenge, the research contributes to the broader acceptance of polyherbal formulations in evidence-based medicine, supporting their integration into modern healthcare systems. Additionally, the synergistic interaction of the selected medicinal plants enhances their individual therapeutic properties, making the formulation more effective than single-plant extracts. Furthermore, its strong antioxidant and anti-inflammatory properties, this polyherbal formulation has promising clinical applications in managing chronic skin disorders, such as eczema, psoriasis, and wound healing.
Author Statement
We, the undersigned authors, hereby declare that this manuscript is original, has not been previously published, and is not under consideration for publication elsewhere. All listed authors have reviewed and approved the manuscript, and no eligible contributors have been excluded. Additionally, we confirm that the authorship order has been mutually agreed upon. We acknowledge that the Corresponding Author will serve as the primary point of contact throughout the editorial process, responsible for liaising with co-authors regarding progress, revision submissions, and final proof approvals.
CRediT authorship contribution statement
Preeti Sharma: Resources, Formal analysis, Data curation, Writing – review and editing. Shikhar Verma: Writing – review, Methodology, Validation and vediting, Supervision.
Declaration of Competing Interest
The authors declare that they have no known competing financial interests or personal relationships that could have appeared to influence the work reported in this paper.
Acknowledgments
We acknowledge the Animal House staff of KIET School of Pharmacy (KSOP), Ghaziabad, India to support and conduct the in vivo study. We are also thankful to the Institutional Animal Ethical Committee of KIET for approval of the study protocol.
Data availability
The data generated during the study are enclosed in a manuscript with figures and tables of results.
Areas of Conflict
The author has stated that there are no potential conflicts of interest concerning this article’s research, writing, or publication.
Abbreviations
HAPHE: Hydroalcoholic extract of polyherbal herbal extract, DPPH: 1, 1-DIPHENYL-2-PICRYLHYDRAZYL, TP: Total phenolics, TF: Total flavonoids, KBr: Potassium bromide, RBC: Red blood cell count, WBC: White blood cell count, NP: Neutrophils, LC: Lymphocytes, MC: Monocytes, EP: Eosinophils, Hb: Hemoglobin, PL: Platelets, PCV: Packed cell volume, H2O2: Hydrogen peroxide, QE: Quercetin equivalents, SGOT: Serum glutamic acid oxidase, SGPT: Serum glutamic pyruvic transaminase, ALP: Alkaline phosphatase, GMP: Good manufacturing practices.