

1. INTRODUCTION
Alongside the rise in life expectancy, the number of elderly people worldwide is also growing. The world’s population in 2016, those aged over 65 years, is around 8.5%, which is projected to be 17% or 1.6 billion by 2050. All organs in the elderly are subject to change. Skin, the body’s outermost barrier, has protective functions and consists of the dermis and epidermis. Dermis primarily comprises fibroblasts embedded within the extracellular matrix (ECM). Age-related alterations to the dermis layer include the fragmentation and reduction in the amount of collagen in the dermis ECM. These changes are influenced by increased matrix metalloproteinase activity and impaired signaling of growth-β factor transformation induced by an increase in reactive oxygen species (ROS) that occurs during the aging process. Reduced collagen during aging leads to the inhibition of the interaction of fibroblasts and ECM, resulting in impaired fibroblast function. Other ECM components, such as elastic fibers, glycosaminoglycan (GAG), and proteoglycans (PG), are also reduced during the process of aging. The reduction of dermis components leads to the appearance of wrinkled skin and reduced skin elasticity (Shin et al., 2019). The changes that appear in the dermis of the skin during aging are due to the quantitative and structural changes in collagen. These changes that occur due to increased collagen degradation and reduced collagen biosynthesis lead to loss of skin elasticity and the appearance of wrinkles in the skin. The levels of matrix metalloproteinase (MMP) enzyme, which breaks down the ECM proteins, are also increased during aging. The main protease that degrades collagen fibers is MMP-1. The epidermal keratinocytes and dermal fibroblasts are the main sources of MMP in the skin; MMP is also synthesized by the endothelial cells, as well as by various immune cells. ROS has a significant influence on the elevated MMP levels in the dermis of the skin. Sources of ROS include those from outside and from inside the body. Examples of ROS sources from outside the body include ultraviolet light, while those from inside the body include metabolism that produces prooxidants. ROS play a significant role in cellular signaling. They activate the mitogen-activated protein kinase (MAPK) pathway, which in turn triggers the activation of activator protein-1 (AP-1), a transcription factor that is the primary regulator of MMPs. Additionally, ROS also activates NF-κB, another crucial transcription factor. NF-κB acts as a mediator and increases the MMP levels in skin fibroblasts in response to UV exposure. In general, excessive free radical damage causes skin tissue damage, which appears in the form of deep wrinkles. The skin under normal circumstances produces the enzyme elastase, and exposure to ROS or UV radiation speeds up elastase production, which is a degrader of elastin. Elastin is the main component of elastin fibers found in connective tissue, tendons, and connective tissue under the epidermis. The activated elastase enzyme causes wrinkles on the skin (Nur et al., 2017). Glycosaminoglycan levels, especially hyaluronic acid (HA), decrease in skin during aging. Hyaluronic acid binds to water molecules, and factors such as size, pH, salt content, and related cations affect the shape of HA polymers. Mesenchymal cells are the primary source of HA, and progressive reduction in HA polymer size leads to skin aging (Nobile et al., 2014).
The skin aging process involves two factors, namely the intrinsic and the extrinsic factors. Intrinsic factors include loss of cells, thinning of the epidermis, changes in dermal junctions, and wrinkles of the skin. Extrinsic factors are mainly influenced by UV rays that cause wrinkles on the skin and dyspigmentation. Inflammatory reactions and accumulation of ROS contribute to the changes associated with skin aging (Zhuan & Lyga, 2014).
Chronic inflammation is a hallmark of aging. Aging can also be accompanied by immune system disorders. Research shows that inflammatory reactions in men are higher than in women, so men live shorter than women. All cells, during aging process, undergo dysfunctional aging and produce senescence-associated secretory phenotype (SASP). SASP produced by old cells triggers aging of normal cells. SASP also causes chronic inflammation, leading to organ inflammation. SASP contains proinflammatory mediators, including IL-6, TNF-α, COX-2, and IL-1β (Li et al., 2023).
A variety of tropical plants, including the rambutan fruit (Nephelium lappaceum L.) peel, are being investigated for their potential to rejuvenate skin and combat signs of aging. The rambutan tree, a member of the Sapindaceae family, originated in Southeast Asia (Hernández et al., 2017). Research has shown that rambutan peel is a great source of various biologically active components. These include organic acids including oxalic, ascorbic, citric, fumaric and shikimic acids; different forms of vitamin E (alpha-, gamma-, and delta-tocopherol); and a wide range of fatty acids, such as capric, undecylic, lauric, tridecylic, myristic, palmitoleic, palmitic, stearic, heptadecanoic, oleic, linolelaidic, linoleic, arachidic, α-linolenic, eicosenoic, arachidonic, eicosatrienoic, behenic, erucic, eicosapentaenoic, cis-13,16-docosadienoic, tricosylic, lignoceric, nervonic, and docosahexaenoic acids). Rambutan peel, among others, is known for its antimicrobial and antioxidant properties (Albuquerque et al., 2023).
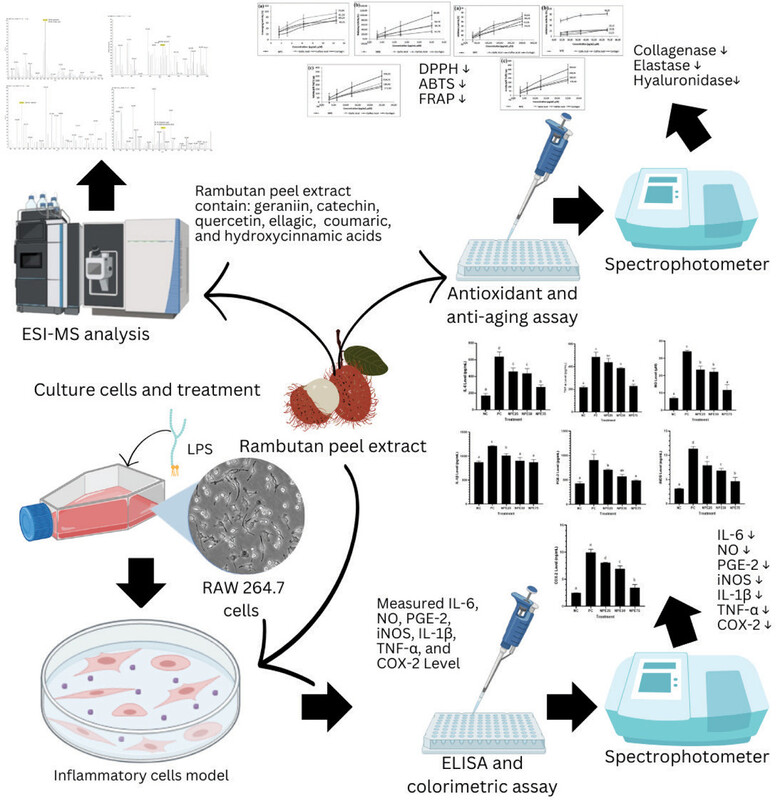
This research focused on examining the antioxidant, anti-inflammatory, and antiaging properties of a specific extract derived from N. lappaceum peel extract (NPE). Additionally, the study sought to identify the bioactive constituents responsible for these effects. The phytochemical profile of NPE was analyzed using a modified Farnsworth method, while compound identification was performed via ESI-MS. The antioxidant capacity was assessed using various assays such as ABTS radical cation decolorization, DPPH radical scavenging, and Ferric Reducing Antioxidant Power (FRAP). Antiaging potential was assessed using inhibition assays targeting collagenase, hyaluronidase, and elastase enzymes. Cell viability was assessed using the MTS assay, a method that employs the tetrazolium salt compound 3-(4,5-dimethylthiazol-2-yl)-5-(3-carboxymethoxyphenyl)-2-(4-sulfophenyl)-2H-tetrazolium. To investigate the anti- inflammatory effects of the treatment, researchers used ELISA to measure various inflammatory biomarkers. This analysis was performed on LPS-stimulated RAW 264.7 macrophage cells and focused on key markers such as iNOS, PGE-2, Interleukin-6, TNF-α, COX-2, NO, and Interleukin-1β.
2. MATERIALS AND METHODS
2.1. Chemicals
Reagents from Sigma-Aldrich included gallic acid 97% purity (147915), caffeic acid with 98% purity (CO625), 2,2-Diphenyl-1-picrylhydrazile (DPPH) solution (D9132), tris buffer 100 mM and pH 8, porcine pancreatic elastase (Cat No. 45124), and n-succinyl-ala-ala-ala-p-nitroanilide substrate (Cat No. 54760). Meanwhile, FeCl3 (Cat No. 1.03861.0250), 100% H2SO4 (Cat No. 109073), HCl 2N (Cat No. 1003171000), amyl alcohol (10979), Mg (Cat No. EM105815), collagenase from Clostridium histolyticum (Cat No. C8051) were sourced from Merck, USA, and corilagin with 98% purity from Chengdu Biopurify Phytochemical, 23094-69-1, PRC.
2.2. Nephelium lappaceum extract preparation
Extraction was conducted based on the maceration procedure (Palanisamy et al., 2008). Rambutan was sourced from the Kesamben-Blitar plantation in East Java, Indonesia. “World Flora Online” has already verified the plant’s name (www.worldfloraonline.org). After drying, the rambutan peels were macerated in 70% alcohol and evaporated (Widowati et al., 2015, 2016a, 2020). Gallic acid (97% purity), caffeic acid (98% purity), and corilagin (98% purity) served as standard chemicals in this investigation.
2.3. ESI-MS analysis
The TSQ Tune system, functioning under the positive ionization mode, was utilized to regulate the TSQ QUANTUM ACCESS tandem mass spectrometer, coupled with an electrospray ionization (ESI) source. In the context of direct infusion ESI-MS analysis, the configuration includes a sample delivery rate of 5 µL/min, a spray voltage setting of 3 kV, evaporation temperature maintained at 50 °C and capillary heated to 27 °C, and nitrogen gas employed as the sheath gas with a pressure of 5 psi. The system is operated using Xcalibur 2.1 software, which also manages UPLC components such as a thermostated autosampler, a vacuum degasser, and a quaternary gradient pump. Using a Hypersil Gold column (50 mm × 2.1 mm × 1.9 μm), the mobile phase was run at a flow rate of 300 μL/min, following a specific gradient. The mobile phase began with 80% B for the first minute, dropped to 20% B for the next 2 min, and then returned to 80% B for the final 30 s. The injection volume of the system was 1 μL, with the autosampler and column temperatures maintained at 16 and 30 °C, respectively. The TSQ Tune software controlled the MS/MS conditions, enabling the use of an ESI interface to switch between positive and negative ionization modes. Experimental parameters included spray voltage set at 2.5 kV, capillary heated to 300 °C and evaporation temperature of 250 °C. The sheath gas was maintained at 40 psi, auxiliary gas was set to 10 psi, and argon served as the collision gas (Kaliawan & Danardono, 2021).
2.4. Qualitative phytochemical screening assay
The Farnsworth-adapted method for the qualitative identification of phenols, steroids/triterpenoids, alkaloids, flavonoids, terpenoids, saponins, and tannins was used to evaluate phytochemical scanning NPE, as indicated below (Prahastuti et al., 2020; Widowati et al., 2015, 2018, 2020).
2.4.1. Phenol identification
A 10 mg sample was applied onto the plate, after which a 1% FeCl3 solution was added.
2.4.2. Triterpenoid steroid identification
Acetic acid was added to the 10 mg sample on the plate. The procedure was continued until the sample was fully saturated. A drop of concentrated (100%) H2SO4 was introduced for 10-15 min. The presence of triterpenoids was indicated by orange or red sediment, whereas green or blue hues indicated the presence of steroids.
2.4.3. Saponin identification
Water was added to 10 mg of the sample in a test tube, shaken firmly, and allowed to boil for 5 min. The formation of froth on the surface of the sample indicated the presence of saponin.
2.4.4. Tannin identification
Two milliliters of 2N HCl was added to 10 mg of the sample and boiled in a water bath for 30 min. The mixture was then cooled, filtered, and amyl alcohol was added. The appearance of a purple color confirmed the presence of tannins.
2.4.5. Terpenoid identification
Vanillin and H2SO4 were added to 10 mg of the sample placed on the plate. The appearance of a purple hue indicated the presence of terpenoids.
2.4.6. Flavonoid identification
HCl 2N and Mg were added to 10 mg of the sample in a test tube. The mixture was heated for 5-10 min, filtered, and then the addition of amyl alcohol. The appearance of orange or red color indicated the presence of flavonoids.
2.4.7. Alkaloid identification
Ten milligrams of the sample was placed in a tube containing a 10% ammonia. Chloroform was then introduced, leading to the formation of two distinct layers—an oily layer on top, which was subsequently collected. Upon the addition of 1 N HCl, two liquid layers were formed. The upper layer was separated, followed by the addition of 1-2 drops of Dragendorff’s reagent. A yellow coloration confirmed a positive test result.
2.5. Antioxidant activity assays
The antioxidant activity of NPE was evaluated using DPPH, ABTS, and FRAP assays. For the DPPH assay, 50 μL of each sample was mixed with 200 µL of 0.077 mM DPPH solution in methanol in a 96-well microplate and incubated at room temperature in the dark for 30 min before absorbance measurement using a Multiskan GO Microplate Spectrophotometer. The ABTS radical scavenging activity was determined by mixing 50 µL of sample with 200 µL of pre-formed ABTS+ radical solution in a 96-well microplate, followed by incubation at room temperature, and the decrease in absorbance was measured spectrophotometrically. The FRAP assay was performed by mixing 50 μL of sample with 200 μL of freshly prepared FRAP reagent in a 96-well microplate, incubating the mixture at 37 °C, and measuring the absorbance to evaluate the reduction of Fe3+ to Fe2+. The antioxidant activities were expressed as IC50 values for DPPH and ABTS assays and as µM Fe(II)/µg sample for the FRAP assay (Sohn et al., 2003; Widowati et al., 2015, 2020).
2.6. Anticollagenase assay
The potential of the samples to inhibit collagenase was assessed using a modified protocol from Sigma-Aldrich. The assay mixture was prepared by combining 10 μL of collagenase from C. histolyticum (0.01 U/mL), 60 μL of tricine buffer (50 mM, pH 7.5, with 10 mM CaCl2 and 400 mM NaCl), and 30 μL of the test sample (at concentrations ranging from 0-250 μg/mL). After incubating this mixture at 37 °C for 20 min, 20 μL of the substrate N-[3-(2-Furyl)acryloyl]-Leu-Gly-Pro-Ala (1 mM in tricine buffer) was added. The absorbance of the final solution was then measured at a wavelength of 335 nm.
Collagenase Inhibition % = (B-A)/B×100%
A = Absorbance sample test
B = Absorbance control
2.7. Antielastase assay
An elastase inhibition assay was conducted to evaluate the sample’s effectiveness. The assay mixture was prepared by combining 125 μL of tris buffer (100 mM, pH 8), 5 μL of porcine pancreatic elastase, and 10 µL of the test sample. This mixture was preincubated for 15 min at 25 °C, followed by the addition of 10 μL of N-succinyl-Ala-Ala-Ala-p-nitroanilide (2 mg/mL in tris buffer). The mixture was then incubated for an additional 15 min at 25 °C. The absorbance of the final solution was then measured at a wavelength of 410 nm.
% Elastase inhibition = (B-A)/B×100%
A = Absorbance sample test
B = Absorbance control
2.8. Antihyaluronidase assay
A modified protocol was used to perform the hyaluronidase inhibition assay, with all reagents obtained from Sigma-Aldrich, USA. 3 μL of bovine testes type I-S hyaluronidase was preincubated at 37 °C for 10 min. This was followed by the addition of 25 µL of the test sample (at various concentrations) to the enzyme and mixing it with 12 μL of 300 mM phosphate buffer (pH 5.35) for subsequent incubation. Finally, 10 µL of an HA substrate was added, and the mixture was incubated for an additional 45 min at 37 °C. The reaction was terminated by adding 100 µL of acidic albumin solution. After a 10-min incubation at room temperature, absorbance was measured at 600 nm (Thitilertdecha et al., 2010; Widowati et al., 2021). The percentage of hyaluronidase inhibitory activity was calculated using the following formula:
% Hyaluronidase inhibition = (B−A)/B×100%
A = Absorbance of the sample
B = Absorbance of the control
2.9. Cell culture and proinflammatory activation of RAW 264.7
RAW 264.7 macrophage cells, obtained from Aretha Medika Utama of BBRC, Bandung, West Java, Indonesia, were used for this study. The cells were plated in 6-well plates at a density of 5 × 10³ cells per well. The culture medium, based on Dulbecco’s Modified Eagle Medium (DMEM), was supplemented with 5% fetal bovine serum (FBS), 0.1% gentamicin, and 1% antibiotic-antimycotic (ABAM). The cells were incubated for 24 h at 37 °C in a humidified incubator with 5% CO2. After this initial incubation, the old medium was removed and replaced with fresh growth medium and the test extract, with each well receiving 1600 µL of fresh medium and 200 μL of the extract. This mixture was incubated for 1-2 h. Proinflammatory conditions were then induced by adding 200 μL of lipopolysaccharide (LPS) (at a concentration of 1 μg/mL) to each well, and the cells were incubated for an additional 24 h. This procedure was adapted from previous studies.
2.10. Cell viability assay
Cell viability was determined using the MTS assay, a colorimetric method that relies on the reduction of a yellow tetrazolium salt into a purple formazan product. RAW 264.7 cells were seeded at a density of 5 × 10³ cells per well in 96-well plates and cultured for 24 h at 37 °C in a humidified 5% CO2 atmosphere. The medium was then replaced with fresh culture medium containing the rambutan peel extract at various concentrations (25, 50, 75, and 100 μg/mL) and incubated for another 24 h. Following this, 20 µL of MTS reagent was added, and the plates were incubated for a further 3 h. The absorbance was subsequently measured at 490 nm with a Multiskan GO Microplate Spectrophotometer to calculate cell viability as a percentage relative to an untreated control.
2.11. Quantification of IL-1β, NO, TNF-α, iNOS, PGE-2, IL-6, and COX-2 levels
Proinflammatory marker expression levels (IL-1β, iNOS, PGE-2, TNF-α, COX-2, and IL-6) were quantified with Elabscience ELISA Kits: IL-1β (E-EL-M0037), COX-2 (E-EL-M0959), PGE-2 (E-EL-0034), iNOS (E-EL-M0696), TNF-α (E-EL-M0049), and IL-6 (E-EL-M0044), following the procedures provided by the manufacturer (Laksmitawati et al., 2017; Novilla et al., 2017; Saanin et al., 2020; Sandhiutami et al., 2017; Widowati et al., 2016b, 2021). Quantification of nitric oxide levels was performed using the Elabscience E-BC-K035-M colorimetric method, strictly adhering to the manufacturer’s recommended protocol. A sodium nitrite calibration curve was employed to determine nitrite concentrations (Widowati et al., 2021).
2.12. Total protein assay
To prepare the BSA standard, a dilution was performed from the bovine serum albumin stock solution. The standard (Sigma, A9576, Lot. SLB2412) was prepared by dissolving 2 mg of BSA in 1000 µL of double-distilled water. Following this, 200 µL of Quick Start Dye Reagent 1X (Bio-Rad, 5000205) and 20 µL of reference standards were added to each well immediately. The plate was then incubated at room temperature for 5 min, and the absorbance was measured at 595 nm using a microplate spectrophotometer (Widowati et al., 2019).
2.13 Statistical analysis
Statistical analysis was performed using SPSS version 20.0, with all results expressed as the mean ± standard deviation. To determine the appropriate test, the data were first evaluated for homogeneity of variance using Levene’s test and for normality using the Shapiro-Wilk test. If the variables were not normally distributed, the Kruskal-Wallis or Mann-Whitney tests were applied. For normally distributed data, a one-way ANOVA was used, followed by Tukey’s HSD post hoc analysis to identify specific group differences. p < 0.05 was considered statistically significant.
3. RESULTS
3.1. Phytochemical screening of NPE
A preliminary phytochemical analysis of NPE is presented in Table 1. Phytochemical screening revealed the presence of phenols, flavonoids, saponins, steroids, and tannins in the extract. NPE contained low to moderate levels of terpenoid and tannin, with lower levels of phenol, triterpenoid, saponin, and flavonoid.
3.2. ESI-MS of NPE
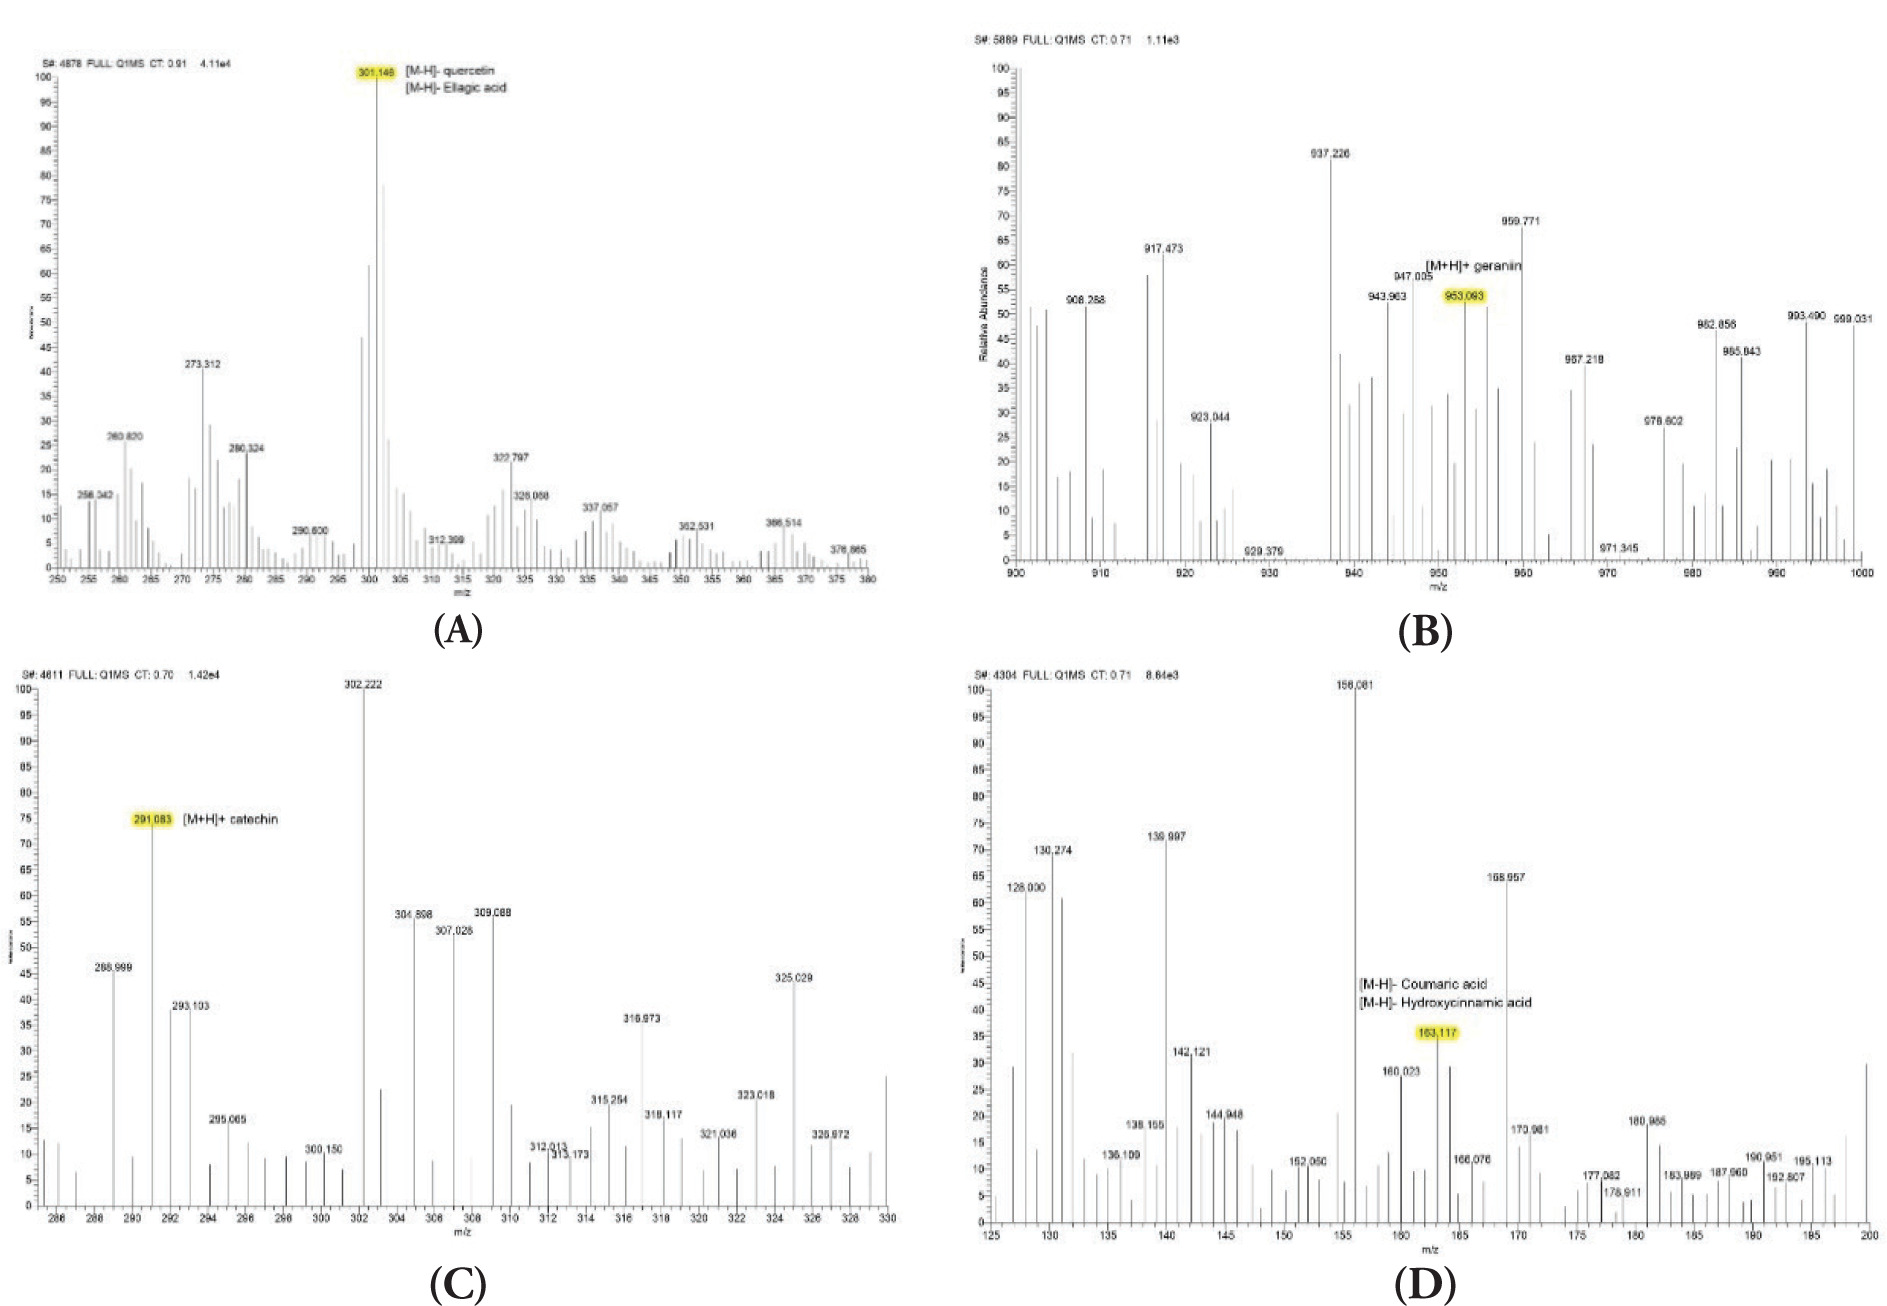
The ESI-MS chromatogram results are shown in Figure 1. According to the study, NPE has the following compounds: geraniin, catechin, ellagic acid, quercetin, coumaric acid, and hydroxycinnamic acid.
Figure 1
ESI-MS spectrum of NPE. (A) Mass spectrum of 250-380 m/z (301,146): [M-H]-quercetin and [M-H]-Ellagic acid; (B) Mass spectrum of 900-1000 m/z (953,093): [M+H]+geraniin; (C) Mass spectrum of 285-330 m/z (291,083): [M+H]+catechin; (D) Mass spectrum of 125-200 m/z (163,117): [M-H]-Coumaric acid and [M-H]-Hydroxycinnamic acid
3.3. NPE effect on antioxidant activities
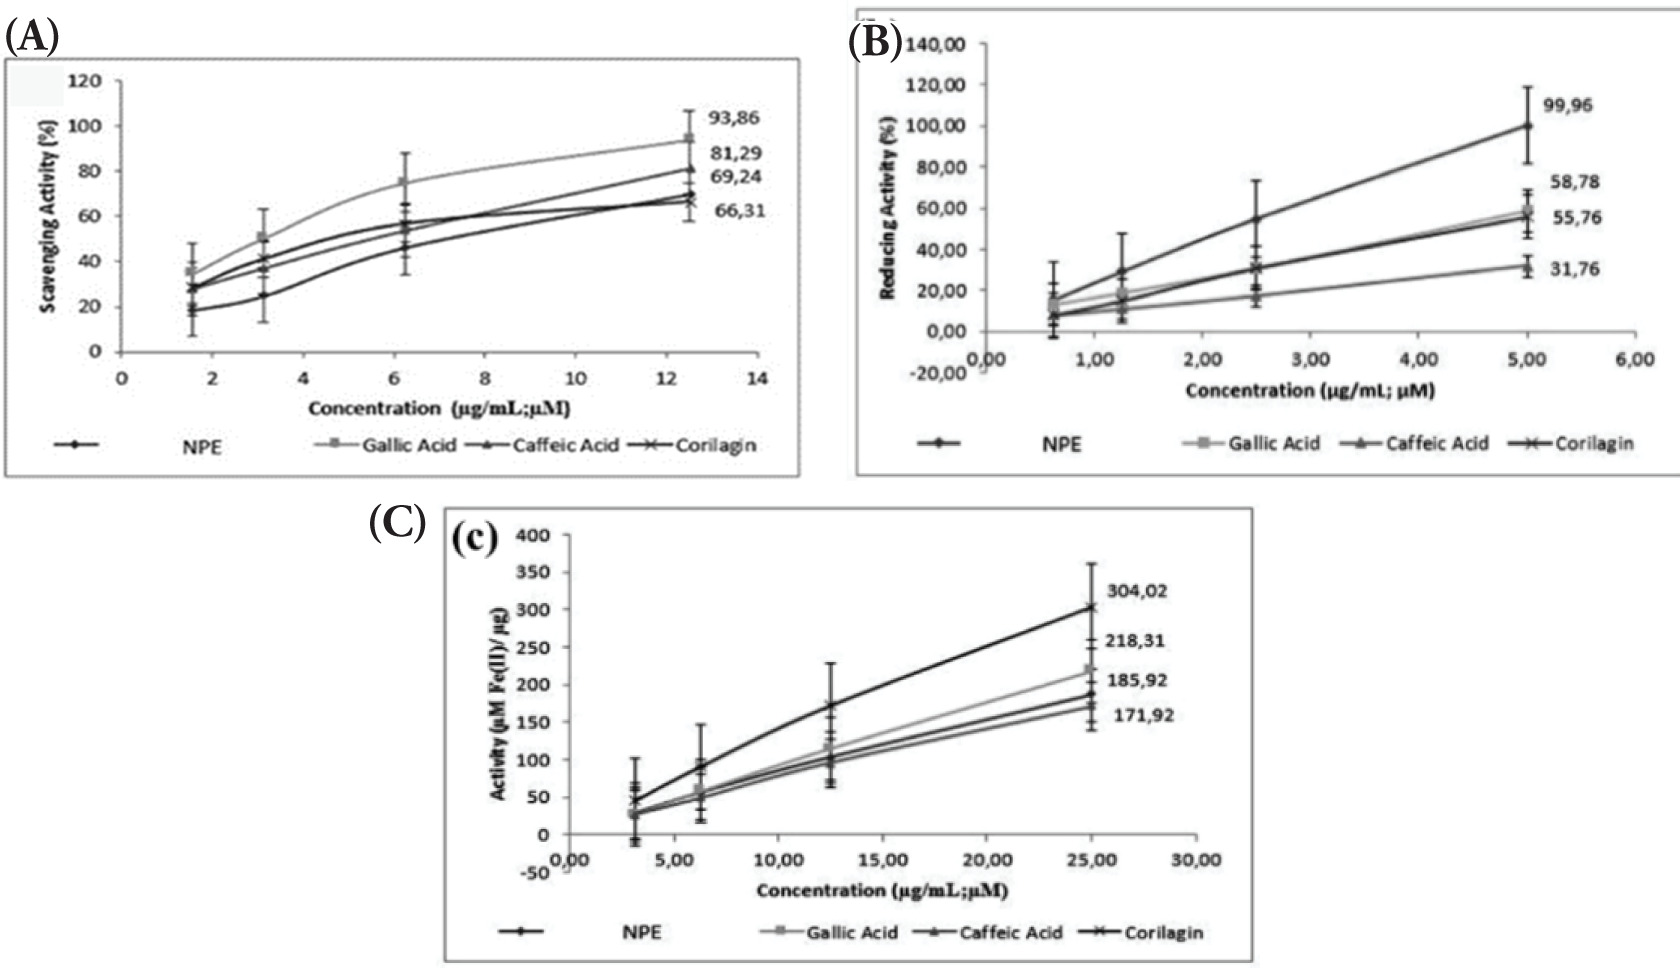
The antioxidant activities of NPE, along with gallic acid, caffeic acid, and corilagin, were evaluated through DPPH, ABTS, and FRAP assays. Figure 2 demonstrates that NPE and the antioxidant activity of the investigated chemicals were concentration-dependent. In the DPPH experiment, the highest quantity of gallic acid (12.50 µg/mL) produced the best scavenging activity. NPE 5.00 µg/mL produced the greatest decrease in the ABTS assay. Meanwhile, 25 μg/mL corilagin produced the greatest decrease in the FRAP testing.
Figure 2
(A) DPPH scavenging activity; (B) ABTS reduction activity; (C) FRAP scavenging activity of NPE, gallic acid, caffeic acid, and corilagin.
Additionally, the IC50 was used to assess the antioxidant capacities of the samples. Among the samples, NPE exhibited the highest DPPH test IC50 and the second-highest ABTS IC50 (Table 2). This suggests that, when compared to gallic acid, caffeic acid, and corilagin, NPE was the lowest DPPH scavenger and the second-lowest ABTS inhibitor.
Table 2
IC50 value DPPH scavenging and ABTS-reducing activity of NPE, gallic acid, caffeic acid, and corilagin.
3.4. NPE effect on elastase, hyaluronidase, and collagenase inhibitory activities
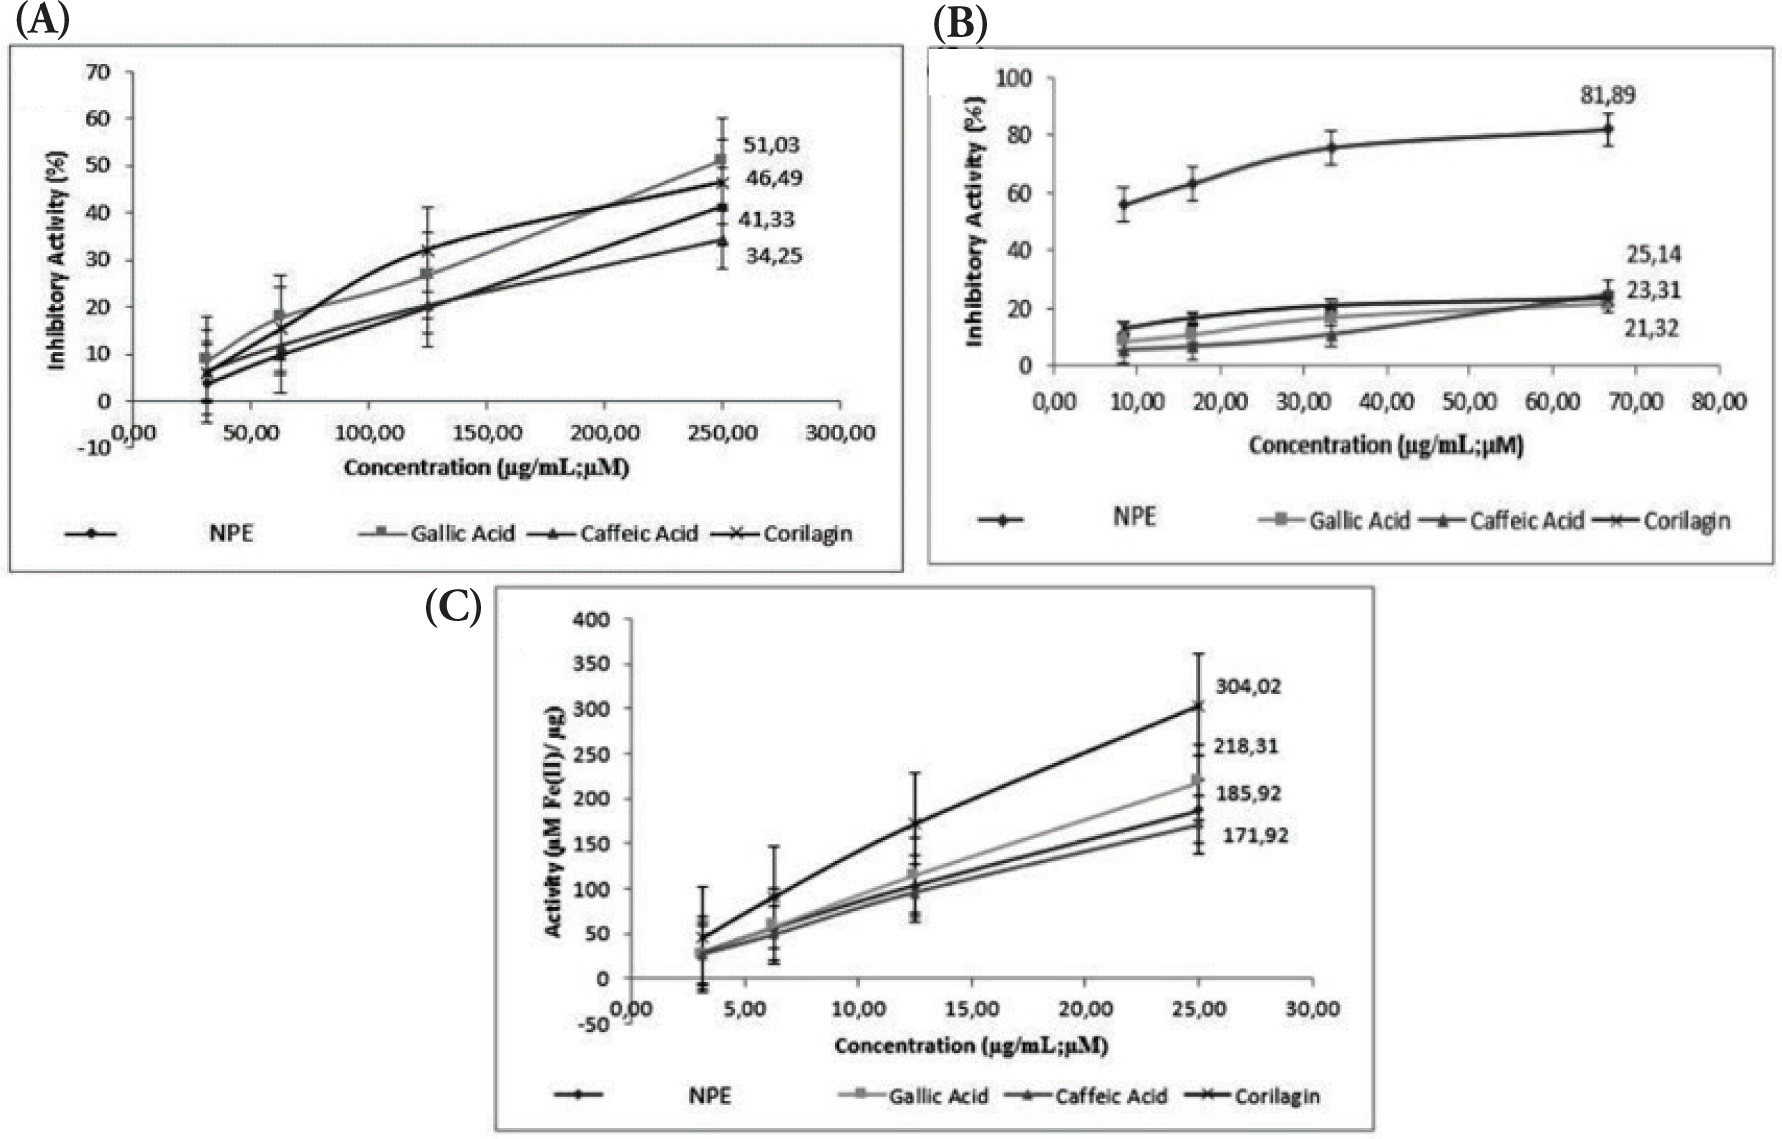
By halting the breakdown of the dermal matrix, the substances that suppress collagenase activity help to maintain healthy skin. In inflammatory and photoaged skin, some flavonoids, particularly flavanols, have been shown to block collagenase and stop collagen degradation (Widowati et al., 2016a). The antiaging activity of NPE, gallic acid, caffeic acid, and corilagin was examined using collagenase, elastase, and hyaluronidase inhibition assays and the results are presented in Figure 3. All the tested samples effectively inhibited elastase, hyaluronidase, and collagenase. The level of inhibition for each enzyme increased as the concentration of the sample increased, demonstrating a concentration-dependent effect. Gallic acid had the strongest collagenase inhibition, whereas NPE produced the second-lowest inhibition. NPE produced the strongest inhibition of elastase and hyaluronidase.
Figure 3
(A) Collagenase; (B) elastase; (C) hyaluronidase inhibition activity of NPE, gallic acid, caffeic acid, and corilagin.
Additionally, as shown in Table 3, the IC50 of the samples was used to calculate the antiaging inhibition. NPE inhibits collagenase with the greatest IC50 and elastase and hyaluronidase with the lowest IC50. Therefore, when compared to gallic acid, caffeic acid, and corilagin, NPE was the strongest elastase and hyaluronidase inhibitor, but the lowest collagenase inhibitor.
Table 3
IC50 values of collagenase, elastase, and hyaluronidase inhibitory activity of NPE, gallic acid, caffeic acid, and corilagin.
3.5. Cell viability
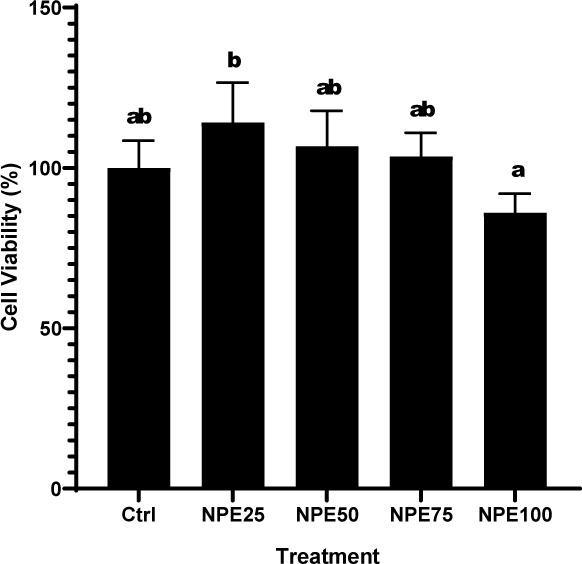
A viability experiment was performed to determine the safe NPE concentration that is not harmful to RAW 264.7. Treatment concentrations that produced a cell viability percentage greater than 90% were deemed nontoxic to the cell in question. NPE concentrations of 25, 50, and 75 µg/mL were utilized in the subsequent assays as they were deemed nontoxic in this investigation (Figure 4).
Figure 4
Effect of varying NPE concentrations on the viability of RAW 264.7 cells.
(Ctrl: Control, normal cell; NPE25: 25 µg/mL NPE; NPE50: 50 µg/mL NPE; NPE75: 75 µg/mL NPE; NPE100: 100 µg/mL NPE)
*The result was shown as mean ± SD. Tukey’s HSD post hoc test (p < 0.05) is used to produce statistical differences. The various letters (a, ab, b) demonstrate a significant difference between a wide range of treatments.
3.6. NPE effect on IL-6, NO, PGE-2, iNOS, IL-1β, TNF-α, and COX-2 levels in inflammatory cells model
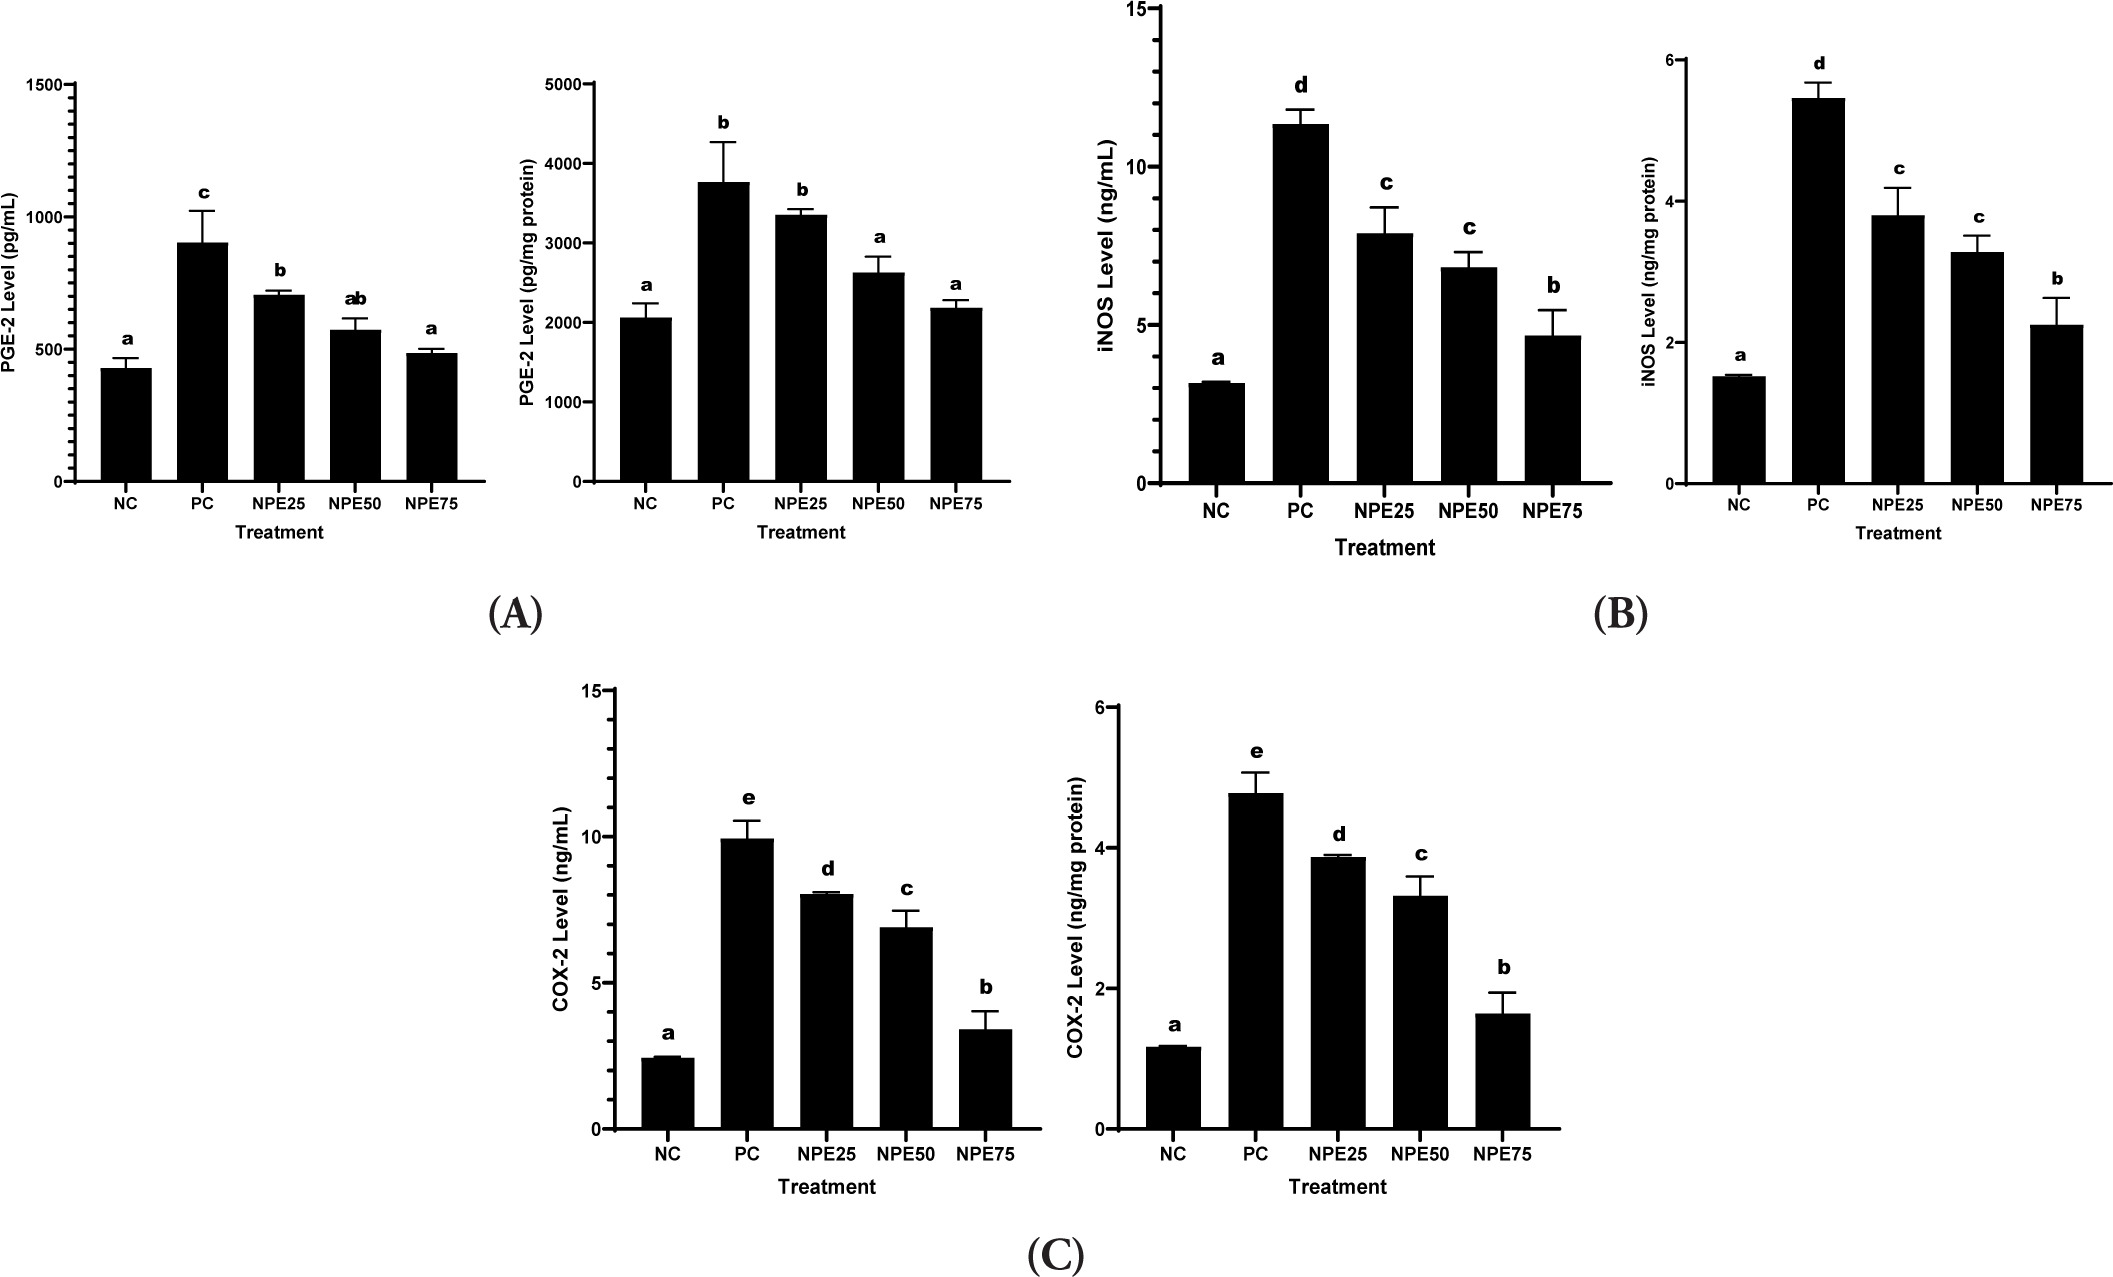
It was observed that LPS exposure significantly elevated IL-6, COX-2, NO, IL-1β, TNF-α, PGE-2, and iNOS levels in RAW 264.7 cells relative to the negative control. Meanwhile, NPE treatments successfully declined those levels. NPE 75 µg/mL resulted in the highest decrease and was close to normal, indicating the most effective suppression activity (Figures 5 and 6). This indicates that NPE has anti-inflammatory properties.
Figure 5
Effect of NPE toward (A) IL-6, (B) TNFα, (C) NO, and (D) IL-1β in the inflammatory cells model. Negative Control (NC): normal cell; Positive Control (PC): LPS-induced RAW 264.7 cells; NPE25: Positive Control + 25 µg/mL NPE; NPE50: Positive Control + 50 µg/mL NPE; NPE75: Positive Control + 75 µg/mL NPE. *The result was shown as mean ± SD. Tukey’s HSD post hoc test and Mann-Whitney test (p < 0.05) are used to produce statistical differences. The various letters demonstrate a significant difference between a wide range of treatments toward the LPS-induced RAW 264.7 cells.
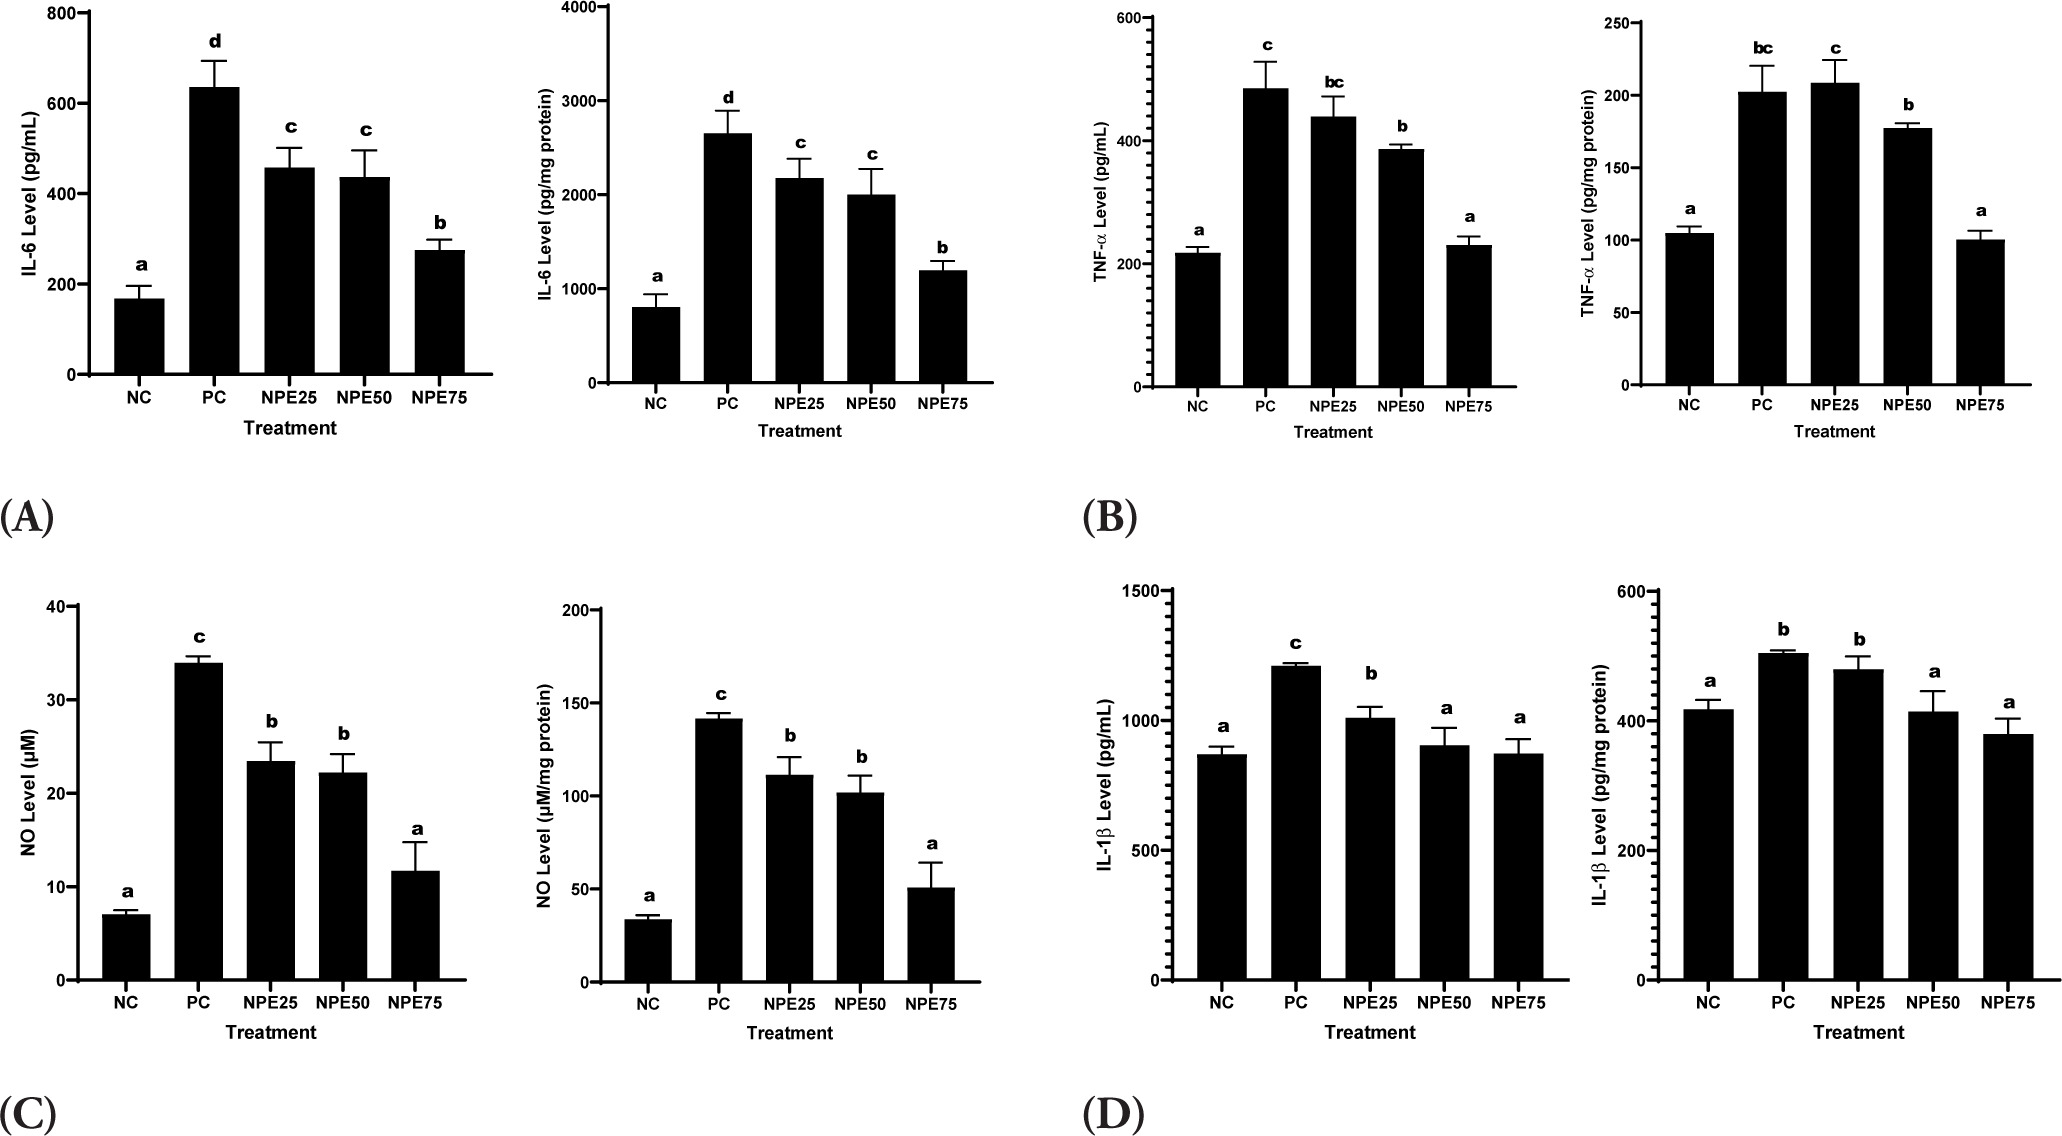
Figure 6
Effect of NPE toward (A) PGE-2, (B) iNOS, and (C) COX-2 in inflammatory cells model.Negative Control (NC): normal cell, Positive Control (PC): LPS-induced RAW 264.7 cells; NPE25: Positive Control + 25 µg/mL NPE; NPE50: Positive Control + 50 µg/mL NPE; NPE75: Positive Control + 75 µg/mL NPE. *The result was shown as mean ± SD. Tukey’s HSD post hoc test and Mann Whitney test (p<0,05) is used to produce statistical differences. The various letters demonstrate a significant difference between various treatments toward LPS-induced RAW 264.7 cells.
4. DISCUSSION
It was discovered that the peel of the rambutan, which is typically discarded, has extraordinarily high antioxidant activity (da Cunha et al., 2004; Widowati et al., 2015). According to the ESI-MS analysis, NPE has the following compounds: geraniin, catechin, ellagic acid, quercetin, coumaric acid, and hydroxycinnamic acid. Other studies also state that the main phenolic compounds in rambutan peel include ellagic acid, geraniin, quercetin, and hydroxycinnamic acid (Tsong et al., 2021). In the current study, NPE had low levels of phenol, saponin, flavonoids, steroid/triterpenoids, tannins, and terpenoids. Compared to the fruit’s seeds and pulp, the peel had a much greater total phenol concentration (Palanisamy et al., 2008; Sun et al., 2012). Fruits and vegetables may include phenolic chemicals that act as natural antioxidants. Fruit peel contains polyphenols and has antioxidant properties (Ma et al., 2017). The antioxidant properties of NPE are directly linked to its total phenolic content. The capacity of the extract to neutralize free radicals is mainly due to the presence of phenolic compounds (da Cunha et al., 2004). The NPE has a total phenolic content higher than that of α-tocopherol, vitamin C, green tea, and grape seed (Palanisamy et al., 2008). The result showed that NPE had the lowest free radicals compared to gallic acid, caffeic acid, and corilagin in accordance with the low activity in DPPH scavenging as well as ABTS and FRAP reductions. However, compared to the seed and pulp, NPE is reported to possess higher free radical scavenging ability at the harvest stage. Among the various rambutan types examined by Fidrianny et al. (2015), the NPE from Lebak Bulus rambutan was found to have the most potent DPPH radical scavenging activity. This suggests that the extract from this specific type of rambutan is the most effective at neutralizing free radicals (Fidrianny et al., 2015). The peel of the kiwi fruit is known to have greater antioxidant activity than its flesh and seeds. The ethyl acetate extract (LB2) of Lebak Bulus rambutan peels showed the highest FRAP capacity (43.72%) when tested using the FRAP method (Fidrianny et al., 2015). The above explanations imply that the level of phenol is in conformance with the antioxidant activity. As a result, the low phenol levels found may have been related to the low antioxidant activity of NPE. Numerous phenolic components, including quercetin, gallotannin, ellagitannin, and phenolic acid, have been linked to increased antioxidant activity in the peel. Furthermore, the peel contains trace amounts of vitamins, which also function as antioxidants (Verzelloni et al., 2007).
Various antioxidants are known to counteract and repair skin aging caused by ROS levels. A wide range of skincare formulations incorporates antioxidant-active ingredients, serving as supportive therapies for both intrinsic and extrinsic (photoinduced) skin aging. Research has consistently highlighted the promising roles of phenolic substances, vitamin C and E, along with coenzyme Q10, in mitigating and slowing down the photoaging process. NPE has been found to contain health-promoting compounds, including phenolics (Sekar, 2020).
The ratio of collagen synthesis to breakdown is also thrown off throughout the aging process. Collagen production decreases as collagenase increases. Free radicals have been shown to promote the production of MMPs, including collagenase and elastase, which cause collagen and elastin to break down repeatedly. The exact method by which wrinkles occur is still unknown. The two primary substances that make up skin, collagen and elastin, play a crucial function in preserving skin structure. The repeated breakdown of collagen, by collagenase and elastase, results in structural flaws in the dermis and wrinkle formation. Utami et al. (2018) reported that elastase and collagenase contribute to the breakdown, thereby affecting the turnover of these essential structural proteins. Elastin, a fibrous protein comprising approximately 2-4% of ECM, is essential for maintaining skin hydration (Widowati et al., 2016a). Inhibiting elastase activity may help slow the aging process and preserve skin elasticity. The proteolytic enzymes elastase and hyaluronidase, found in the dermis, break down elastin and hyaluronan in the ECM (Thring et al., 2009; Tu & Tawata, 2015). The enzyme hyaluronidase breaks down HA, a polysaccharide with a megadalton acid structure that is exclusive to the ECM. Hyaluronidase inhibitors are crucial regulators in maintaining HA homeostasis. They also have potential uses as antibacterial, anti-inflammatory, antiaging, anticancer, antitoxin, and contraceptive medicines (Torgbo et al., 2022). This study revealed the antiaging activity of NPE through its strong inhibition against hyaluronidase and elastase. However, it had the least inhibition against collagenase compared to gallic acid, caffeic acid, and corilagin (Table 3). Phytochemical analyses in this study might explain the high antiaging activities. A previous study showed a high content of tannin, which is known to prohibit elastase and hyaluronidase exemption from aroused neutrophils in vitro (Fidrianny et al., 2015). Mahendran et al. reported that the methanolic extract of rambutan peels possesses strong antioxidant and antiaging properties, notably demonstrating substantial inhibition of tyrosinase activity. They created an antiaging cream and tested its effectiveness. The findings showed that the formulation of NPE was safe for topical application and had great potential for usage in cosmetic goods.
The extract must be cytocompatible before using it in biological tissue. A viability experiment was performed to ensure that NPE had no adverse effects on the RAW 264.7 cells (Figure 4), and at concentrations of 50 and 75 µg/mL, it was found to be safe for cell growth. According to a previous study, a 0.1 mg/mL concentration of the extract can be applied to living tissue without endangering the cells. This is consistent with earlier research that found rambutan extract to be safe for human dermal fibroblasts (HDFs) (Torgbo et al., 2022).
Upon proinflammatory stimulation with LPS, RAW 264.7 exhibited increased production of inflammatory cytokines, including Interleukin-6, NO, TNF-α, iNOS, COX-2, PGE-2, and Interleukin-1β. Based on the inflammation model employed in this study, the levels of inflammatory cytokines (Interleukin-6, TNF-α, NO, Interleukin-1β, iNOS, COX-2, and PGE-2) rose considerably compared to the untreated control (Figures 5 and 6). TLR4 (Toll-like receptor 4), which is triggered by the MAPK (JNK, ERK1/2, and p38) pathway, activates macrophages and causes them to create proinflammatory mediators. The cytoplasmic cascade events triggered by the TLR4 activation activate the MAPK (JNK, ERK1/2, and p38) pathway. The inhibitory factor-kappa B (IkB) is phosphorylated as a result of MAPK phosphorylation, and the nuclear factor-kappa B (NF-κB) is subsequently moved to the nucleus and activated. NF-κB is a ubiquitous transcription factor that plays a crucial role in regulating a wide range of cellular processes. It controls genes involved in apoptosis (programmed cell death), various immunological responses, and the cell cycle. The nuclear factor, important cytokine TNF-α, associated with the inflammatory response, activates NF-κB, an inducer of adhesion molecules and cytokines. TNF-α is therefore a major target in the screening of anti-inflammatory medications. When anti-inflammatory drugs are present, TNF-α, which exists in cascades, is stopped. Interleukin-1, TNF-α, and Interleukin-6 are examples of endogenous pyrogens that generate fever during inflammation as a result of upregulated inflammatory responses that eventually lead to the creation of acute-phase reactants (Laksmitawati et al., 2017). There have been numerous studies linking a dysregulation of TNF production to human disorders such as cancer, major depression, Alzheimer’s disease, inflammatory bowel disease (IBD), and psoriasis. Due to the extensive role of TNF-α in inflammatory processes, evaluating its inhibition is a key parameter in the development and assessment of anti-inflammatory therapeutics. Considering that this cytokine is a key modulator of inflammation, it is a potential screening agent (Widowati et al., 2019).
COX-2, a cyclooxygenase isoenzyme activated by mitogens, endotoxins, and proinflammatory cytokines, generates prostaglandins, which function as lipid signaling molecules. Prostaglandin E2 (PGE-2) is involved in promoting synovial inflammation through increased regional blood circulation and by intensifying the biological actions of interleukin-1 (IL-1) and bradykinin. NO, a reactive free radical compound, serves a critical function in regulating inflammatory responses and influences a variety of both normal and abnormal physiological processes. The enzyme iNOS utilizes the amino acid L-arginine to synthesize NO. Nonetheless, excessive production of NO during inflammation can cause tissue injury by suppressing immune cell function (Saanin et al., 2020).
PGE-2 is the most common prostaglandin produced by the body, and COX-2 are primarily responsible for controlling inflammation. In the context of inflammation, bacterial-derived cytokines and metabolites upregulate the expression of mPGES-1 and COX-2, which raises the synthesis of PGE2 in tissue cells and macrophages. PGE-2 is a key indicator of the inflammatory process, which manifests as classic signs such as pain, swelling, and redness. Research has shown that PGE-2 and its corresponding receptors not only influence the inflammatory response but also contribute to the development of atherosclerosis (Widowati et al., 2019).
IL-1β is a key mediator in the initiation and amplification of inflammatory responses during microbial infections, primarily through the induction of downstream cytokines, including IL-6 and IL-8. A wide range of immune cell functions is influenced by IL-6, driving the acute inflammatory response. People with rheumatoid arthritis, psoriasis, and encephalomyelitis have been reported to have higher levels of IL-6. Therefore, preventing the production of IL-1β might indirectly help treat autoimmune diseases and inflammation (Widowati et al., 2019).
The potential of NPE was demonstrated in LPS-induced RAW 264.7 cells, showing responses comparable to normal cells, as indicated by its inhibitory effects on inflammatory markers such as IL-6, COX-2, TNF-α, IL-1β, iNOS, NO, and PGE-2. This suggests that the chemical composition of NPE contributes to its anti-inflammatory effects. The ESI-MS analysis of NPE showed six chemical constituents: geraniin, catechin, quercetin, and ellagic, coumaric, and hydroxycinnamic acids. These compounds together may have anti-inflammatory properties (Li et al., 2018, 2019).
The antioxidant properties of NPE are crucial to its anti-inflammatory activity. Oxidative stress is known to activate intracellular signaling pathways, particularly those involving NF-κB, a central transcription factor within the nucleus. Activated NF-κB translocates to the nucleus, where it binds to the promoter regions of its target genes. This process, often initiated by heightened oxidative stress, leads to an increase in the production of various proinflammatory cytokines and mediators, including TNF-α, COX-2, and IL-1β. However, research has shown that NPE can inhibit both NF-κB and JNK/ERK MAPK signaling pathways, suggesting that it can counteract this inflammatory response, thereby offering protection to LPS-challenged RAW 264.7 macrophage cells. Additionally, under oxidative stress conditions, the activation of MAPK-regulated intracellular pathways contributes to enhanced ROS generation and release of proinflammatory agents. The action of NPE is believed to involve dual antioxidant and anti-inflammatory mechanisms. Thus, NPE holds potential as a key modulator of oxidative and inflammatory signaling (Widowati et al., 2021).
Phenolic compounds reduce inflammation mainly by suppressing the production of proinflammatory mediators. Earlier research has consistently demonstrated their therapeutic potential in inflammation control. Geraniin effectively decreased inflammation by inhibiting iNOS expression and lowering NO production (Li et al., 2018). Furthermore, Corbett et al. discovered that ellagic acid may be helpful in the treatment of inflammation. According to the findings of this study, the primary phenolic compounds—geraniin, catechin, ellagic acid, quercetin, coumaric acid, and hydroxycinnamic acid—work synergistically to mediate the anti-inflammatory properties of NPE.
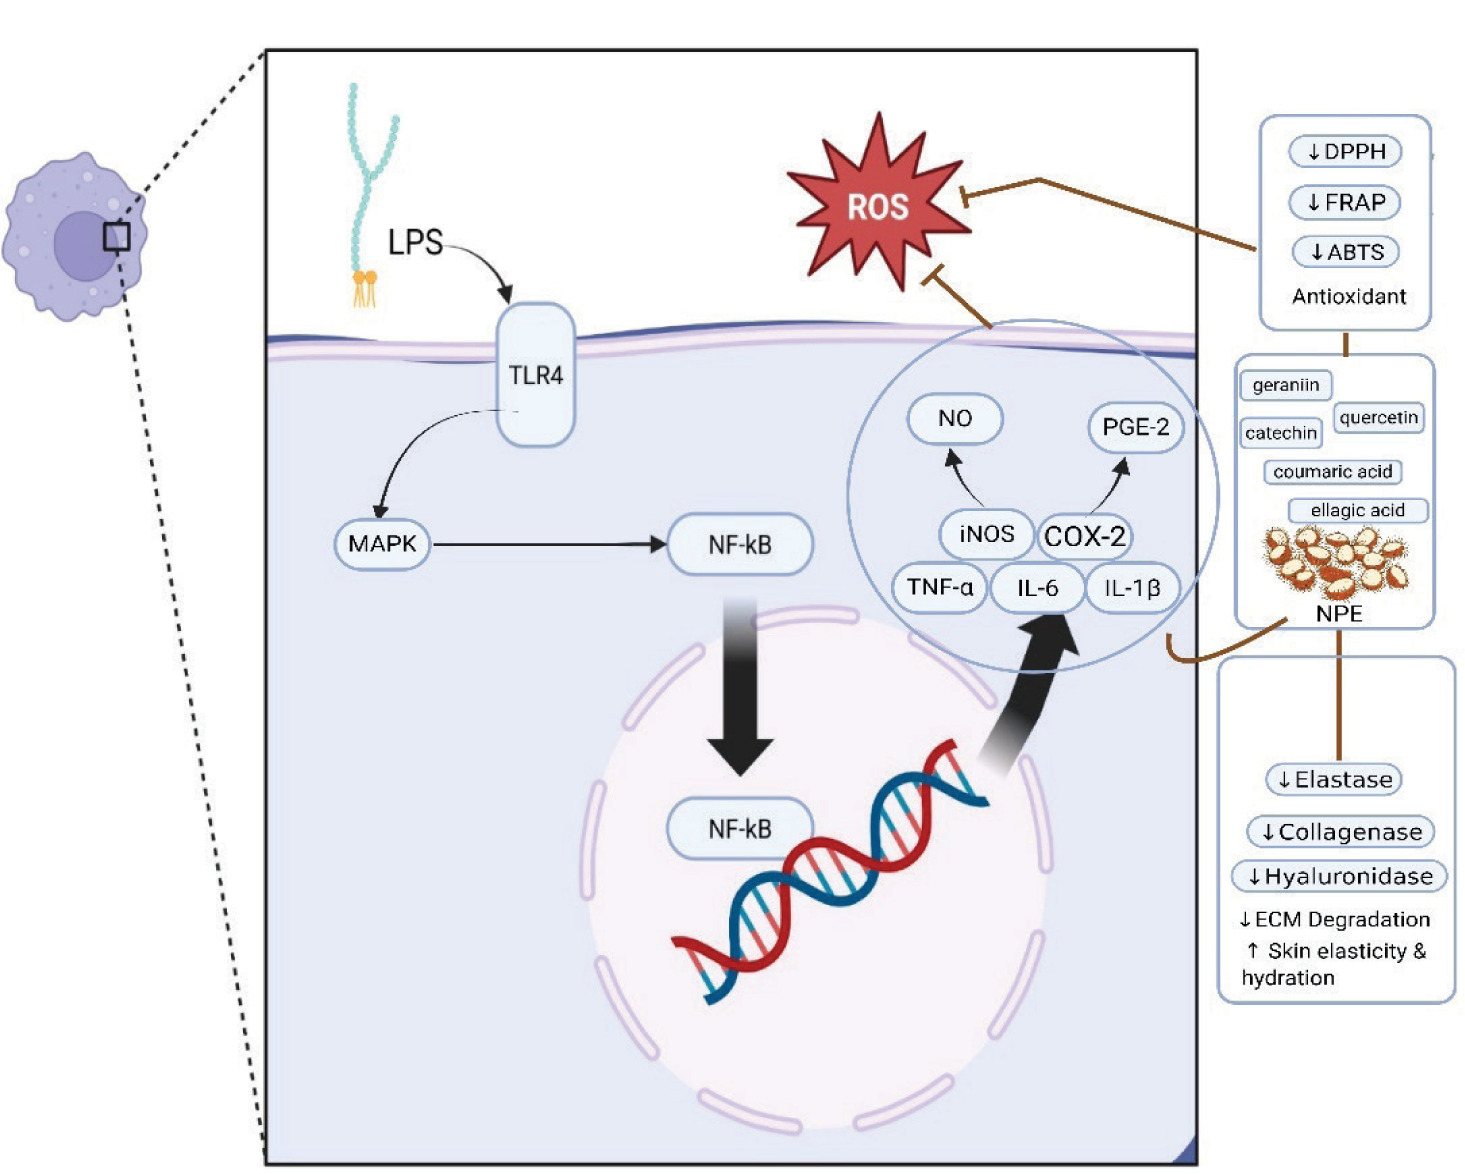
Figure 7 depicts the inflammatory cascade on LPS-stimulated RAW 264.7 macrophage cells, starting with TLR4 activation at the cell membrane. This triggers the MAPK signaling cascade in the cytoplasm, which then causes NF-κB activation in the nucleus (Figure 7). Activation of NF-κB subsequently promotes the increased expression of proinflammatory genes such as TNF-α, iNOS, IL-6, COX-2, and IL-1β. These genes then create NO and PGE-2. The rambutan peel extract, which is rich in bioactive substances such as geraniin, catechin, quercetin, ellagic acid, coumaric acid, and hydroxycinnamic acid, has potent anti-inflammatory and antioxidant qualities outside of the cells. Its antioxidant effect is reflected in reduced DPPH, ABTS, and FRAP activities, leading to decreased ROS and suppression of inflammatory signaling pathways. NO, TNF-α, IL-1β, PGE-2, iNOS, COX-2, and IL-6 are also downregulated by NPE. Furthermore, it prevents the breakdown of ECM while enhancing skin moisture and elasticity by inhibiting matrix-degrading enzymes such as collagenase, elastase, and hyaluronidase. Altogether, NPE contributes to cellular protection and provides comprehensive antiaging effects.
5. CONCLUSION
According to DPPH, ABTS scavenging, and FRAP activities, rambutan peel extract and its constituents gallic acid, caffeic acid, and corilagin have antioxidant properties. The antiaging activities of rambutan peel extract function by inhibiting collagenase, elastase, and hyaluronidase. In LPS-stimulated RAW 264.7 cells, rambutan peel extract reduces inflammation by downregulating the synthesis of critical proinflammatory mediators (IL-1β, COX-2, TNF-α, NO, iNOS, PGE-2, and IL-6) in an established inflammation model. The phenolic substances geraniin, catechin, ellagic acid, quercetin, coumaric acid, and hydroxycinnamic acid are most likely responsible for this. These findings imply that rambutan peel extract may find application as a component in medicinal products.
AUTHOR CONTRIBUTIONS
Diana Krisanti Jasaputra: Research concept and design, Collection and/or assembly of data, analysis, and interpretation, Writing, critical revision, and final approval of the article; Young Ho Kim: Collection and/or assembly of data, analysis, and interpretation, Writing, critical revision, and final approval of the article; Teresa Liliana Wargasetia: Data analysis and interpretation, Writing, critical revision, and final approval of the article; Wahyu Widowati and Heddy Herdiman: Writing, critical revision, and final approval of the article; Agnia Nursyifa Fitria Romdhon and Anindita Putri Distya: Writing and final approval of the article.
ACKNOWLEDGMENT
Acknowledgment is extended to the World Class Professor (WCP) Program in Indonesia, organized by the Ministry of Higher Education, Science, and Technology through the Directorate General of Higher Education, in collaboration with various universities both domestically and internationally