

1. INTRODUCTION
Cancer is one of the leading causes of morbidity and mortality all over the world. According to GLOBOCAN 2022 (an online database providing current, comprehensive cancer incidence), there were 19.96 million new patients and 9.74 million deaths globally, and this number is projected to rise to 35 million new patients annually by 2050 (Bray et al., 2024; World Health Organization (WHO), 2024). In India, cancer accounted for 1.41 million new patients and 916,827 deaths in 2022, reflecting the country’s growing cancer burden. The most common cancers were breast (13.6%), lip and oral cavity (10.2%), cervix uteri (9%), and lung (5.8%). Projections suggest that India would have more than 2.1 million new patients every year by 2040, further intensifying the strain on healthcare systems if effective strategies are not implemented (International Agency for Research on Cancer [IARC], 2022).
Access to recently developed cancer drugs remains highly restricted in many low- and middle-income countries (LMICs). Of the 568 cancer drugs introduced between 1990 and 2022, around 35% never became available outside the single country where they were first approved, and fewer than 30% reached >10 countries. Most nations waited 1½–3 years after the initial launch prior to gaining access, with the longest delays occurring in LMICs. As a result, high-income regions secured earlier and broader availability, widening the existing treatment inequalities (Li et al., 2024).
Even when new cancer drugs reach LMICs, they often create a heavy financial burden on patients and their families. Cancer care largely remains out of reach, so households frequently borrow, sell assets, or stop treatment, leading to delays and poorer outcomes (Mohanty et al., 2024).
These challenges highlight the urgent need for cost-effective and accessible therapeutic approaches to reduce both clinical and economic burden of cancer. In this context, herbal medicines rooted in traditional systems have gained global attention. Emerging clinical evidence suggests that adjunctive use of herbal medicines can improve quality of life and enhance survival in cancer patients, with acceptable cost-effective profiles in certain healthcare systems (Tang et al., 2024).
Natural sources have been fundamental to the discovery of anticancer agents. Analyses of the US Food and Drug Administration (FDA) approvals from 1981 to 2019 show that nearly two-thirds of small-molecule anticancer drugs originated from natural products, their derivatives, or synthetic compounds modelled on natural structures (Newman & Cragg, 2020). Several widely used chemotherapeutic agents are vincristine and vinblastine from Catharanthus roseus and paclitaxel from Taxus brevifolia (Cragg & Pezzuto, 2016; Cragg et al., 2012). These landmark discoveries highlight the structural diversity and therapeutic potential of natural products in oncology.
Beyond single molecules, polyherbal formulations offer distinct advantages by combining multiple botanicals that act on diverse molecular targets, producing synergistic effects, improving bioavailability, and reducing toxicity (Wagner & Ulrich-Merzenich, 2009). This principle forms the basis of traditional medical systems, such as Ayurveda, Siddha, and traditional Chinese medicine, where complex formulations are preferred over isolated constituents.
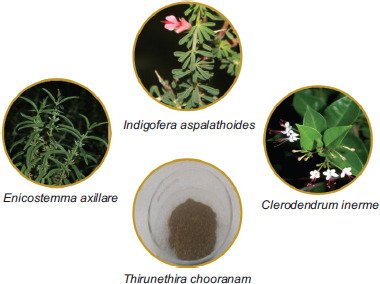
The Siddha medicine, one of the oldest medical systems of South India, is rooted in Tamil culture and history. Its foundation is attributed to the Siddhars, ancient Tamil sages, and its origins can be traced back to the Sangam period (200 BCE–200 CE) (Kanagarathinam & Lourdusamy, 2023; Subbarayappa, 1997). The Siddha medical system is known for its extensive use of polyherbal formulations, many of which are indicated for chronic and degenerative diseases, including conditions resembling cancer. Among them, Thirunethira Chooranam (TNC) is a classical formulation comprising vellarugu (Enicostemma axillare), shivanarvembu (Indigofera aspalathoides), and sangan kuppi (Clerodendrum inerme). Although these plants have been individually studied for their pharmacological potential, the combined efficacy of TNC has not been validated scientifically. The present study aims to evaluate the in vitro antioxidant and cytotoxic, and in vivo anticancer activities of TNC, thereby bridging the Siddha medicine with modern pharmacological evidence.
2. MATERIALS AND METHODS
2.1. Preparation of test drug
Thirunethira Chooranam was prepared in accordance with classical Siddha literature (Agasthiyar Vaithiya Vallathi – 600). Raw materials for TNC were purchased from a licensed vendor in Chennai and authenticated by a botanist. After cleaning, shade-drying, and purification as per Siddha texts, the ingredients were pulverized, mixed in equal proportions, sieved to a fine powder, and stored in airtight containers. The ingredients used in the preparation of TNC are listed in Table 1 and the final products with ingredients are depicted in Figure 1.
2.2. In Vitro evaluation of antioxidant potential and cytotoxic effects
2.2.1. In vitro antioxidant activity evaluation using 2,2-diphenyl-1-picrylhydrazyl (DPPH) radical scavenging assay
The antioxidant activity of TNC was determined by the DPPH radical scavenging assay with slight modifications (Koleva et al., 2002). The DPPH solution was freshly prepared in methanol at a strength of 0.2 mM. Various concentrations of TNC extract (0.5, 1, 2, 4, 8, and 16 mg/mL) were prepared in methanol, and 1 mL of each sample solution was mixed with 5 mL of DPPH reagent. The solution was vortexed and incubated at room temperature for 30 minutes in darkness. Methanol was used as a blank, while ascorbic acid (10, 20, 30, 40, 50, and 60 µg/mL) served as a positive control. After incubation, the reaction mixture was measured at 517-nm wavelength using a UV-visible spectrophotometer. The proportion of DPPH radical scavenging was evaluated using the following equation:
where A0 is the absorbance of the control, and A1 is the absorbance of the test sample.
All experiments were conducted in triplicate, and the results were expressed as mean values. The half-maximal inhibitory concentration (IC50) values for both TNC and ascorbic acid were also documented.
2.2.2. In vitro cytotoxicity evaluation using 3-(4,5-dimethylthiazol-2-yl)-2,5-diphenyl tetrazolium bromide (MTT) assay
By using Dulbecco’s modified eagle medium (DMEM) having 10% fetal bovine serum (FBS), the cell counts of lung adenocarcinoma epithelial cell line (A549), estrogen-responsive breast cancer cell line (MCF-7), human cervical cancer cell line (HeLa), hepatocellular carcinoma cell line (HEP-G2), and African green monkey kidney (Vero) cell line were adjusted to 1.0 × 10⁵ cells/mL. Approximately 100 µL of diluted cell suspension was added to each well of a 96-well microtiter plate. After 24 hours, cells were centrifuged, and pellets were resuspended with 100 µL of test sample concentrations (31.25–250 µg/mL). Plates were incubated at 37°C for 48 hours in a 5% CO2 atmosphere, with microscopic examination at 24-hour intervals. After 48 hours, solutions were centrifuged, and pellets were resuspended with 20 µL of MTT (2 mg/mL) in phenol red-free medium (MEM-PR). Further, the plates were incubated in a 5% CO2 atmosphere for 2 hours at 37°C. To the plates 100 µL of dimethyl sulfoxide (DMSO) was added slowly and mixed gently to solubilize the formed formazan. Absorbance was read at 540 nm with a microplate reader (Mosmann, 1983). The proportion of cell viability was calculated using the following formula, and the concentration of test samples required to inhibit cell growth by 50% (IC50) was derived from dose–response curves:
2.3. In vivo anticancer evaluation using Dalton’s lymphoma ascites (DLA) cells
2.3.1. Induction of cancer using DLA cells
The DLA model was employed to assess anticancer activity, as widely reported in earlier studies (Thavamani et al., 2014). DLA cells were obtained from Amala Cancer Research Center, Kerala, India. The DLA cells were maintained in Swiss albino mice (in vivo) through intraperitoneal (i.p.) transplantation. The DLA cells were aspirated from the peritoneal cavity of previously inoculated mice with saline solution to induce tumor. The cell count was adjusted to 1 × 10⁶ cells/mL, and the diluted suspension was injected intraperitoneally. Tumor development was allowed for 7 days prior to the initiation of treatment.
2.3.2. Animals
A total of 24 male Swiss albino mice were placed in micro nylon boxes, maintained at a temperature of 25 ± 2°C and a 12-hour light–dark cycle. The mice were quarantined for 15 days prior to commencing the experiment. A healthy, standard laboratory diet was provided with water ad libitum. The animal house was maintained in a hygienic environment. The study was approved by the Institutional Animal Ethical Committee (IAEC approval No. IAEC/MEENASHREE BALAKRISHNAN/Ph.D/KMCP/92/2020).
The animals were divided into four groups (n = 6 per group):
Group 1 (G1, normal control): received only a standard diet and water ad libitum without any intervention.
Group 2 (G2, cancer control): injected intraperitoneally with DLA cells and left untreated to monitor progression of tumor.
Group 3 (G3, positive control): treated with 5-fluorouracil (20 mg/kg, i.p.), a standard chemotherapeutic agent.
Group 4 (G4, Siddha treatment l): administered TNC (100 mg/kg, by mouth/orally [p.o.]).
Treatment of tumor continued for 14 consecutive days, starting 24 hours after inoculation of tumor.
2.3.3. Hematological and biochemical analyses
At the end of the study period, the Swiss albino mice from all groups were euthanized, and blood samples were collected through retro-orbital plexus puncture for further examination. Hematological indices, such as hemoglobin (Hb) concentration, red blood cell (RBC) count, total white blood cell (WBC) count, packed cell volume, and platelet count, were quantified using a COBAS MICROS OT 18 cell analyzer (Roche Diagnostics, Basel, Switzerland). Serum was separated by centrifugation and subjected to biochemical and lipid profile assessment. Other significant parameters, such as alanine aminotransferase (ALT), total cholesterol (TC), aspartate aminotransferase (AST), triglycerides (TG), and alkaline phosphatase (ALP), were measured.
2.3.4. Life span measurement
In order to evaluate the efficacy of Siddha formulations in prolonging survival, the percentage ILS (%ILS) was determined. The average life span of animals was recorded for each group, and the %ILS was calculated for treatment groups, compared to the cancer control group:
2.3.5. Body weight measurement
All mice were weighed at the start of the study and monitored at regular intervals until day 15. The final body weight of each group was recorded, and the average increase or decrease in body weight was determined to assess progression of tumor and response to treatment.
2.3.6. Cancer cell count
To assess tumor burden, 100 µL of peritoneal fluid was collected from each animal using a sterile syringe. The collected sample was diluted with 0.8 mL of sterile phosphate buffer solution (PBS) to ensure proper cell dispersion. For viability assessment, 0.1 mL of trypan blue (0.1 mg/mL) was added to the sample. With the help of a hemocytometer, the number of viable cells was counted using the microscope:
2.3.7. Histopathology procedure
The excised kidney and liver tissue samples were fixed in 10% neutral buffered formalin to preserve cellular morphology and structural integrity. Following fixation, the tissues were dehydrated through a graded ethanol series to remove water content, and subsequently cleared with a suitable clearing agent to enhance paraffin infiltration. The tissues were embedded in paraffin blocks by wax impregnation, which facilitated thin sectioning. With the help of a rotary microtome, thin sections of 5-µm thickness were cut and stained using hematoxylin and eosin (H&E) for microscopic examination.
3. RESULTS
3.1. Antioxidant Activity Using DPPH Radical Scavenging Assay
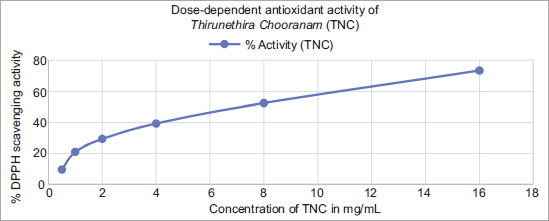
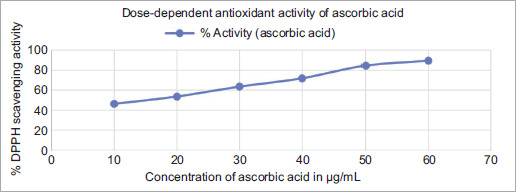
The antioxidant activity of TNC was determined using the DPPH assay, and the percentage inhibition values are recorded in Table 2. The antioxidant effect of TNC increased with higher concentrations (0.5, 1, 2, 4, 8, and 16 mg/mL). The lowest concentration (0.5 mg/mL) showed 9.67% inhibition, which increased to 73.55% inhibition at a concentration of 16 mg/mL. The IC50 value for TNC was 7 mg/mL. Ascorbic acid, which was used as a standard, also showed dose-dependent activity, ranging from 46.13% at 10 μg/mL to 89.64% at 60 μg/mL, with an IC50 value of 17.9 μg/mL. The dose–response curves for both TNC and ascorbic acid are shown in Figures 2 and 3, respectively.
Table 2
Percentage DPPH radical scavenging activity of Thirunethira Chooranam and ascorbic acid at different concentrations.
| Concentration of ascorbic acid (µg/mL) | % Activity (ascorbic acid) | Concentration of TNC (mg/mL) | % Activity (TNC) |
|---|---|---|---|
| 10 | 46.13 | 0.5 | 9.67 |
| 20 | 53.54 | 1 | 21.05 |
| 30 | 63.51 | 2 | 29.27 |
| 40 | 71.92 | 4 | 39.31 |
| 50 | 84.61 | 8 | 52.5 |
| 60 | 89.64 | 16 | 73.55 |
3.2. Cytotoxicity evaluation using MTT assay
The cytotoxic activity of TNC was assessed on MCF-7, A549, HEP-G2, HeLa, and Vero cell lines using the MTT assay. TNC exhibited the highest cytotoxic effect against MCF-7 cells (IC50 = 14.39 mg/mL), followed by A549 (IC50 = 26.70 mg/mL) and HEP-G2 (IC50 = 32.30 mg/mL). HeLa cells showed moderate sensitivity (IC50 = 86.08 mg/mL), whereas Vero cells demonstrated the least sensitivity (IC50 = 183.35 mg/mL). These IC50 values of TNC against the tested cell lines are given in Table 3. The results indicate that TNC possesses selective cytotoxic potential, particularly against breast (MCF-7) and lung (A549) cancer cell lines, while showing relatively lower toxicity on normal Vero cells.
3.3. Anticancer activity in DLA-induced tumor-bearing Swiss albino mice
3.3.1. Hematological parameters
The effect of TNC on hematological indices in tumor-induced mice is shown in Table 4. In the cancer control group (G2), a significant increase in total white blood corpuscles (WBC) count (13.52 ± 2.60 ×10³ cells/mL) and a reduction in red blood cell (RBC) count (2.28 ± 0.44 ×10⁶/mL), hemoglobin content (7.45 ± 0.92 g/dL), and platelet count (1.72 ± 0.62 lakhs/mm3) were observed, compared to the normal control (G1, p < 0.01). Treatment with TNC (G4) significantly restored these parameters to normal levels, compared with the positive control (G3), indicating a protective effect against tumor-induced hematological alterations.
Table 4
Effect of Thirunethira Chooranam on hematological parameters in DLA-induced tumor-bearing mice.
3.3.2. Biochemical parameters
The biochemical profile of experimental groups is shown in Table 5. The cancer control group (G2) exhibited elevated serum cholesterol (143.90 ± 4.68 mg/dL), triglycerides (224.38 ± 4.82 mg/dL), AST (85.40 ± 2.70 U/L), ALT (60.50 ± 2.70 U/L), and ALP (242.50 ± 4.45 U/L), compared to the normal control (G1, p < 0.01). Administration of TNC (G4) significantly reduced these elevated markers, with values comparable to the positive control (G3), thereby suggesting hepatoprotective and metabolic regulatory effects of TNC.
Table 5
Effect of Thirunethira Chooranam on biochemical parameters in DLA-induced tumor-bearing mice.
[i] Notes. TNC: Thirunethira Chooranam; i.p.: intraperitoneal; p.o.: by mouth/orally; TGL: triglycerides; AST: aspartate aminotransferase; ALT: alanine aminotransferase; ALP: alkaline phosphatase.
Values are mean ± standard error of mean (SEM) (n = 6). *Significantly different from normal control (G1) at p < 0.01. **Significantly different from cancer control (G2) at p < 0.01.
3.3.3. Life span and body weight
As shown in Table 6, the cancer control group (G2) demonstrated a reduced life span and a marked increase in body weight (7.80 ± 0.95 g) because of tumor progression. In contrast, TNC-treated mice (G4) exhibited a substantial improvement in survival (80% ILS) and a significant reduction in body weight (4.14 ± 0.80 g, p < 0.01 vs. G2). These findings were consistent with the effects of the positive control group (G3), which recorded the highest survival benefit (93% ILS).
3.3.4. Cancer cell count
Tumor burden, measured by peritoneal cancer cell count, was markedly elevated in the cancer control group (G2; 2.68 ± 0.42 × 10⁶/mL), compared to the normal control (G1). TNC-treated mice (G4; 1.77 ± 0.22 × 10⁶/mL) showed significantly reduced viable cancer cell numbers (p < 0.01), compared to cancer control group (G2), and the effect was comparable to that of the positive control group (G3; 1.43 ± 0.22 × 10⁶/mL). These findings are presented in Table 6 and it confirms the in vivo cytotoxic efficacy of TNC against tumor-induced cancer cells.
Table 6
Effect of Thirunethira Chooranam on life span, body weight, and cancer cell count in DLA-induced tumor-bearing mice.
3.3.5. Histopathology
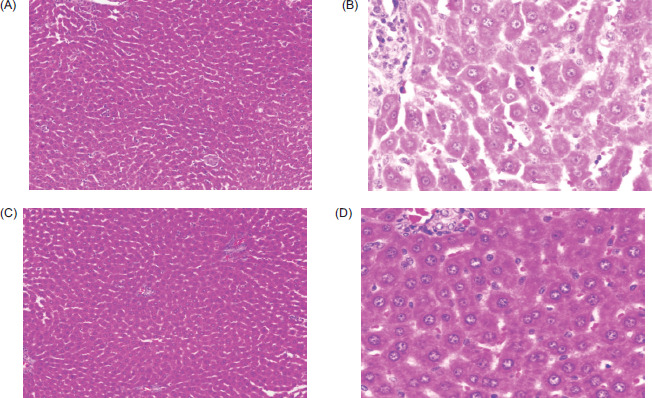
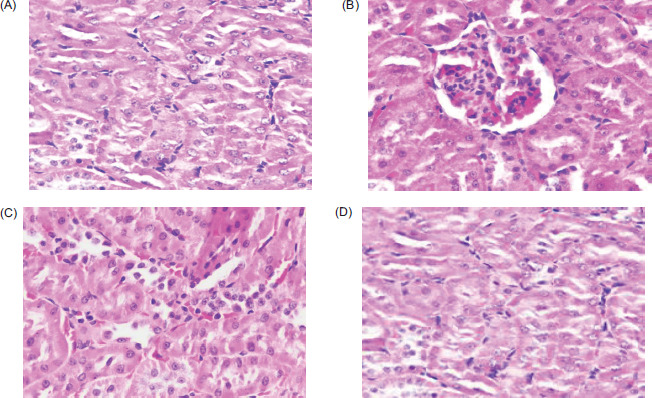
Histopathological examination of liver sections presented in Figure 4 revealed distinct changes among experimental groups. Normal control (G1) animals displayed preserved hepatic architecture with well-arranged hepatocytes and normal sinusoids. Cancer control (G2) animals exhibited severe pathological changes, including hepatic congestion at sinusoids and portal vessels, diffused necrosis, and increased Kupffer cell proliferation and mononuclear infiltration, indicating significant liver damage. Positive control (G3) animals treated with fluorouracil showed partial restoration of hepatic tissue with only mild congestion at sinusoids and portal vessels, and no Kupffer cell proliferation and reduced necrosis. Animals treated with TNC (G4) demonstrated moderate improvement, with reduced hepatocyte necrosis, less Kupffer cell proliferation, and an overall improvement in tissue architecture, compared to the tumor control group.
Figure 4
Histopathological sections of liver tissues in different experimental groups. (A) G1: normal control showing intact hepatocytes arranged in cords with normal sinusoids and central vein. (B) G2: cancer control exhibiting hepatic congestion, micro-steatosis, increased Kupffer cell proliferation, hepatocyte necrosis, and mononuclear infiltration. (C) G3: positive control (fluorouracil, 20 mg/kg, i.p.) showing mild hepatic congestion with reduced necrosis and minimal mononuclear infiltration. (D) G4: Thirunethira Chooranam-treated group (100 mg/kg, p.o.) showing moderate hepatic congestion with reduced pericenter globular microsteatosis, less Kupffer cell proliferation, and partial restoration of hepatic architecture.
Histopathological examination of kidney sections presented in Figure 5 revealed that normal control (G1) animals displayed preserved renal histoarchitecture with well-arranged glomeruli and proximal convoluted tubules. Cancer control (G2) animals exhibited severe renal damage, characterized by glomerular disruption, folding of Bowman’s capsules, necrotic changes, and degeneration of the renal parenchyma. Positive control (G3) animals treated with fluorouracil showed largely intact glomerular structures, accompanied by only mild inflammatory changes, indicating partial protection. Animals treated with TNC (G4) demonstrated moderate improvement, evidenced by mild glomerular inflammation, reduced tubular degeneration, and fewer necrotic changes, suggesting partial restoration of renal tissue architecture, compared to the tumor control group.
Figure 5
Histopathological sections of kidney tissue in different experimental groups. (A) G1: normal control showing intact glomeruli (GM) and proximal convoluted tubules with preserved renal architecture. (B) G2: cancer control exhibiting glomerular damage, folding of Bowman’s capsules, necrotic changes, and disrupted renal parenchyma. (C) G3: positive control (fluorouracil, 20 mg/kg, i.p.) showing intact glomeruli with only mild inflammatory changes. (D) G4: Thirunethira Chooranam-treated group (100 mg/kg, p.o.) showing mild glomerular inflammation with lymphocyte infiltration and minimal degenerative changes in the renal tubules, indicating partial restoration of renal structure.
4. DISCUSSION
The present study provides evidence for the antioxidant activity of TNC, a Siddha polyherbal formulation. The DPPH assay confirmed its free radical scavenging effect (IC50 = 7 mg/mL), supporting its potential to mitigate oxidative stress, a major contributor to deoxyribonucleic acid (DNA) damage and carcinogenesis. The activity can be attributed to its individual ingredients: Vellarugu exhibited potent antioxidant effects in 2,2′-Azino-bis 3-ethylbenzothiazoline-6-sulfonic acid (ABTS), deoxyribose, nitric oxide (NO), and lipid peroxidation assays (Vaijanathappa et al., 2008); vellarugu further demonstrated significant phenolic and flavonoid content with DPPH, ABTS, and ferric reducing antioxidant power (FRAP) activity (Sanmugarajah et al., 2018); shivanarvembu showed strong radical scavenging in DPPH, ABTS, hydroxyl radical, and NO assays (Philips et al., 2010), with indigocarpan further confirming activity in ABTS, DPPH, thiobarbituric acid reactive substances (TBARS), and reactive oxygen species (ROS) assays (Mahajan et al., 2016); and sangan kuppi exerted free radical scavenging, reducing power, and lipid peroxidation inhibition because of its phenolic and flavonoid constituents (Gurudeeban et al., 2010; Khan et al., 2013). These findings collectively corroborate the antioxidant efficacy of TNC.
Thirunethira Chooranam demonstrated selective cytotoxicity in vitro, with strongest effects against MCF-7 breast cancer cells, followed by A549 and HEP-G2, while sparing normal Vero cells. This suggests that its phytochemical constituents may preferentially target malignant pathways. The in vivo DLA model further reinforced these observations, as TNC treatment restored altered hematological indices, reduced viable tumor cell counts, prolonged survival, and protected hepatic and renal tissues.Each component of the formulation potentially contributes via distinct pathways. Vellaragu contains swertiamarin, lupeol, and other flavonoids and terpenoids, which are shown to modulate apoptosis and inhibit tumor growth. The ethanolic extract suppressed 7,12-dimethylbenz[a]anthracene (DMBA)-induced tumor formation and restored antioxidant enzyme levels in vivo, indicating chemopreventive action via reduction of oxidative stress and lipid peroxidation (Rajasekaran et al., 2015). The isolated swertiamarin from vellaragu exhibits anticancer activity in vitro by inducing apoptosis and cell cycle arrest, possibly via ROS generation and mitochondrial pathway modulation (Muhamad Fadzil et al., 2021). In addition, methanolic extract of vellaragu has immunomodulatory effects, enhancing both humoral and cellular immune functions while reducing pro-inflammatory cytokines (Saravanan et al., 2012).
Shivanarvembu has documented anti-tumor effects in animal models, as using its aqueous extract reduced fibrosarcoma progression induced by 20-MCA in rats (Sivagnanam et al., 2012). The ethanol extract demonstrated significant antitumor activity in vivo against Ehrlich ascites carcinoma in mice. It also exhibited cytotoxicity in vitro, supporting its role in cancer inhibition (Rajkapoor et al., 2004). Sangan kuppi contributes by inhibiting cancer cell motility, invasion, and adhesion by using the methanolic leaf extract, which suppressed migration, invasion, and adhesion of A549 lung cancer cells at sub-cytotoxic doses (Tayeh et al., 2020).
The combined evidence indicates that TNC’s anticancer effects are potentially mediated through multiple, complementary mechanisms, including ROS-mediated mitochondrial apoptosis, antioxidant defense, and immunomodulation. Such polyherbal synergy is consistent with the Siddha principle of balancing cytotoxicity with systemic protection. Future studies focusing on in vitro molecular pathway validation and clinical trials for specific cancer are necessary to strengthen its translational potential.
5. CONCLUSION
Thirunethira Chooranam demonstrated significant in vitro antioxidant and cytotoxic, and in vivo anticancer activities. These findings support its traditional use in the Siddha medicine and suggest its potential in cancer management. Further studies are needed to confirm its efficacy and safety through detailed molecular and clinical investigations.
AUTHOR CONTRIBUTIONS
Sudha Revathy Senthilkumar: research concept and design, collection and/or assembly of data, critical revision of the article, and final approval of the article; Meenashree Balakrishnan: collection and/or assembly of data; Kayalvizhi Duraisami: data analysis and interpretation, and writing of the article; and Deepa Natarajan: Research concept and design.
CONFLICT OF INTEREST
The authors declared no conflict of interest regarding the publication of this paper.