

1. INTRODUCTION
Since ancient times, herbal remedies have alleviated illness symptoms. Although modern medicine has made significant progress in recent years, it has led to antimicrobial resistance (AMR) due to its prolonged usage, resulting in drug resistance and adverse effects (Malcangi et al., 2025). Plant-based treatments continue to play a vital role in health management to date. The growing interest in medicinal plants’ roots and leaves is not only because of their historical use in traditional healing practices but also because of their preventive benefits, particularly in developing nations (Alfadil et al., 2024). Numerous medicinal plants are studied for their natural antioxidant potential. Natural antioxidants, whether derived from crude plant extracts or isolated bioactive compounds, play a crucial role in mitigating the harmful effects of oxidative stress. These antioxidants are highly effective against cellular damage caused by free radicals, supporting overall health (Rani et al., 2024).
Studies have shown that herbal medicinal plants contain antioxidants like flavonoids, phenols, terpenoids, tannins, alkaloids, sterols, and glycosides, which play a key role in disease prevention. Consumption of natural antioxidants has been linked to a reduced risk of illness and death associated with various diseases. Utilizing herbal remedies abundant in antioxidant components has been suggested as a beneficial treatment method for various ailments in traditional and modern medicine (Sharma et al., 2024).
Salacia reticulata (S. reticulata), a woody climbing shrub native to the Asian region, has garnered attention for its diverse medicinal applications. S. reticulata is a herb, traditionally used in Ayurvedic medicine to manage early stage diabetes. Previous studies have indicated its potential in antidiabetic, obesity, anti-inflammatory, antibacterial, antioxidant activities, and various metabolic disorders, as well as exhibited good results in its inhibitory effect on the differentiation of premature adipocytes, indicating good results (Chavan et al., 2024; Renan et al., 2024). However, to synthesize these extracts, toxic chemicals are required to release the medicament immediately, leading to rapid clearance and a low yield of drugs (Sivalingam et al., 2024).
The recent rise in nanotechnology-based applications has been widely recognized and appreciated, which has led to fascinating findings in the field of material research. Nanoparticles (NPs) exhibit unique physical and chemical characteristics, mainly due to their large surface-area-to-volume ratio, which enhances their reactivity, solubility, and interaction with biological systems compared to bulk materials. (Raju et al., 2022). There are various methods to synthesize NPs, which include physical, chemical, sonothermal, and hydrothermal methods, where hazardous chemicals are used (Rahman et al., 2022). However, biochemical approaches have drawbacks, such as biotoxicity, which can harm humans and the environment, while conventional methods require substantial resources (Nagesh et al., 2022).
Recent advances in nanoparticle synthesis have increasingly shifted toward more sustainable and environmentally friendly product development approaches. In contrast, recent biological methods offer more advantages, such as economical, large-scale production with reduced time consumption when compared to earlier production methods. Few studies have synthesized the NPs using natural resources like plants, bacteria, fungi, algae, etc., to avoid toxicity, and they constitute various secondary metabolites, adding advantages to the production of NPs from natural sources with excellent medicinal properties (Ahmed et al., 2024; Kirtane et al., 2021). In green nanotechnology, NPs are produced from various metals such as iron, zinc, silver, cerium, and gold, where toxic chemicals are not utilized. Biosynthesized NPs exhibit antibacterial, anti-inflammatory, antioxidant, antidiabetic, and anticancer properties (Singh et al., 2021).
Traditionally, silver has been recognized for its antimicrobial properties, and silver-based compounds remain more cost-effective than their gold counterparts. Moreover, silver NPs (AgNPs) are biocompatible with eukaryotic cells, including humans, while exhibiting strong toxicity against prokaryotic cells like bacteria, viruses, and fungi. AgNPs possess distinctive chemical, optical, electrical, magnetic, and mechanical characteristics, making them highly attractive for research in nanomedicine, including applications in antimicrobial therapy, anti-plasmodial activity, and targeted drug delivery (Younas et al., 2023).
This study introduces an innovative eco-friendly approach for the green synthesis of AgNPs using S. reticulata plant extract as a reducing and stabilizing agent, enabling the fast conversion of Ag+ ions to Ag0 within 2 minutes at room temperature (Sati et al., 2025). AgNPs generate ROS (e.g., superoxide and hydroxyl radicals), overwhelming bacterial antioxidant defenses and causing cellular damage. While membrane disruption occurs through destabilization of ROS and Ag+ ions, it ultimately enhances oxidative damage. Oxidative disruption occurs by binding to DNA/RNA nucleosides, disrupting their mechanisms (Yoshikawa & You, 2024).
The therapeutic potential of medicinal plants rich in antioxidants is increasingly recognized as an effective strategy for managing a variety of health conditions (Bai, C., Liu, J., Zhang, X., Li, Y., Qin, Q., Song, H., Yuan, C., & Huang, Zet al., 2024). This study quantitatively evaluated the total phenolic content (TPC) and total flavonoid content (TFC) of aqueous extracts from S. reticulata, while systematically assessing their in vitro antioxidant potential across multiple concentrations. In addition, the aqueous extract underwent comprehensive phytochemical analysis to identify bioactive compounds such as alkaloids, phenols, glycosides, flavonoids, saponins, terpenoids, and tannins. Findings of the study might provide valuable data for further research in determining a potential natural agent for treating oxidative stress–induced health complications.
2. MATERIALS AND METHODS
2.1. Materials
Silver nitrate was purchased from Durga Lab Pvt. Ltd., India. Mangiferin (M3547) and aluminum chloride (AlCl3) were procured from Sigma-Aldrich (St. Louis, MO, USA). Lead acetate, glacial acetic acid, ferric chloride (FeCl3), sulfuric acid (H2SO4), acetic anhydride, acetonitrile, and methanol were procured from Sigma-Aldrich.
2.2. Collection of plant materials
The leaves and roots of S. reticulata were collected from the Pilikula medicinal garden in Mangalore, Karnataka, India. The plant materials were authenticated and taxonomically recognized by the botanist. After the collection of roots and leaves, they were placed in a clean tray, and the plant materials were shade-dried until all the water molecules evaporated. After drying, the plant components were meticulously crushed into a fine powder using a mechanical stirrer. After passing through a 20-mesh screen, the materials were labeled appropriately and kept in airtight containers for later use (Laryea et al., 2024).
2.3. Preparation of extracts through the reflux condensation method
The reflux extraction method was employed to obtain the crude plant extract. A 1000 mL round-bottom flask containing 50 g of powdered leaves and roots of the S. reticulata plant was used separately, with each of 500 mL aqueous and methanol solvents. The extraction process was conducted for 8 hours at 80°C using a heating mantle. After extraction, the solvent was filtered into a beaker with a Buchner vacuum filter. After being evaporated to dryness, the percentage yield was calculated (Laryea et al., 2024).
2.4. Qualitative Phytoconstituents analysis
Standard phytochemical screening protocols were employed to analyze aqueous and methanolic extracts of S. reticulata leaves and roots for the presence of major bioactive constituents. The results were obtained through a series of established chemical test procedures, which have been summarized in Table 1.
Table 1
Qualitative phytochemical analysis of aqueous and methanolic extracts.
Phytochemical estimations (Bhusal et al., 2024; Gempo et al., 2024; Rayginia et al., 2024)
2.4.1. Test for Carbohydrates
Molisch test - This was performed by first adding three to four drops of Molisch’s reagent to 2 mL of plant extract, followed by thorough mixing. Subsequently, to create a distinct layer, concentrated sulfuric acid was gradually added along the test tube’s inner wall. The presence of carbohydrate molecules is indicated by the formation of a characteristic purple- or violet-colored ring at the interface of two layers.
2.4.2. Test for Protein
Biuret test - Two milliliters of Biuret reagent (10% NaOH + 0.5% CuSO4) was heated and added to the crude extract. The purple/violet coloration indicates the presence of protein.
Ninhydrin test - Two milliliters of the plant extract was mixed with 0.2% ninhydrin solution and gently heated for 5–10 minutes. The development of a blue color signified the presence of amino acids or protein constituents.
2.4.3. Test for Alkaloid
Mayer’s test - Two milliliters of each plant extract was treated with an equal volume of concentrated hydrochloric acid, followed by the addition of two drops of Mayer’s reagent. The indication of a white precipitate or green coloration indicated the presence of alkaloids in the sample.
2.4.4. Test for phenolic chemicals and tannins
Phenol FeCl3 test - For the detection of phenolic compounds, 1 mL of extract was reacted with 2 mL of 5% neutral FeCl3 solution. A positive reaction, characterized by dark blue pigmentation, confirmed the presence of both simple phenolics and tannin derivatives.
Gelatine test - A 0.1 g sample portion was boiled with 10 mL of distilled water for a few minutes. After filtration, 2 mL of 1% gelatin solution containing sodium chloride was added to the filtrate. The appearance of a white precipitate signified the presence of phenolic compounds and tannins.
2.4.5. Test for saponins
Foam test - The plant extract was immersed in 20 mL of distilled water and gently boiled for 2–3 minutes to ensure complete extraction. The mixture was then left to cool to room temperature, and the solution was vigorously agitated to mix well. Persistent foam-like formation lasting 10–15 minutes confirmed the presence of saponins in the solution.
2.4.6. Test for Glycosides
Liebermann’s Glycoside test - The crude extract was mixed with 2 mL of chloroform and 2 mL of acetic acid. The liquid was subsequently chilled with an ice bath, after which concentrated H2SO4 was meticulously added. A notable color transition from blue to green indicated the presence of glycosides.
Keller–Kiliani test - Two milliliters of acetic acid was added to the crude extract, followed by the addition of a few drops of 2% FeCl3 solution. The resulting mixture was gently layered over 2 mL of concentrated H2SO4)in a test tube. The formation of a distinct brown ring at the interface depicted the presence of glycosides (22).
2.4.7. Test for Steroids
H2SO4 acid test - Two milliliters of chloroform was added to the plant extracts. Concentrated H2SO4 (2 mL) was carefully introduced along the inner wall of the test tube. The red color was formed in the lower chloroform layer and was observed, confirming the presence of target compounds.
Salkowski’s test - After combining the crude extract with 2 mL of chloroform, concentrated H2SO4 was added, and the mixture was agitated gently. The formation of a reddish-brown coloration confirmed the presence of glycosides.
2.4.8. Test for Terpenoids
H2SO4 acid test - The crude plant extract was dispersed in 3 mL of chloroform and evaporated to dry it. Concentrated H2SO4 (2 mL) was then added to the residue and left to heat for 3 minutes. The development of a grayish coloration confirmed the existence of terpenoids.
2.4.9. Test for flavonoids
2.5.9.1. Shinoda’s test - Ten milliliters of dilute hydrochloric acid and a small strip of magnesium were introduced into 1 mL of the extract, resulting in a vivid pink coloration that confirmed the presence of flavonoids.
2.4.10. Test for Anthraquinones
Borntrager’s test - Boil the powdered sample with dilute H2SO4, cool it, and extract with benzene or chloroform. After removing the organic layer, add the same amount of ammonia solution. Free anthraquinones are present when the ammoniacal layer becomes pink to scarlet.
Quantitative determination of the chemical constituents (Godlewska et al., 2022; Johnson et al., 2024; Kim et al., 2024)
All the extracts were subjected to the quantitative estimation of total phenol and total flavonoids in order to select the active extract with maximum constituents to use for the preparation of AgNPs.
Estimation of Total Phenol Content (TPC) - The Folin–Ciocalteu reagent method was used to determine the plant extract’s TPC. Ten milliliters of 80% methanol were used to extract 1 gr of the material. After homogenizing the mixture, it was centrifuged for 30 minutes at 8,000 rpm. To get a final concentration of 1 mg/mL, the resultant product was gathered, dried by evaporation, and then reconstituted in methanol. Two-and-half milliliters of 7.5% sodium bicarbonate (NaHCO3), 2.5 mL of 10% Folin–Ciocalteu reagent (diluted in water), and 0.5 mL of methanolic extract were mixed for the test. While maintaining constant reagent quantities, methanol was used in place of the extract to create a blank sample.
A standard curve was created utilizing gallic acid, with a series of dilutions prepared in 80% methanol at concentrations of 20, 40, 60, 80, and 100 µg/mL. For each standard, 1 mL of the gallic acid solution was combined with 10 mL of distilled water, followed by the addition of 2.5 mL of 10% Folin–Ciocalteu reagent and 2.5 mL of 7.5% NaHCO3. The samples and standards were incubated at room temperature for a duration of 30 minutes. The absorbance measurement was conducted with a Shimadzu UV-1800 UV/VIS spectrophotometer at a wavelength of 765 nm. The phenolic content was determined through the standard curve and expressed as milligrams of gallic acid equivalents (GAE) per gram of extract, ensuring precise quantification of the phenolic constituents. The following formula was used to calculate the TPC (Table 2).
Table 2
Estimation of total phenolic and total flavonoid content in methanol and aqueous extract.
Total Phenolic Content = GAE × V × D/m
V = Extract volume (mL); D = Dilution factor; m = Weight of the pure plant extract (g); and GAE = Gallic Acid Equivalent (mg/mL).
Estimation of the total flavonoid content - The total flavonoid content was quantified utilizing an AlCl3 colorimetric technique. One milliliter of methanolic plant extract (1 mg/mL) was combined with an equivalent volume of 2% AlCl3 solution produced in methanol. The reaction mixture was maintained at room temperature (25 ± 2°C) and incubated for 60 minutes. After incubation, absorbance was measured at 415 nm with a UV–Vis spectrophotometer. A calibration curve was established utilizing quercetin standards at doses ranging from 10 to 100 μg/mL. The concentration of flavonoids in the samples was evaluated by comparing their absorbance values to the standard curve, with results given as quercetin equivalents (QE) per milliliter. The total flavonoid content in the extracts was determined and expressed as QE, measured in milligrams of quercetin per gram of extract (mg QE/g extract).
Flavonoid content (mg QE/g) = (C × V × D) / M
Where:
C = QE concentration (μg/mL) from standard curve
V = Total volume of extract solution (mL)
D = Dilution factor (if applicable)
M = Mass of crude extract sample (g)
2.5. HPLC analysis
The mangiferin content in various Salacia species was quantified using high-performance liquid chromatography (HPLC) on a Shimadzu LC-10AT system. The HPLC system was integrated with a PDA detector (SPDM10A), a fluorescence detector (RF-20A), and a column oven (CTO-10AS) to ensure precise analysis. A C-18 column (250 mm × 4.6 mm ID, 5 μm) was employed for chromatographic separation. The mobile phase consisted of a binary gradient of 15% acetonitrile and 85% 0.1% orthophosphoric acid, delivered at a flow rate of 1 mL/min. The separation was carried out at ambient temperature.
A calibration curve for mangiferin was established by injecting standard solutions prepared in methanol at concentrations of 100, 200, 400, and 800 μM. Detection was performed at a wavelength of 257 nm. Sample injections were made using a 10μL injection loop with a 25μL Hamilton microsyringe. Each analysis run was allotted a duration of 10 minutes, and the HPLC system was stabilized for 30 minutes prior to injections. Data acquisition and signal processing were carried out using Shimadzu LC Solutions software, ensuring accurate integration and computation of results.
2.6. AgNPs of S. reticulata extracts
2.6.1. Synthesis of AgNPs
The selected root aqueous extract (50 mL) was mixed with 450 mL of 1 Mm AgNO3 and 10 Mm trisodium citrate (reducing agent) and added into an Erlenmeyer flask container and stirred at room temperature, kept on a rotary shaker (500 rpm) without light to contain AgNPs. The color shift was determined periodically up to 6 hours and later centrifuged at 7000 rpm to remove biologically green synthesized AgNPs for further evaluation (Dhir et al., 2024).
2.6.2. Purification of AgNPs
Ag NPs were purified using the ethanol precipitation technique. After 24 hours of reduction, 7 mL of absolute ethanol was added to the resulting colloidal silver solution. The mixture was then allowed to stand undisturbed overnight to facilitate nanoparticle precipitation. Once settled, the supernatant was carefully decanted, and the precipitate was washed three times with sterile distilled water to remove any residual impurities. Following purification, the Ag NPs were dried using a water bath maintained at 27°C. The decanted supernatant was again left overnight to ensure complete sedimentation, and the process was repeated using the same protocol to enhance the yield and purity. The resulting NPs were finally stored in an airtight Eppendorf tube, shielded from light using aluminum foil, to preserve their integrity for further analysis (Dhir et al., 2024).
2.6.3. Evaluation of AgNPs
Photon correlation spectroscopy (PCS) - PCS was employed to analyze particle size, providing the Z-average (mean hydrodynamic diameter) and polydispersity index (PDI) as measures of distribution uniformity. Measurements were conducted using a Zetasizer Nano S (Malvern Instruments, UK) at a fixed scattering angle of 173° and a controlled temperature of 25°C. Samples were appropriately diluted with ultrapure water prior to analysis to ensure accurate measurements (Dhir et al., 2024).
FTIR Spectroscopy analysis - The spectra were acquired using the OMNI sample attenuated total reflectance accessory on a JASCO FTIR spectrophotometer (FTIR-4600) using established procedures with certain refinements. The dried leaf and root powder was mixed with KBr and pressed into translucent disks for spectroscopic analysis. Under continuous pressure, a tiny amount of the extract from each plant part sample made from different solvents was carefully applied straight onto the infrared spectrometer’s germanium component. Infrared absorption measurements were taken over a range of wavelengths from 400 cm-1 to 4000 cm-1. The blank KBr pellet was scanned to obtain reference spectra before each sample replicate measurement. The spectral peaks were acquired at a resolution of 4.0 to 1.0 cm to improve the signal-to-noise ratio. Experiments were conducted in duplicate. An FTIR spectral analysis was performed for the samples by examining the peak value in the infrared radiation phase (Akhter et al., 2024).
SEM analysis - The surface morphology and particle size distribution of the synthesized AgNPs were analyzed using a scanning electron microscope (SEM, JSM-6610 LV, JEOL Asia PTE Ltd, Japan). Prior to imaging, the AgNPs were subjected to purification by centrifugation at 10,000 rpm for 15 minutes, resuspended in sterile double-distilled water, and re-centrifuged at the same speed for an additional 10 minutes. The resulting pellet was oven-dried at 50°C. A thin film of the sample was then prepared by placing a small aliquot onto a carbon-coated copper grid. Excess liquid was gently removed with blotting paper, and the grid was dried under a mercury lamp for approximately 5 minutes. SEM analysis provided detailed insights into the morphological features and size distribution of the AgNPs, along with high-resolution imaging (Maršík et al., 2024).
2.7. Antibacterial activity of the extracts
Disc diffusion method - The samples were individually tested against two Gram-negative bacteria [Escherichia coli (MCC25175) and Pseudomonas aeruginosa (ATCC27853)] and two Gram-positive bacteria [Staphylococcus aureus (MCC2408) and Enterococcus faecalis (ATCC 29212)]. All antimicrobial activity was carried out according to the CLSI Guidelines. The agar disc diffusion method was employed to assess the antimicrobial activity of the test samples. Microbial suspensions were prepared with turbidity adjusted to correspond to the McFarland 0.5 standard, and they were subsequently diluted with sterile distilled water to a final concentration of 1 × 10⁵ cfu/mL The adjusted microbial suspensions (100 µL) were spread onto the Muller Hinton agar plates. Subsequently, test samples were placed. Gentamicin (10 mcg) was used as a positive control against E. coli and P. aeruginosa, and Vancomycin (30 mcg) was used as a positive control against S. aureus and E. faecalis. Plates were incubated at 37°C for 24 hours. The diameters of clear inhibition zones were measured using a caliper and were used to evaluate the antimicrobial potential of samples (Mohamed et al., 2024).
Anti-inflammatory activity of S retuculata root extract (SRE) and S retuculata root nanoparticles (SRN) using albumin denaturation assay –
The method of Mizushima was employed with slight modifications. The reaction mixture comprised varying concentrations of the test extract combined with a 1% aqueous solution of bovine serum albumin. The pH was modified by adding a small volume of 1N HCl. The samples were kept in incubation at 37°C for 20 minutes, followed by heating at 57°C for another 20 minutes. The cooled mixtures were analyzed for turbidity by spectrophotometric analysis at 660 nm (Mohamed et al., 2024). The experiment was performed in triplicate. Percent inhibition of protein denaturation was calculated as follows:
2.8. Antioxidant assay
DPPH Assay - The antioxidant potential of the plant extract (SRE) and the synthesized nanoparticles (SRN) was assessed using the DPPH (2,2-diphenyl-1-picrylhydrazyl) free radical scavenging assay. A fresh 0.1 mM DPPH solution was prepared in methanol, while the test samples were dissolved in sterile distilled water at concentrations ranging from 12.5 to 200 μg/mL. For each assay, 1.5 mL of DPPH solution was mixed with 500 μL of the sample (either SRE or SRN), resulting in a total volume of 2 mL. The mixtures were then vortexed, and incubation was done in the dark at room temperature (25 ± 2°C) for 30 minutes to ensure complete interaction. Absorbance readings were taken at 517 nm using a UV-Vis spectrophotometer, with ascorbic acid serving as a positive control and a DPPH solution without a sample as the negative control (Shah et al., 2024). The percentage inhibition of DPPH radicals was calculated using the following formula:
Where A (Control) represents the absorbance of the DPPH solution alone, and B (Sample) denotes the absorbance of the reaction mixture containing the test sample. The IC50 value (the concentration required to achieve 50% inhibition of DPPH radicals) was determined using the linear regression analysis, with lower IC50 values indicating higher antioxidant activity.
2.9. Statistical analysis
All measurements were performed in triplicate, and the results were expressed as mean ± standard deviation (mean ± SD). Statistical analysis was conducted using GraphPad Prism version 8.0.2. Differences between mean values were assessed by one-way analysis of variance (ANOVA) with Tukey’s multiple comparison test (P< 0.05).
2.10. Results and Discussion
This work thoroughly assesses the phytochemical, physicochemical, and biological characteristics of S. reticulata extracts and their associated AgNP formulations, emphasizing the impact of solvent type and plant part on yield, stability, and bioactivity. The extraction step is essential for determining bioactive compounds from plant materials while minimizing the presence of interfering substances.
2.11. Extraction of S. reticulata root and leaf
Methanolic and aqueous extracts were prepared under the same conditions. The results demonstrated that aqueous extraction yielded significantly higher amounts of extractable solids compared to methanol. The yield of extractable solids was 11.95 ± 2.4 and 13.86 ± 1.6 for leaves and roots. This shows the dependence on the polarity of extraction solvents. Comparatively, for methanol, the yield of extractable solids was 10.76 ± 2.2 and 11.53 ± 2.4 for leaves and roots. This improved recovery corresponds with previous research on Ocimum sanctum, wherein aqueous solvents enabled superior extraction of polar phytochemicals (Bharath et al., 2023).
Qualitative Phytochemical estimation
The phytochemical screening of S. reticulata demonstrated the presence of alkaloids, terpenes, phenols, flavonoids, saponins, tannins, and steroids. They were found in methanolic and aqueous root and leaf extracts. Qualitative phytochemical tests are shown in Table 1.
Alkaloids, flavonoids, phenols, tannins, saponins, steroids, and glycosides were confirmed to be present in all extracts by phytochemical analysis, with the aqueous root extract exhibiting more pronounced reactions, particularly for flavonoids (+++), phenols (+++), and steroids (+++). These qualitative results were then validated using quantitative analysis. The aqueous root extract exhibited the highest TPC at 82.296 ± 2.9 mg GAE/g and flavonoid content at 333.1 ± 5.4 mg QE/g, whereas the methanolic leaf extract demonstrated the lowest values at 15.86 ± 2.4 mg GAE/g. This indicates that water more efficiently removes antioxidant-laden substances from root tissues. A similar trend was noted in Terminalia chebula, wherein aqueous root extracts surpassed aerial portions in phenolic and flavonoid output (Tharani et al., 2023).
2.12. Quantitative determination of the chemical constituents
2.12.1. Estimation of total phenolic and flavonoid contents
The TPC was determined using the Folin–Ciocalteu reagent. The phenolic content varied across different extracts of S. reticulatla, depending on the solvent used, and was expressed in milligrams of GAE. Figures 1 & 2 depict the standard calibration curve for gallic acid and quercetin. Figures 3 & 4 depict the comparison between the extracts for TPC and total flavonoid content. Table 2 highlights the wide variation in TPC across different extracts, ranging from 15.86 ± 4.1 to 82.296 ± 3.1 mg/g, expressed as GAE. S. reticulatla roots exhibited the highest TPC. The total flavonoid content was determined using the AlCl3 method. The flavonoid content varied across different extracts of S. reticulatla, depending on the solvent used, and was expressed in milligrams of QEs. The content of flavonoids expressed as QEs varied from 3.904 ± 5.1 to 333.10 ± 5.4 (Table 2).
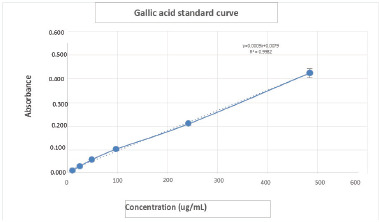
Figure 2
Standard calibration curve of quercetin for the determination of the total flavonoid content.
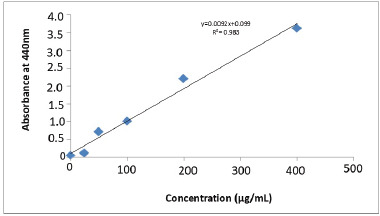
Figure 3
Absorbance changes with gallic acid in root and leaf extracts of S. reticulata at varying doses. One-way ANOVA and Tukey’s post hoc test were used to evaluate the data. Across all doses, aqueous extracts exhibited marginally greater absorbance than methanolic extracts.
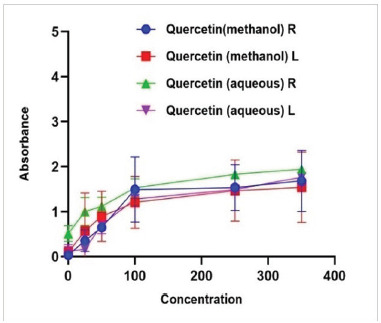
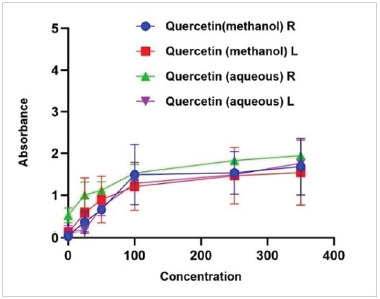
Figure 4
Change in absorbance with quercetin in S. reticulata root and leaf extracts. Data were analyzed using one-way ANOVA followed by Tukey’s post hoc test. Aqueous extracts showed higher absorbance compared to methanolic extracts across concentrations.
The gallic acid standard curve is shown for total phenolic concentration. A regression line derived from gallic acid determines the phenolic content of the unknown substance. The conventional curve of gallic acid yielded a regression line of y= 0.0009x + 0079, with an R2 value of 0.9982.
The quercetin standard curve is shown for the total flavonoid concentration. A regression line derived from quercetin determines the flavonoid content of the unknown substance. The conventional curve of quercetin yielded a regression line of y = 0.0092x + 0.099, with an R2 value of 0.983.
2.13. Quantitative analysis of mangiferin content in S. reticulate by HPLC:
Mangiferin, a well-known bioactive compound, has been identified as a major constituent in S. reticulata. Due to its established presence and pharmacological relevance, mangiferin was selected as the reference standard for comparison in the HPLC analysis of aqueous root extract. The quantitative analysis confirmed the presence of mangiferin in the sample, as indicated by a prominent peak in the chromatogram, accompanied by minor peaks attributable to impurities. The retention times for mangiferin in the standard and the extract were recorded as 2.396 and 2.397, respectively, aligning with previously reported data on its occurrence in S. reticulata (Figure 5).
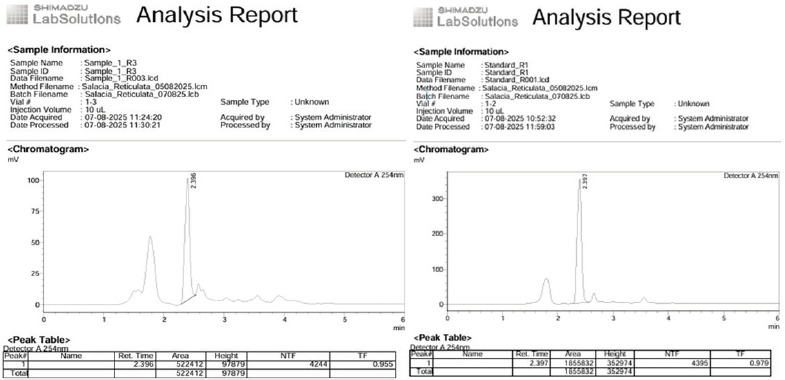
HPLC analysis identified mangiferin as the most bioactive component in the aqueous root extract, exhibiting a retention time of 2.396 minutes. This largely aligned with standard references (2.397), showing very minor discrepancies, presumably attributable to matrix effects or moderate instrumental variability. The existence of supplementary peaks indicates the presence of other phenolic compounds or mangiferin analogs. A pertinent investigation on Mangifera indica indicated a similar retention range for mangiferin, corroborating the validity of these results (Toscano et al., 2024).
2.14. Preparation and evaluation of AgNPs of root aqueous extracts
The synthesis of Ag NPs was validated by the color transition from light yellow to reddish-brown. It has been demonstrated that the root extract of S. reticulata serves as an effective capping and reducing agent for Ag+ ions, resulting in the successful creation of Ag NPs. The produced nanoparticle was assessed using the following methods.
2.15. PCS analysis
The particle size, polydispersity index (PDI), and zeta potential of silver nanoparticles (AgNPs) synthesized from methanolic leaf extract and aqueous root extract were measured using a Malvern instrument, yielding average particle sizes of 306 nm and 230.8 nm, respectively. The PDI for the same was found to be 0.292 and 0.319. The zeta potential was found to be -16.8 and -26.8 mV for methanolic and aqueous NPs (Figures 6 & 7).
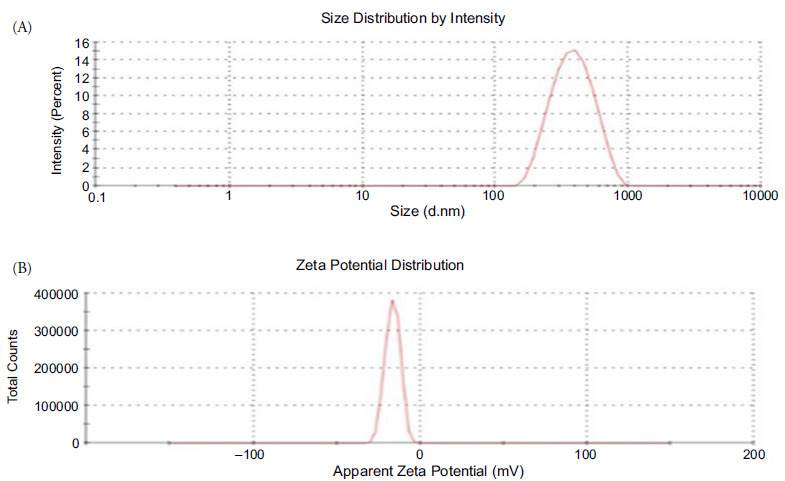
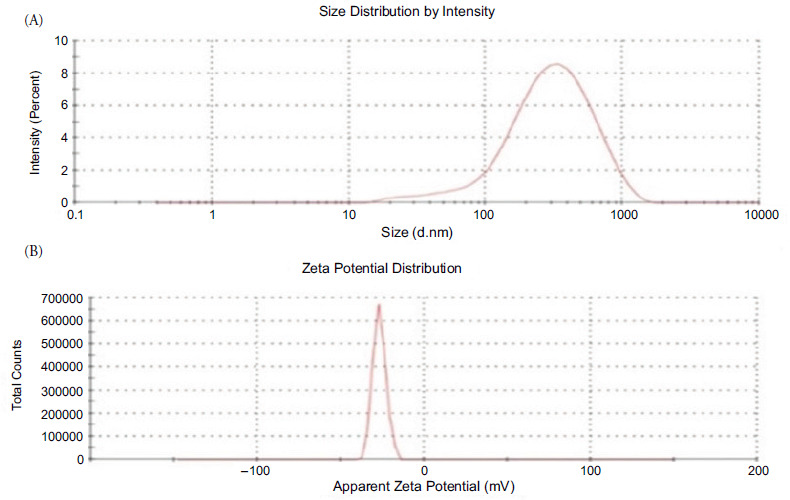
Characterization of NPs demonstrated notable variations contingent upon the type of extract utilized. AgNPs generated from aqueous root extract exhibited a smaller average particle size (230.8 nm) and a greater negative zeta potential (-26.8 mV), signifying enhanced colloidal stability relative to methanolic leaf-derived NPs (306 nm, -16.8 mV). Both extracts demonstrated advantageous polydispersity indices (0.292 and 0.319), signifying a homogeneous size distribution. These results corroborate conclusions from research on–mediated NPs, indicating that aqueous extract produced smaller, more stable particles (Mohammed et al., 2023).
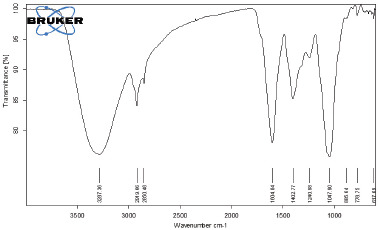
FTIR Spectra
The FTIR analysis of the methanolic leaf extract (Figure 8a) revealed peaks at 3247.22, 2933.73, and 1592.49 cm-1, suggesting the presence of phenolic O–H, C–H, and C=C groups. The identified functional groups indicate the presence of phenols, flavonoids, and alkenes, which moderately contribute to the formation of NPs. The methanolic extract–based AgNPs (Figure 8b) exhibited peaks at 3327, 2920.29, 1599.33, and 1401.97 cm-1, indicating the participation of O–H, C–H, and C=C groups. The identified functional groups indicate the presence of phenols, alkanes, aromatics, and nitro compounds. The aqueous root extract (Figure 8c) exhibited peaks at 3271.18, 2919, 2850.18, and 1606.40 cm-1, indicating stronger signals for O–H, C–H, and C=C groups, which suggest a higher biomolecular content. The aqueous root extract–derived AgNPs (Figure 8d) exhibited more pronounced and shifted peaks at 3287.36, 2912.66, 2850.48, and 1604.84 cm-1, indicating enhanced interactions and improved stabilization of the NPs attributed to active biomolecules.
Figure 8
(a). FTIR spectrum showing peaks at 3247.22, 2933.73, and 1592.49 cm–1, indicating the presence of phenolic O–H, C–H, and C=C groups, which suggest phenols, flavonoids, and alkenes involved in nanoparticle synthesis
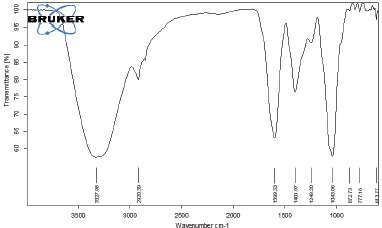
Figure 8
(b). FTIR peaks at 3327, 2920.29, 1599.33, and 1401.97 cm–1 indicate phenols, alkanes, aromatics, and nitro compounds involved in nanoparticle synthesis.
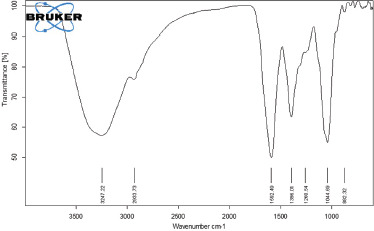
Figure 8
(c). FTIR peaks at 3271.18, 2919, 2850.18, and 1606.40 cm–1 indicate abundant O–H, C–H, and C=C groups, suggesting higher biomolecular content.
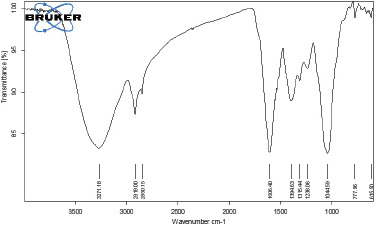
Figure 8
(d). FTIR peaks at 3287.36, 2912.66, 2850.48, and 1604.84 cm–1 suggest strong biomolecular interactions and enhanced nanoparticle stabilization.
FT-IR spectroscopy identified significant functional groups such as O-H, C-N, and O=C=O in both the extracts and their NPs, indicating effective capping and stabilization by phytochemicals derived from plants. Comparable functional patterns were observed in Moringa oleifera–mediated AgNPs, affirming the involvement of biomolecules in the synthesis and stability of NPs (Mamgain et al., 2024).
2.16. SEM image of AgNPs
SEM image of AgNPs revealed that it exhibited spherical-shaped discrete particles of size ranging from 5 to 50 nm under the range of 2–200 nm (Figure 9).
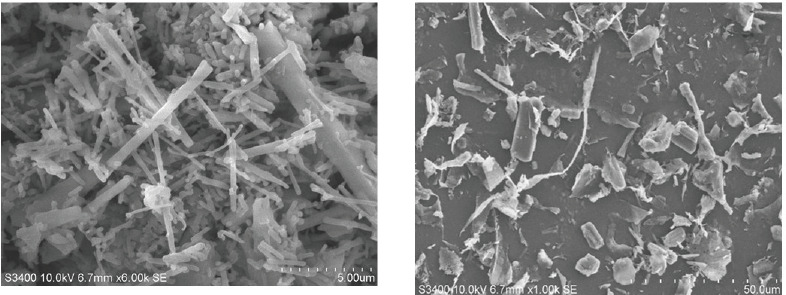
SEM imaging confirmed AgNPs’ nanoscale spherical form with diameters between 5 and 50 nm. The particles were homogeneous and well-dispersed, indicating good synthesis and stability. Due to powerful reducing and capping phytochemicals, S. reticulata extracts produce spherical AgNPs with similar dimensions and morphology. It has been observed that S. reticulata leaf extract–mediated AgNPs had identical spherical morphology and size distribution, confirming that plant-derived biomolecules affect nanoparticle shape and stability (Asker et al., 2024).
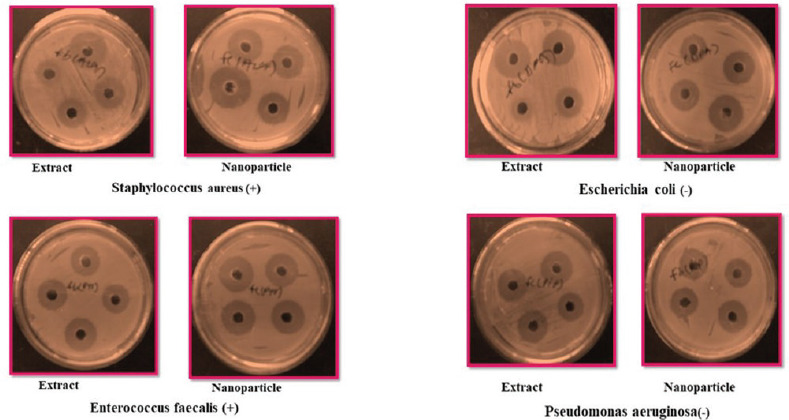
2.17. Anti-bacterial assay
The antimicrobial potential of AgNPs was investigated against two Gram-positive bacteria (S. aureus and E. faecalis) and two Gram-negative bacteria (E. coli and P. aeruginosa), clinically relevant bacterial strains at varying doses (25, 50, and 75 mg/mL). No inhibitory activity was detected at the minimal concentration (1 mg/mL), as indicated by the lack of growth suppression halos across all tested pathogens. However, at the moderate dose (50 mg/mL), a discernible antibacterial response emerged, with clearance zones measuring 23.0 ± 0.02 mm for S. aureus, 18.25 ±0.75 mm for E. faecalis, 21.0 ± 0.05 mm for E. coli, and 16.25 ± 0.35 mm for P. aeruginosa, revealing that gentamycin displayed the highest inhibition (Figures 10 & 11).
Figure 10
Antimicrobial activity of the extract and AgNPs against various bacteria. Data were compared using one-way ANOVA by Tukey’s model.
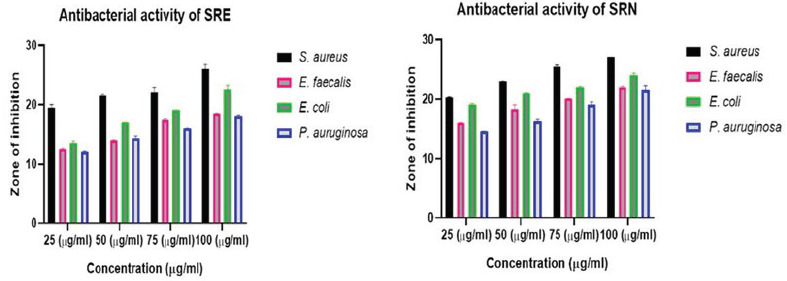
These findings highlight a concentration-reliant antimicrobial effect, where elevated NP levels are necessary to induce significant microbial inhibition, likely mediated through reactive oxygen species (ROS) generation or cellular envelope destabilization, with Gram-positive organisms exhibiting greater susceptibility compared to Gram-negative bacteria (Laryea et al., 2024). The enhanced susceptibility of Gram-positive bacteria to AgNPs may stem from their thick peptidoglycan layer, which is interwoven with teichoic acids, facilitating stronger interactions with the NPs. The observed zone of inhibition correlates directly with NP concentration, suggesting a dose-dependent antibacterial effect. This activity likely arises from electrostatic binding between negatively charged bacterial cell walls and positively charged NPs, disrupting cellular integrity (Dhir et al., 2024).
In addition, AgNPs may induce ROS production, triggering oxidative stress that damages vital cellular components. The proposed mechanism involves NPs’ adhesion to the cell membrane and mesosomes, impairing respiration, DNA replication, and division. By increasing membrane permeability and ROS accumulation, AgNPs ultimately lead to bacterial cell death (Yashikawa & You, 2024). The 50 mg/mL AgNPs treatment exhibited maximal antimicrobial efficacy against both Gram-positive and Gram-negative test strains, attributable to enhanced electrostatic interactions that facilitate nanoparticle adhesion to bacterial cell membranes, thereby effectively suppressing microbial proliferation.
Biological tests showed dose-dependent AgNPs antibacterial effectiveness. At 50 mg/mL, Gram-positive organisms showed increased sensitivity, with significant zones of inhibition (8.21 ± 3.43 mm for E. faecalis and 7.01 ± 2.33 mm for S. aureus), likely due to their cell wall composition. No action was detected at 1 mg/mL. Literature revealed that Camellia sinensis-derived AgNPs have similar antibacterial properties. Polyphenolic chemicals in green tea–mediated AgNPs enhanced their antibacterial effectiveness, notably against Gram-positive pathogens, with inhibition zones surpassing 10 mm (Salih et al., 2024).
In-vitro anti-inflammatory activity of Salacia reticulata Extract (SRE) and Salacia reticulata nanoparticle (SRN) using albumin denaturation assay
The results demonstrated concentration-dependent inhibition of protein denaturation for both SRE and SRN, suggesting their potential anti-inflammatory efficacy. At the lower concentrations (100 μg/mL and 200 μg/mL), SRN exhibited greater inhibition (24.90% and 39.66%, respectively) than SRE (21.05% and 34.92%, respectively), indicating a relatively higher potency. However, at the highest concentration tested (300 μg/mL), SRE (57.27%) showed slightly superior inhibition over SRN (55.36%), though both remained slightly less effective than the standard drug (61.38%) (Figure 12 & Table 3).
Figure 12
In vitro anti-inflammatory activity of SER and SNR determined using albumin denaturation assay (100, 200, and 300 µg/mL) of SRE, SRN and standard drug. Diclofenac sodium was used as the standard drug.
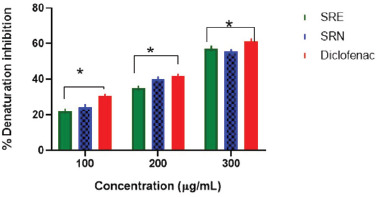
Table 3
In vitro anti-inflammatory activity of SRE and SNR using albumin denaturation assay.
The observed variations in inhibition efficiency between SRE and SRN may be attributed to differences in their phytochemical compositions, potential synergistic interactions, or varying mechanisms of protein stabilization (Mohamed et al., 2024). These findings highlight the promising anti- inflammatory potential of both compounds, with SRN demonstrating a greater efficacy at lower doses. Further investigations, including mechanistic studies and in vivo validation, are essential to elucidate their precise modes of action and therapeutic relevance in inflammatory conditions, which will be carried out in future studies (Asker et al., 2024; Mohammed et al., 2023).
Furthermore, SRN demonstrated increased anti-inflammatory efficacy at lower dosages (24.90% at 100 µg/mL and 39.66% at 200 µg/mL), while SRE showed slightly better performance at 300 μg/mL (57.27% versus 55.36%). In DPPH assays, SRN exhibited 92.3% inhibition, exceeding SRE’s 85.3% and approaching the efficacy of ascorbic acid at 94.6%. An analogous enhancement in antioxidant activity was noted in AgNPs derived from Zingiber officinale extracts. It has been reported that Zingiber-mediated AgNPs demonstrated significant DPPH radical scavenging activity, reaching an inhibition level of 93.4%. This efficacy was comparable to that of standard antioxidants and was linked to the high phenolic content present in the ginger extract utilized in the synthesis process (Wardana et al., 2024; Yan et al., 2025).
3. ANTIOXIDANT STUDIES
3.1. Determination of DPPH Free Radical Scavenging Activity
The DPPH radical scavenging assay demonstrated that both SRE and SRN exhibited significant antioxidant activity in a concentration-dependent manner. However, the SRN (nanoparticle) exhibited higher radical scavenging ability compared to SRE (plant extract) at all tested concentrations, with an inhibition percentage of 92.3% at 200 μg/mL, which was close to that of ascorbic acid (94.6% at 200 µg/mL) (Table 4). In contrast, SRE showed moderate activity, with 85.3% inhibition at 200 µg/mL (Figure 13). Such promising antioxidant potential from NPs derived from plant-based products has been reported from Caesalpinia sappan extract (Sasarom et al., 2024).
Figure 13
DPPH radical scavenging activity of plant extract (SRE) and synthesized nanoparticle (SNR) compared to ascorbic acid.
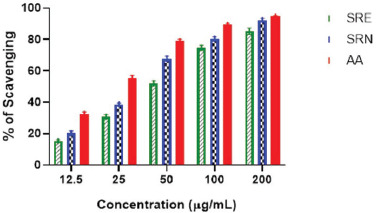
Table 4
DPPH radical scavenging activity of SRE and SRN.
The cumulative findings validate the improved biological efficacy and therapeutic potential of aqueous root–derived AgNPs from S. reticulata, supporting their prospective application in future plant-based nanomedicine.
3.2. Implications from the present study
Green synthesis is considered an eco-friendly and energy-efficient method to produce NPs without damaging the environment. In the present study, the leaves and roots of S . reticulata were utilized for the environmentally friendly synthesis of AgNPs and were characterized using different spectroscopic methods. It involves biological methods for producing AgNPs, which act as stabilizing and reducing agents. The phytochemical analysis revealed the presence of alkaloids, terpenes, flavonoids, phenols, saponins, tannins, and steroids in the aqueous root extract of AgNPs. The FTIR study reveals the presence of O-H, O=C=O, and O-H stretch, confirming the presence of hydroxyl and carbonyl groups.
The synthesized NPs exhibited a spherical shape and a particle size range from 230 to 306 nm. In addition, the TPC and total flavonoid content indicated good activity in aqueous root as well as in leaf extract. The quantitative analysis of mangiferin using HPLC confirmed the presence of the compound in the sample. The antibacterial activity showed the highest maximal antimicrobial efficacy against Gram-positive and Gram-negative test strains. The anti-inflammatory activity also exhibited inhibition at lower doses for aqueous root-based extract AgNPs, comparable with the standard. Radical scavenging by DPPH also exhibited significant inhibition in a dose-dependent manner. The observations indicated that the NPs of S. reticulata have the potential to be effective in treating microbial infections, besides alleviating the effects of oxidative stress–induced inflammatory diseases. The data of the study can be used for designing future research, involving different experimental models to determine accurately the efficacy of the formulation.
CONCLUSION
The study’s findings revealed that NPs derived from S. reticulata root extract demonstrated significant antimicrobial, antioxidant, and anti-inflammatory activities. In addition, the analysis indicated that these NPs preserved the pharmacologically active phytoconstituents inherent in the plant. NPs synthesized from natural sources are generally considered to be less immunogenic and, therefore, less likely to cause biotoxic effects. Traditionally, S. reticulata has been employed in the treatment of various health conditions. The promising results observed with green-synthesized NPs of S. reticulata may open new avenues for future research, particularly in the targeted delivery of therapeutics. Nevertheless, the safety profile of these NPs requires further investigation. More extensive studies using diverse experimental models are essential to validate and expand upon the current findings.