

1. INTRODUCTION
Obesity is a condition in which the body exceeds the normal fat accumulation threshold, which may be calculated and analyzed using the body mass index (BMI) of 30 kg/m2 or more (Ion et al., 2023). Many research studies have found a link between obesity, diabetes, oxidative stress, and gut microbiota. Obesity causes many negative health complications, such as adipose tissue dysfunction and inflammation (low level). Obesity, most importantly, promotes the production of reactive oxygen species (ROS) that causes oxidative stress, which damages macromolecules, such as DNA, proteins, and cells, leading to many dangerous diseases that the body may suffer from, particularly type-2 diabetes. Furthermore, if the body is obese, the intestinal microflora frequently experiences dysbiosis, which is a favorable environment for the proliferation of some opportunistic diseases in the intestine, including Enterobacter cloacae. These bacteria can produce lipopolysaccharide (LPS), an endotoxin that alters normal body metabolism and aggravates fat accumulation, which adds to the unfavorable consequences of diabetes (Caturano et al., 2023; Keskitalo et al., 2018; Li et al., 2023; Naomi et al., 2023).
Conventional treatments for obesity typically involve lifestyle modifications, pharmacotherapy, and, in some cases, surgical interventions. The cornerstone of obesity treatment involves dietary changes, increased physical activity, and behavioral therapy. While these interventions can be effective, they often require sustained effort and may not lead to significant weight loss for all individuals (Wadden et al., 2020). Regarding pharmacotherapy, several medications have been approved for obesity management, including orlistat (pancreatic lipase inhibitor), phentermine/topiramate (appetite suppressant), naltrexone/bupropion (appetite regulator), and liraglutide (GLP-1 receptor agonist). These pharmaceuticals often come with numerous adverse effects (Chakhtoura et al., 2023). In case of surgical interventions, bariatric surgery, including procedures such as gastric bypass and sleeve gastrectomy, is considered for individuals with severe obesity. While often effective, these surgeries carry risks, such as surgical complications, nutrient deficiencies, and the need for lifelong medical follow-up (Ram Sohan et al., 2024). Overall, the limitations and adverse effects associated with conventional obesity treatments have led to increased interest in alternative approaches, particularly the use of natural products.
Natural products, especially those derived from plants, have been explored for their potential anti-obesity effects through various mechanisms, namely metabolic and thermogenic stimulants, appetite suppressants, and enzyme inhibitors (Chan et al., 2021). Moreover, herbs are becoming increasingly popular because of their relative safety and low risk of negative effects. Secondary metabolites present in medicinal plants, such as flavonoids, have proven to have anti-obesity, antidiabetic, antioxidant, and antibacterial properties (Breijyeh and Karaman 2024; Chiocchio et al., 2021; Thawabteh et al., 2019).
In traditional medicine, Mansoa alliacea, a member of the Bignoniaceae family and a common medicinal herb located in Asian nations, is used to cure colds, fever, epilepsy, exhaustion, and cramping (Kp and Muthuswamy 2021). According to conducted surveys, M. alliacea extracts contain components such as polyphenols, flavonoids, alkaloids, and sterols. They also exhibit anti-inflammatory, antibacterial, antifungal, antioxidant, and anticancer properties in vitro (Ameenabee et al., 2020; Kp and Muthuswamy 2021; Valle-Dorado et al., 2022). Nevertheless, no study has yet been conducted to assess the anti-obesity potential of the extract and optimize the ultrasonic-assisted extraction (UAE) procedure of this therapeutic herb using the response surface methodology (RSM). Thus, the purpose of this study was to provide further scientific data on this possible therapeutic herb.
2. MATERIALS AND METHODS
2.1. Materials
2.1.1. Chemicals
The chemicals used in this study included ethanol (Merck, Germany), dimethyl sulfoxide (Merck), Follin–Ciocalteu’s phenol reagent (Merck), sodium carbonate (Merck), sulfuric acid (Merck), acetic acid (Merck), 2,4,6-tris(2-pyridyl)-s-triazine (Sigma-Aldrich, USA), iron (III) chloride (Sigma-Aldrich), potassium persulfate (Merck), 2,2’-azinobis(3-ethylbenzothiazoline-6-sulfonic acid) (Merck), 2,2-diphenyl-1-picrylhydrazyl (Sigma-Aldrich), and some other common chemicals that were bought from local chemical stores.
2.1.2. Preparation of herbal samples
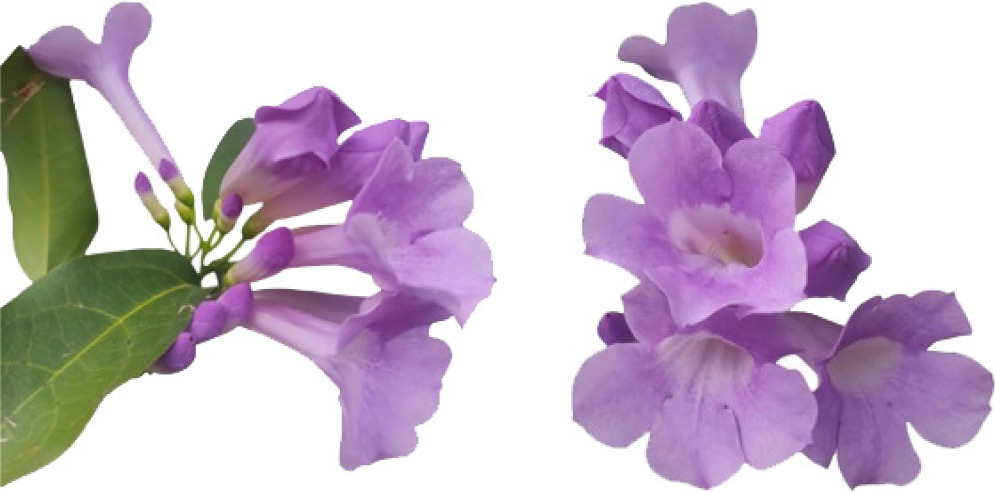
Samples of M. alliacea flower (Figure 1) were collected in Can Tho city, Binh Thuy district, Viet Nam in January 2023. Associate Professor Dr. Dang Minh Quan of the Department of Biology Education, Faculty of Education, Nam Can Tho University, recognized the medicinal samples, which were then stored with code MA.2023-CT001 at the animal and plant laboratory, Biology Department, Faculty of Natural Sciences, Nam Can Tho University.
2.2. Experiments
2.2.1. Extraction of M. alliacea flowers
After acquiring, 800 g of the M. alliacea flowers underwent cleaning and impurity removal. The samples were crushed into a fine powder (410 g) and dried in shade. The pulverized material was passed through a 60-mesh fine tray, and its moisture was evaluated following Vietnam Pharmacopoeia V. The sample had a moisture content of 6.98%.
2.2.2. Assessment of total alkaloid content (TAKC)
The study used a modified version of the complexation technique with bromocresol green, as reported by Chen et al. (2024), to measure the TAKC of extracted samples. A reaction mixture was created by mixing 1 mL of each sample and 1 mL of 2N hydrochloric acid. After 5 minutes of reaction, the mixture was filtered through a filter paper. To the filtered mixture, 5 mL of bromocresol green and 5 mL of phosphate buffer (pH = 4.7) were added. Chloroform, 10 mL, was then added to the mixture, which was agitated for 5 minutes. Mixture’s absorbance was finally measured at 470 nm. The TAKC in the examined samples was assessed using an atropine standard curve (mg of atropine equivalent (AE)/g extract).
2.2.3. Identifying the impact of individual factors on total alkaloid content
In order to maximize the TAKC of M. alliacea flowers, the study chose individual factors and followed the procedure outlined by Tran et al. (2024), with modifications. A heated ultrasound machine (Fisherbrand, USA) operating at 40 kHz was employed for investigation. Ethanol content (40%, 50%, 60%, 70%, 80%, 90%, and 99.5% [v/v]), material–solvent ratio (1:10, 1:15, 1:20, 1:30, 1:35, and 1:40 [w/v]), ultrasound duration (5–35 minutes), and ultrasound temperature (30–90°C) were among the examined single components. Factors, such as 99.5% ethanol at 30°C, a 5-minute ultrasonic duration, and a material–solvent ratio of 1:10, were kept constant for analyzing the effects of individual variables. Each extracted sample was filtered through a filter paper and TAKC quantification was accomplished accordingly (Chen et al., 2024).
2.2.4. Optimizing the extraction method for M. alliacea flowers
Three factors that had maximum impact on TAKC were chosen to create the optimal extraction method for alkaloids from M. alliacea flowers, using response surface methodology (RSM) with the Box-Behnken design, processed by Design Expert 11.0 software (USA). A second-order model with three levels (-1, 0, and +1) and three factors (A: temperature [70–90°C], B: ultrasound time [10–20 minutes], and C: ethanol concentration [70–90%, v/v]) was constructed in this investigation using the Box–Behnken experimental design (BBD), a common type of RSM design (Table 1). Statistical values of R2, adjusted R2, “p”, and lack of fit tests were used to evaluate the model’s fit and validity. The general form of polynomial model that represents the amount of TAKC is as follows:
where: Y is the response (TAKC); â0 is a constant term; â1, â2, and â3 are the linear first-order coefficients of A, B, and C; â11, â22, and â33 are the quadratic coefficient of A2, B2, and C2; and â12, â13, and â23 are the interaction coefficients of A and B, A and C, and B and C.
2.3. Examination of in vitro anti-obesity efficacy of optimized extract (OE)
2.3.1. Evaluation of anti-cholesterol activity
The Liebermann–Burchar reagent method described by Musa et al. (2019) was used to assess the optimal extract’s anti-cholesterol efficacy. For this, 500 µL of OE was mixed with 250 µL of cholesterol (1000 µg/mL) and incubated at 37°C for 5 minutes. Then, 210 µL of Liebermann–Burchar reagent (acetic anhydride and 0.1-mL sulfuric acid) was added to the mixture and incubated for 20 minutes at 37°C. Finally, the optical absorbance of the aforementioned combination was measured at 421 nm. Simvastatin served as a positive control in this experiment.
2.3.2. Evaluation of pancreatic lipase inhibitory activity
The OE was tested for pancreatic lipase enzyme inhibitory activity using the method reported by Monroy-García et al. (2024). To generate the reaction mixture, 20 µL of pancreatic lipase type II (0.5 mg/mL) was mixed with 20 µL of optimal extract at various concentrations and 140 µL of Tris-HCl buffer (pH = 7.4). The mixture was incubated for 60 minutes at 30°C. Then, 20 µL of p-nitrophenyl butyrate (0.01 mol/L) was added to the mixture and the absorbance of the mixtures was measured at 405 nm after 5 minutes of reaction. The positive control was orlistat. The inhibitory effectiveness was calculated as follows:
where C is the absorbance level without orlistat or optimal extract, and D is the absorbance level with orlistat or optimal extract.
2.3.3. Evaluation of carbohydrate metabolism enzymes inhibitory activity
The study focused on the inhibitory activities of α-amylase and α-glucosidase enzymes, using a modified approach of Tran et al. (2024) and Zhou et al. (2020). For α-amylase inhibitory activity, 50 μL of the sample at varied doses was reacted with 50 μL of phosphate buffer (pH = 7) and 50 μL of starch. After 15 minutes of reaction at 37°C, 200 μL of 1-M HCl was added. After that, 300-μL iodine reagent was added to the mixture. Finally the absorbance was measured at 660 nm.
For á-glucosidase inhibitory activity, 125 μL of the sample at different concentrations was mixed with 250 μL of α-glucosidase enzyme at 37°C for 15 minutes. Next, 125 μL of 4-nitrophenyl-D-glucopyranoside was added to the mixture and incubated for 20 minutes at the same temperature. The reaction mixture’s absorbance was measured at a wavelength of 405 nm. Acarbose served as a positive control in both methods.
2.3.4. Evaluation of antioxidant activity
The total antioxidant capacity (TAC) of OE was determined using the method described by Duc et al. (2024). For this, 150 μL of the sample was mixed with 450 μL of 0.6-M sulfuric acid, 28-mM sodium phosphate, and 4-mM ammonium molybdate, and incubated at 90–95°C for 90 minutes. The optical absorbance of the mixture after the reaction was measured at 695 nm.
The ferric-reducing antioxidant power (FRAP) of the OE was determined using the method described by Kačániová et al. (2025). First, 495 μL of FRAP solution was used to react with 5 μL of the sample in the absence of light for 30 minutes. Then the optical absorbance of the mixture was measured at 593 nm.
The ABTS•+ free radical neutralizing activity of the OE was assessed using the method described by Medina-Jaramillo et al. (2022). To this end, 495 μL of ABTS•+ was mixed with 5 μL of the sample and incubated at room temperature for 1/10th of an hour. The wavelength of 734 nm was chosen to determine the mixture’s optical absorbance after the reaction.
The 2,2-diphenyl-1-picrylhydrazyl (DPPH) radical neutralizing activity of the OE was determined using the technique described by Peng et al. (2022). Briefly, 20 μL of DPPH (1000 µg/mL) was mixed with 480 μL of test sample at different concentrations, and incubated for 30 minutes at 37°C in the dark. The optical absorbance of the mixture following the reaction was measured using a wavelength of 517 nm.
In all the four methods described above to investigate the antioxidant activity of M. alliacea flowers, the positive control was ascorbic acid.
2.3.5. Evaluation of antibacterial activity
Enterobacter cloacae LMG 2683, a bacterial strain kept at Nam Can Tho University’s Department of Biology, College of Natural Sciences, was used to test the antibacterial capacity of M. alliacea flowers. The agar well diffusion method was used to determine antibacterial ring diameter, the broth dilution method was used to determine minimum inhibitory concentration (MIC), and the drop plate method was used to determine maximum inhibitory concentration (MBC). All these processes were carried out as reported by Balouiri et al. (2016), with penicillin used as a positive control and dimethyl sulfoxide (DMSO) 10% as a negative control.
2.4. Data analysis
The ANOVA–Tukey test in Minitab 16.0 software (USA) was used to process and calculate statistical data for the study. The charts were created and developed with the Microsoft Excel 2016 program (USA). The optimization data and responsive surface pictures were handled with the Design Expert 11.0 software (USA).
3. RESULTS AND DISCUSSION
3.1. Effect of single factors on alkaloid extraction procedure
Many investigations have found a direct effect of temperature on the extraction of secondary metabolites. As temperature rises, so does the solubility of these compounds in solvents, which speed up the process of releasing them from raw materials. Furthermore, elevated warmth causes cell membranes to break down, enhancing diffusion and helping to release target compounds more efficiently. However, each compound has its stability depending on the temperature level. If the temperature rises over a particular point, it has a significant impact on heat-labile compounds (Torrents-Masoliver et al., 2024; Tran et al., 2024). Accordingly, from 30°C (TAKC = 97.60±2.72 mg AE/g extract) to 80°C (TAKC = 128.41±2.81 mg AE/g extract), the TAKC increased steadily. However, TAKC decreased as the temperature increased from 80°C to 90°C (116.82±1.48 mg AE/g extract) (Figure 2a). As a result, the experimental design used a temperature range of 70–90°C (Table 1).
Figure 2
The optimized extract’s total alkaloid content (TAKC) from M. alliacea flowers. Note: The Tukey test was used to compare mean±standard deviation (SD).
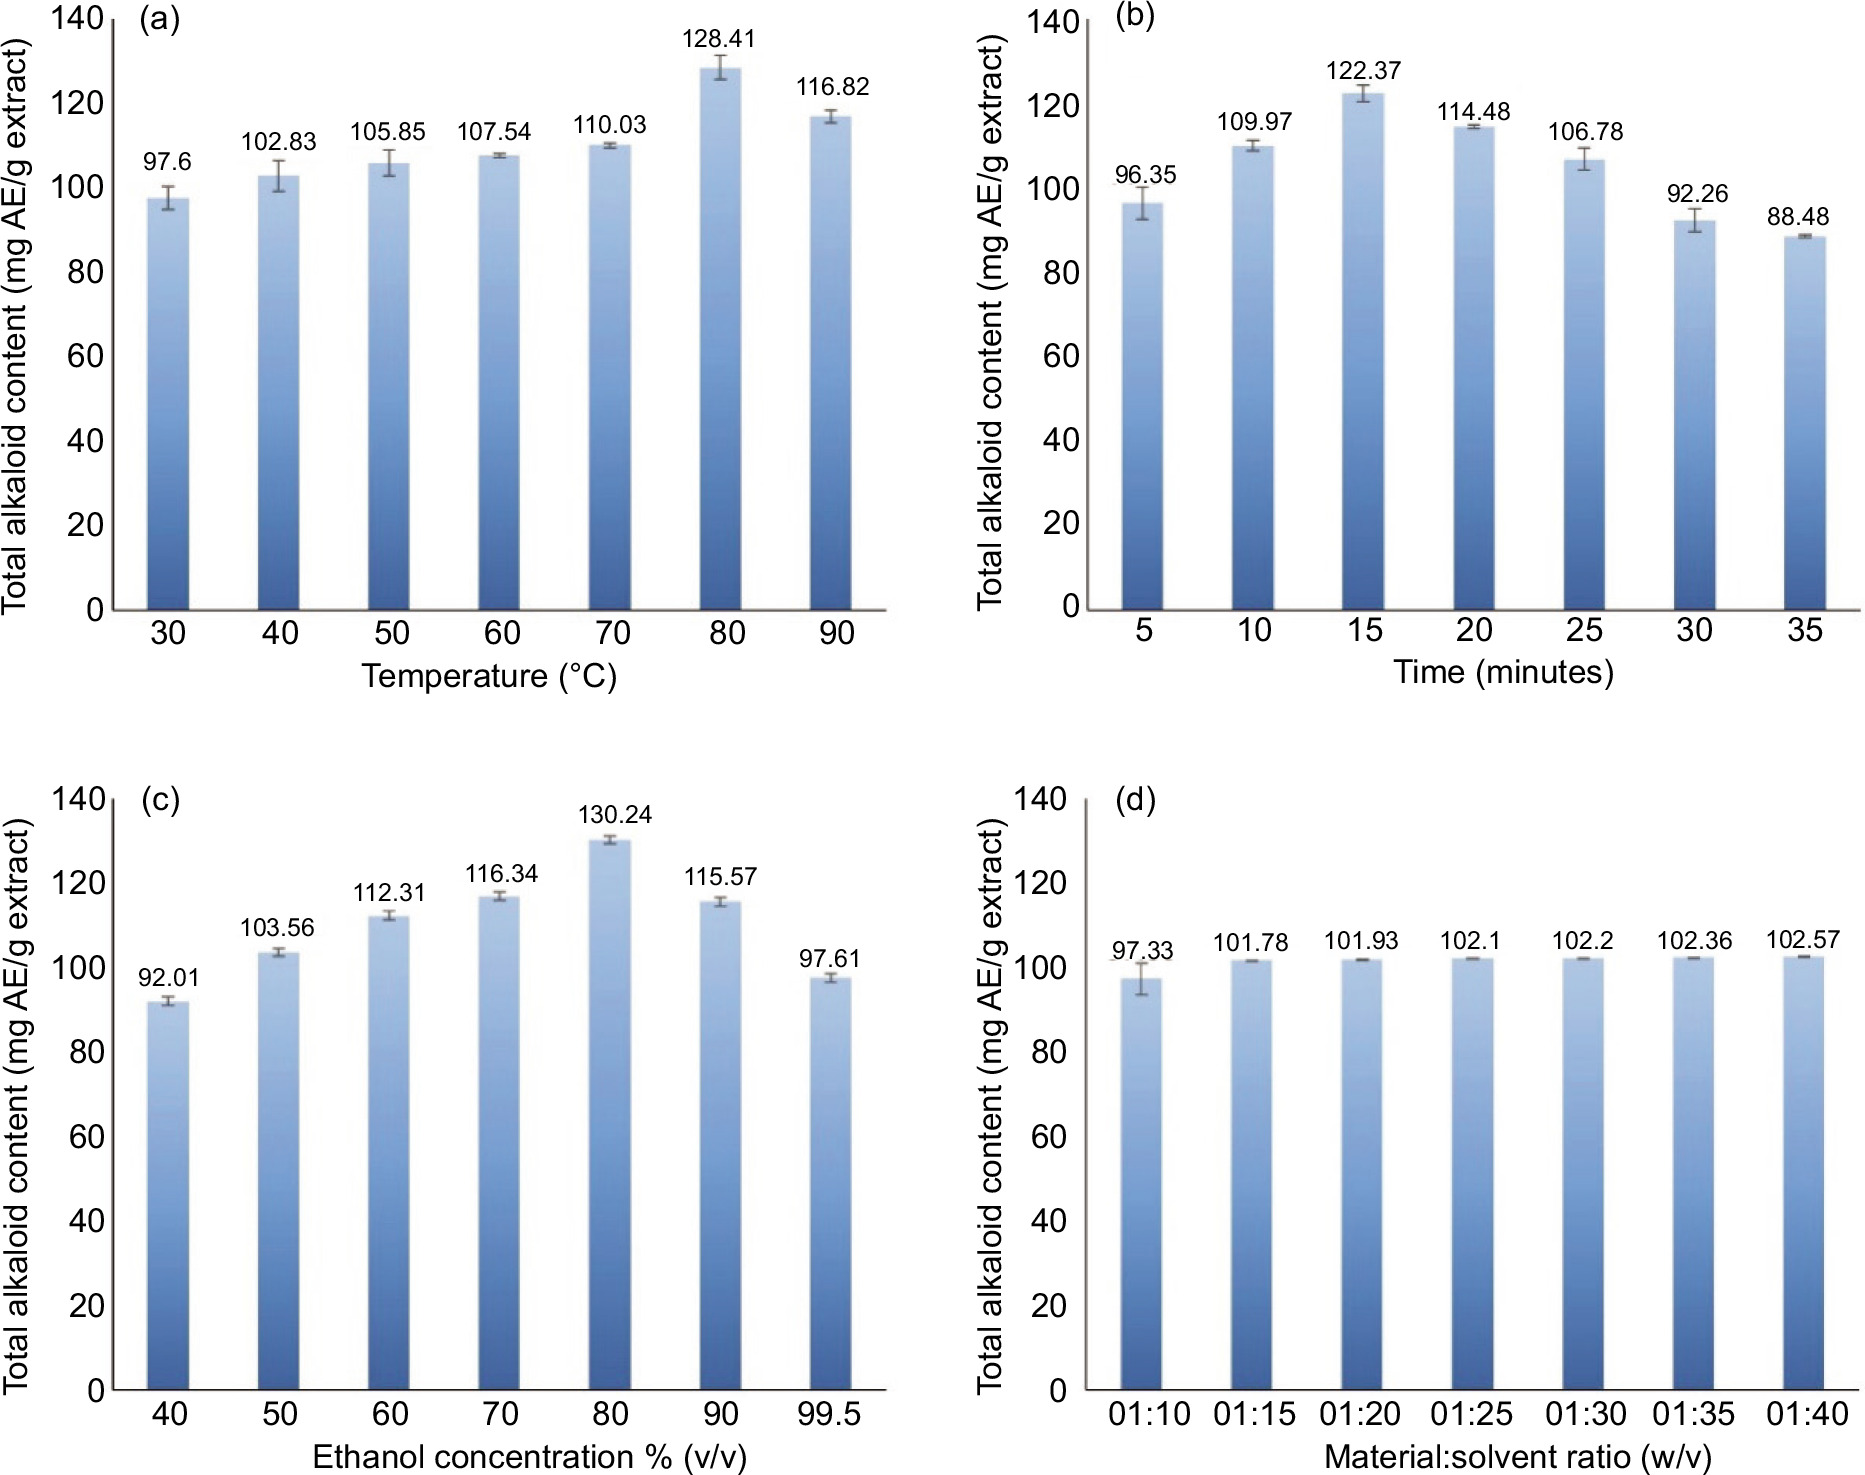
Furthermore, ultrasonic waves play a crucial role in extraction because they produce high-pressure zones, break down material’s cell structure, enhance contact area and diffusion rate, and extract compounds (alkaloids) swiftly (Aguilar-Hernández et al., 2020; Dary et al., 2017). The study investigated the impact of varied ultrasound periods ranging from 5 to 35 minutes on TAKC. The study found that TAKC peaked at 15 minutes (122.37±1.94 mg AE/g extract) and dropped with increase in ultrasound period (Figure 2b). As a result, more optimization trials were conducted with an ultrasonic period of 10 to 20 minutes (Table 1).
In general, ethanol is a safe solvent with high solubility and speedy evaporation. Concentration of ethanol is an important component in the dissolution of secondary metabolites. According to Ermi Hikmawanti et al. (2021), 70% ethanol extracts secondary metabolites more effectively than 96% ethanol because the water concentration in 70% ethanol is more, resulting in increased polarity and more efficient extraction of molecules with comparable polarity. Figure 2c shows that TAKC extracted from M. alliacea flowers powder increased from 92.01±1.73 mg AE/g extract at 40% ethanol concentration to 130.24±3.22 mg AE/g extract at 80% ethanol concentration, where it peaked. TAKC decreased at 90–99.5% ethanol concentration. Hence, the experimental design utilized an ethanol concentration of 70–90% (Table 1).
Finally, Figure 2d illustrates that TAKC increases with raw material–solvent ratio. When the raw material–solvent ratio was adjusted from 1/10 to 1/40 (w/v), TAKC increased from 97.33±3.79 mg AE/g to 102.57±0.09 mg AE/g extract. However, the study observed that TAKC acquired from M. alliacea flowers’ powder when utilizing a raw materials–solvent ratio of 1/30 (w/v) reached 102.20±0.04 mg AE/g extract, which statistically was not significant (p > 0.05), compared to the higher raw material–solvent ratios. Therefore, the raw material–solvent ratio of 1/30 could reduce raw material, solvent, and extraction expenses (Table 1).
3.2. Optimization of alkaloid extraction process of M. alliacea flowers
After studying the impact of individual factors on TAKC, three factors were identified as having maximum influence, that were temperature (°C), ultrasound time (minutes), and ethanol concentration (% v/v). The best extraction procedure was designed using RSM based on the Box–Behnken model with three factors and three levels (Table 1). The results (Table 2) demonstrate that trials (13th–17th) were core five (with greater alkaloid content than the remaining conditions, with TAKC ranging from 190.68±1.08 mg AE/g to 200.01±0.90 mg AE/g extract). The 15th trial yielded the highest TAKC result (200.01±0.90 mg AE/g extract). Moreover, the current study indicates the similarity between actual and predicted yields of TAKC.
Table 2
Three-factor Box–Behnken experimental matrix for M. alliacea flowers’s optimal extracts.
The study used statistical analysis to construct a second-order polynomial model that expressed the TAKC as follows:
where TAKC is total alkaloid content, A is temperature (°C), B is ultrasound time (minutes), and C is ethanol concentration (% v/v).
ANOVA statistical analysis of the components’ association is displayed in Table 3. The findings demonstrate that the correlation model constructed using the extraction components’ squares, interactions, and linear coefficients have a very reliable impact on TAKC. The model constructed using a lack-of-fit test was not statistically significant (p > 0.05) but was required because a good correlation model necessitated a good match between experimental and projected data (Table 2). Furthermore, according to Tran et al. (2024), a decent correlation model requires a correlation coefficient of determination, R2 > 0.8. Findings of the analysis revealed that the prediction model’s R2 was 0.9825, which was higher than 0.8, and the lack-of-fit value was 0.0690, which was higher than 0.05. As a result, the prediction model matched the experimental data for alkaloid content. The coefficient of variation (CV) for alkaloid content was 3.59%, indicating a relatively low CV value and acceptable dependability of the response model. All coefficients in the regression equation revealed statistically significant differences (p < 0.05), except for coefficients A and BC (p > 0.05).
Table 3
Analysis of correlation coefficients of factors to total alkaloid content (TAKC).
One factor was fixed at zero, while two other factors varied within the survey range to construct a 3D RSM (Figure 3). For this, extraction factors, such as temperature (°C), ultrasound time (minutes), and ethanol concentration (% v/v), have a quadratic impact on TAKC. TAKC rises with increasing ethanol concentration, temperature, and ultrasonic time, but reaches its peak and then tends to fall.
Figure 3
The optimized extract of M. alliacea flowers’ response surface to its total alkaloid content.
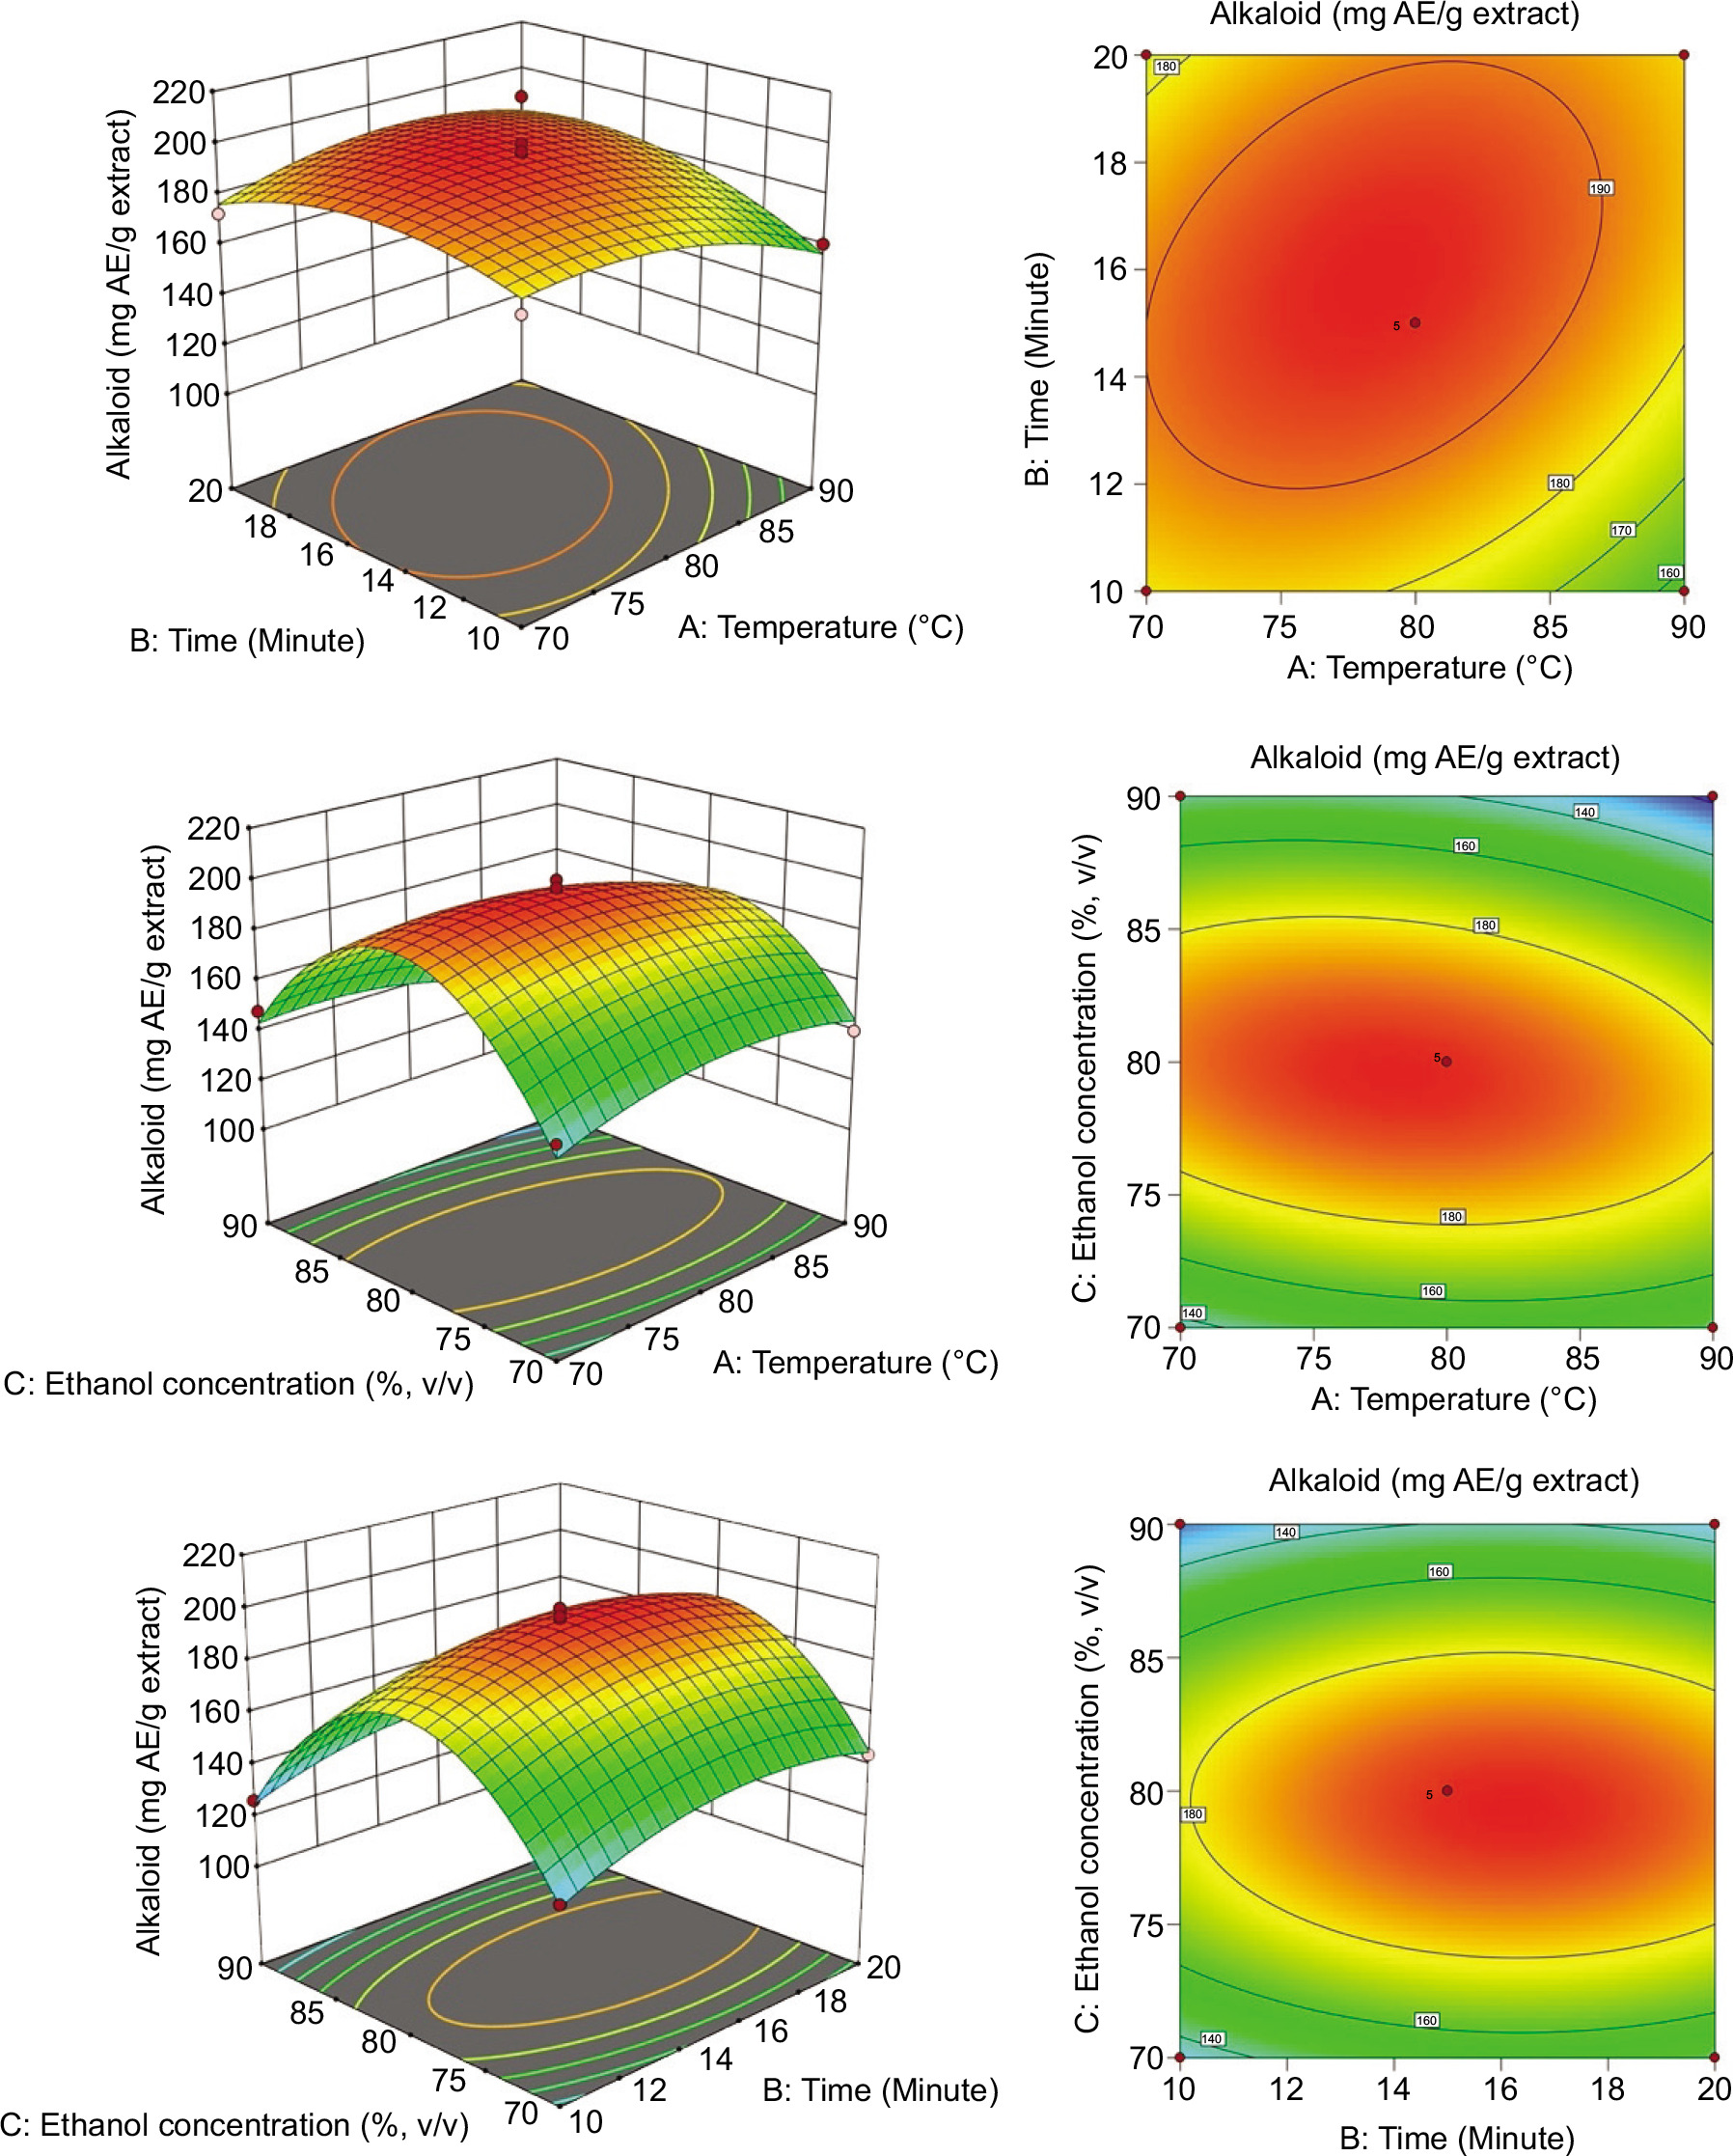
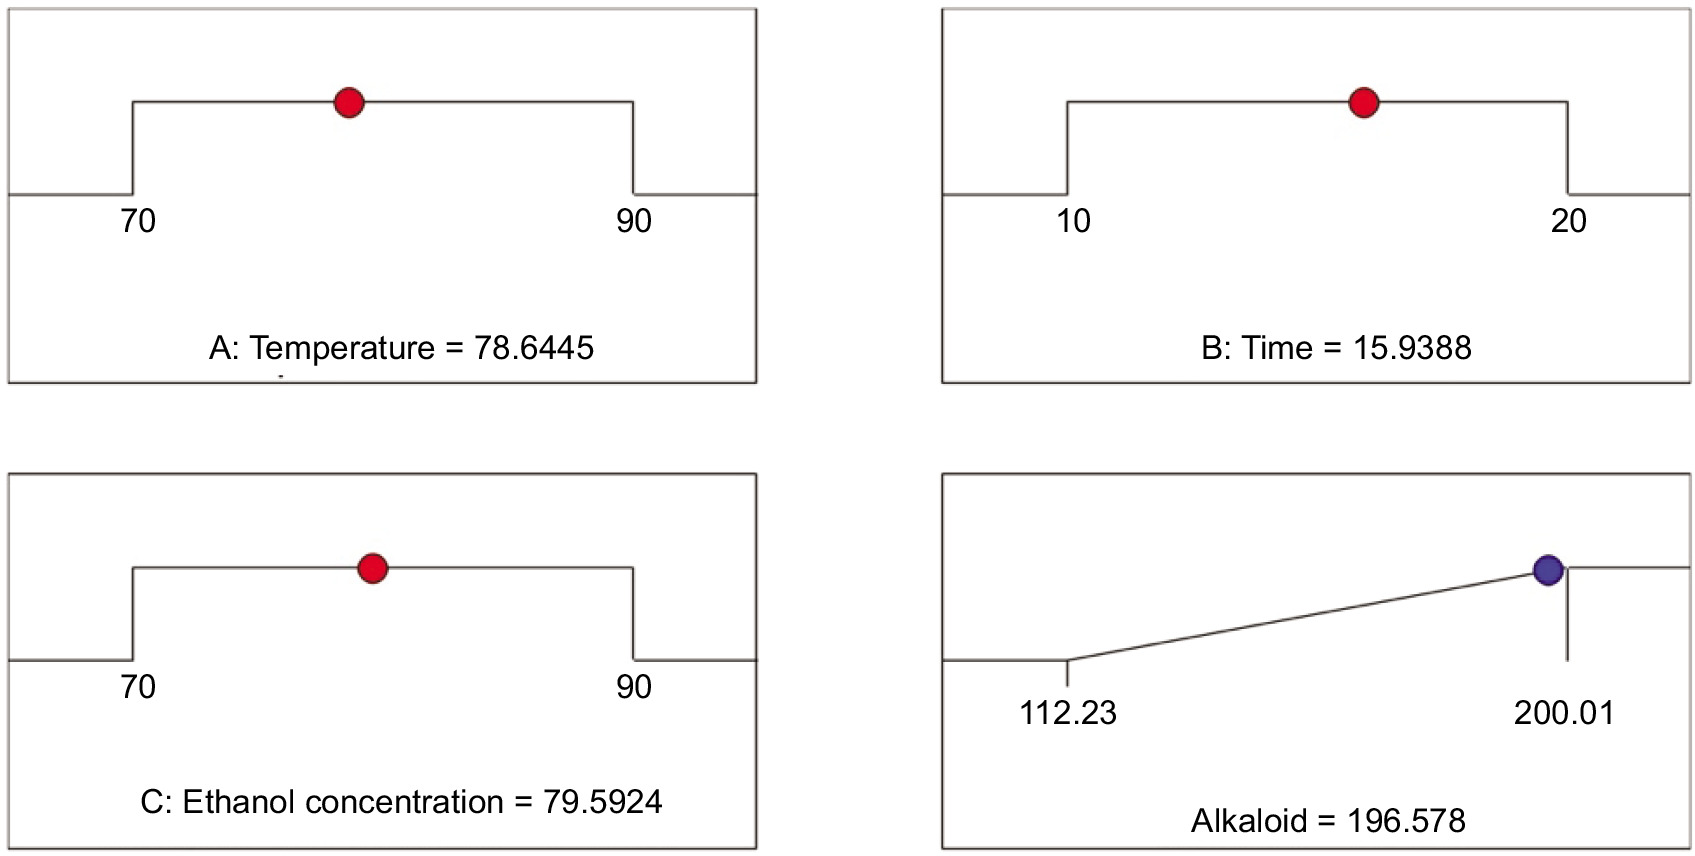
Figure 4 shows the optimal extraction factors obtained from the prediction model, including temperature of 78.65°C, ultrasound time of 15.94 minutes, ethanol concentration of 79.59% (v/v), and TAKC of 196.58 mg AE/g extract. To test the reliability of the optimal values predicted by this model (Figure 4), a validation experiment was conducted using extraction conditions adjusted to closely match those specified in the optimization model. The experiment was repeated thrice and the TAKC acquired was 197.14±4.53 mg AE/g extract, which was slightly different from the TAKC result acquired from the prediction model. It was concluded that the prediction model was completely reliable in terms of data factors for building an optimized process for extracting alkaloids from M. alliacea flowers. Furthermore, the TAKC of OE of M. alliacea flowers was higher than this value of non-optimized extract (NOE) of M. alliacea flowers. The extraction conditions of NOE were as follows: ethanol concentration: 99.5%, ultrasonic time: 5 minutes, temperature: 30°C, and material–solvent ratio: 1:10; the TAKC of NOE was 97.19±0.72 mg AE/ g extract.
3.3. Results of the in vitro anti-obesity efficacy of optimized extract
3.3.1. Results of anti-cholesterol activity
Cholesterol is one of the essential components that has an important role in maintaining the structure and normal biological functioning of the body. However, if the concentration of cholesterol in the blood exceeds the allowable threshold, it causes adverse effects on health. Increased cholesterol concentration creates atherosclerotic plaques in blood vessels, leading to poor blood circulation, resulting in heart attack and stroke, especially in obesity (Huff et al., 2024).
Simvastatin is frequently used in clinical practice as a successful drug because it inhibits the enzyme hydroxymethylglutaryl-coenzyme A (HMG-CoA) reductase that catalyzes the conversion of HMG-CoA into mevalonic acid, a precursor of cholesterol. However, abuse of simvastatin causes digestive problems, uncontrolled weight loss, and liver damage (Khatiwada and Hong, 2024). Hence, finding other solutions of natural origin containing secondary metabolites is a priority because they have few adverse effects and are relatively more effective. Currently, many published studies have demonstrated the anti-cholesterol effects of secondary metabolites, including alkaloids (Agustini et al., 2024; Barkas et al., 2023; Gururaja et al., 2017; Kou et al., 2016; Pirillo and Catapano, 2015; Zhang et al., 2018). The anti-cholesterol activity of OE of M. alliacea flowers and NOE are shown in Table 4. The OE shows higher anti-cholesterol activity than the NOE, with an IC50 value of 18.64±0.32 µg/mL, compared to 49.18±2.31 µg/mL. With an IC50 value that is just approximately 1.29 times lower than the positive control (simvastatin, IC50 = 14.48±1.10 µg/mL), OE is an effective anti-cholesterol metabolite. This was for the first time that OE high in alkaloids from M. alliacea flowers was tested for anti-cholesterol activity.
Table 4
IC50 values (μg/mL) of optimal and non-optimal extracts from M. alliacea flowers.
[i] Notes: NOE: non-optimized extract of M. alliacea flowers; OE: optimized extract of M. alliacea flowers; DPPH: 2,2-diphenyl-1-picrylhydrazyl; FRAP: ferric reducing antioxidant power; TAC: total antioxidant capacity; ABTS•+: free radical neutralizing activity. Values in the same column followed by the same superscript letters are not statistically different (p < 0.05).
3.3.2. Results of pancreatic lipase inhibitory activity
The pancreatic lipase enzyme directly influences cholesterol levels of the body by regulating blood cholesterol, because it is involved in lipid digestion and breaking down of triglycerides into monoglycerides and free fatty acids. Consequently, suppressing this enzyme is directly associated with regulating cholesterol levels, thus managing obesity and associated perilous conditions (Rajan et al., 2020). A recent research has indicated that alkaloid compounds, a category of secondary metabolites, can regulate cholesterol levels in the body by modulating cholesterol absorption in the intestine and inhibiting lipid metabolism enzymes (i.e., pancreatic lipase enzyme) (Pereira et al., 2017; Vulichi et al., 2023; Winanda et al., 2021).
The results of pancreatic lipase enzyme’s inhibitory activity for OE are presented in Table 4, the positive control selected was orlistat (Javed et al. 2023). The IC50 value of OE is 12.24±0.05 µg/mL, which is much lower than the IC50 value of NOE (about 5.22 times) and only 1.26 times lower than the positive control orlistat. Therefore, it is possible to conclude that OE has good pancreatic lipase inhibitory activity, demonstrating that M. alliacea flower is a viable therapeutic herb to combat obesity when considering natural alternatives to standard pharmaceutical medications on the market. The findings of the current study are unique, and presently no scholarly studies are available utilising this approach on M. alliacea.
3.3.3. Results of the carbohydrate metabolism enzymes inhibitory activity
α-Amylase and α-glucosidase are the two enzymes involved in the metabolism of carbohydrates, and were utilized in the current investigation. They frequently contribute to the conversion of carbohydrates into simpler sugars, which increase blood glucose levels and help the body to convert them into triglycerides and cholesterol, which cause fat buildup and blood lipid abnormalities. Thus, blocking these two enzymes lowers the absorption of glucose, regulates cholesterol, and prevents obesity (Lévuok-Mena et al., 2023; Unuofin et al., 2018).
It is demonstrated that secondary metabolites, such polyphenols, flavonoids, alkaloids, or tannins, can effectively block these two enzymes (AL-Ishaq et al., 2019; Behl et al., 2022; Lim et al., 2022; Naz et al., 2023). Among the mentioned secondary metabolites, alkaloids are considered a group of compounds with the ability to inhibit α-amylase and α-glucosidase very well. Many alkaloids, such as oriciacridone F, vasicine, vasicinol, piperumbellactam A, piperumbellactam B, piperumbellactam C, chaplu pyrrolidone A, and chaplu pyrrolidone B, isolated from medicinal plants have demonstrated good inhibitory effects (Zafar et al., 2016). Hence, the study evaluated the inhibitory activity of these two carbohydrate metabolic enzymes of the optimal alkaloid-rich extract from M. alliacea flowers and acarbose (as a positive control). Table 4 illustrates that OE outperforms NOE in inhibiting α-amylase and α-glucosidase, as indicated by their IC50 values. NOE and OE had respective IC50 values of 30.43±2.13 µg/mL and 130.88±0.46 µg/mL for α-amylase, and 13.49±0.23 and 68.56±1.99 µg/mL for α-glucosidase. Our findings showed that the study successfully developed an appropriate procedure for manufacturing an alkaloid-rich extract from M. alliacea flowers, and the extract efficiently blocked carbohydrate metabolic enzymes. Additionally, this is the first scientific report on this species’ activities.
3.4. Results of antioxidant activity
Secondary metabolic compounds from medicinal plants have excellent antioxidant effects (Cavazos et al., 2021; Roy et al., 2022; Zhang et al., 2023). This antioxidant activity is crucial for treating obesity because it is linked to the inhibitory actions of pancreatic lipase enzymes, carbohydrate metabolism enzymes, and anti-cholesterol properties. In obese persons, oxidative stress not only affects cells but also activates carbohydrate metabolism enzymes or pancreatic lipase enzymes, boosting fat and carbohydrate intake and storage of excess fat. Antioxidants reduce oxidative stress, have a substantial influence on the activity of the aforementioned enzymes, manage fat intake and glucose absorption, reduce oxidation of bad cholesterol and balance blood lipids, prevent atherosclerosis, and control metabolic activities (Almoraie and Shatwan, 2024; Bonomini, 2023; Kim and Park, 2023).
The antioxidant activity of OE and NOE was assessed using the four methods of TAC, FRAP, ABTS•+, and DPPH. Ascorbic acid served as a positive control in these procedures. Table 4 shows the results of the antioxidant activity of OE, NOE, and positive control. In general, OE provided superior results than NOE, with IC50 values ranging from 11.87±0.23 μg/mL to 30.43±2.13 μg/mL whereas NOE’s IC50 values varied from 58.73±1.47 μg/mL to 82.75±1.77 μg/mL. In FRAP, OE had an IC50 value of 27.37±0.26 μg/mL, which was approximately 1.92 times lower than the IC50 value of ascorbic acid, suggesting excellent activity, according to Duc et al. (2024). Our results were consistent with the findings of Ameenabee et al. (2020); Kp and Muthuswamy (2021); and Pal et al. (2024), showing that M. alliacea has excellent antioxidant activity. Many studies have shown that alkaloids have a major role in the antioxidant capacity of medicinal herbs (Gan et al., 2017; Macáková et al., 2019; Sharopov et al., 2018) as well as anti-obesity activity (Elizalde-Romero et al., 2024; He et al., 2022; Sun et al., 2022). The above-mentioned discussion and results in Table 4 demonstrate that the extract from M. alliacea flowers obtained by using the optimized method for alkaloid-rich extraction show very high antioxidant activity, demonstrating the great potential of using M. alliacea flowers as a source of natural antioxidants and anti-obesity formulation.
3.5. Results of antibacterial activity
One Gram-negative bacterium that can have a detrimental impact on human health, particularly obesity, is Enterobacter cloacae (family Enterobacteriaceae). It alters fat metabolism, upsets the balance of gut microbiome, and increases the risk of obesity. Additionally, E. cloacae has the ability to create inflammatory endotoxins, which can lead to insulin resistance and metabolic issues associated with obesity (Gu et al., 2023; Jin et al., 2022). Therefore, one strategy worth researching to aid in the treatment of obesity is to block these bacteria. Currently, many research studies on medicinal plants’ resistance against E. cloacae are available (Jin et al., 2022; Sosa-Castañeda et al., 2022). In addition, some alkaloids, such as spathullin A, spathullin B, and demecolcine, were also evaluated for their ability to resist E. cloacae (Nord et al., 2019; Thawabteh et al., 2024). However, relatively few published scientific investigations have addressed the relationship between obesity and bacterial resistance, particularly concerning M. alliacea species. Table 5 shows the antibacterial zone diameters (mm) of non-optimized extract of M. alliacea flowers (NOE) and optimized extract of M. alliacea flowers (OE) compared to tetracycline against E. cloacae. Overall, OE showed better results than NOE. In particular, the antibacterial zone diameter of OE varied from 21.90±0.66 mm at 320 μg/mL to 46.60±0.53 mm at 1280 μg/mL whereas NOE only produced antibacterial zone results of 17.50±0.50 mm at 1280 μg/mL and did not provide antibacterial zone diameter results at concentrations ranging from 80 μg/mL to 640 μg/mL. Particularly, the antibacterial zone width of OE was 2.66 times greater than that of NOE and 1.10 times more than that of tetracycline at a dosage of 1280 μg/mL.
Table 5
Antibacterial zone diameter (mm) of optimal and non-optimal extracts from M. alliacea flowers and tetracycline.
Table 6 shows that the MIC values of OE and NOE were 320 μg/mL and 1280 μg/mL, respectively. According to Lim Ah Tock et al. (2022), if the MIC result is between 160 μg/mL and 320 μg/mL, the sample has moderate antibacterial activity. If MIC > 320 μg/mL, the sample has poor antibacterial potential. As a result, it is clear that OE outperformed NOE in terms of antibacterial properties. Following Jeong et al. (2023), if MBC/MIC ≤ 4, the sample is considered bactericidal. Table 6 illustrates that MBCOE = 640 μg/mL and MICOE = 320 μg/mL, resulting in MBCOE/MICOE = 2 (<4). Thus, OE is thought to have bactericidal properties. Combining the above results, it was observed that OE from M. alliacea flower had the potential to resist E. cloacae and anti-obesity. This was also for the first time that this experiment was performed on M. alliacea species.
4. CONCLUSION
The study created an efficient procedure for obtaining alkaloid-rich extract from M. alliacea flowers by utilizing response surface methods with the Box–Behnken model, aided by ultrasound, and assessed OE’s anti-obesity, antioxidant, and antibacterial activities. The study’s findings revealed that the optimized alkaloid-rich extract from M. alliacea flowers showed anti-cholesterol, pancreatic lipase inhibitory, carbohydrate-metabolizing enzymes inhibitory, and anti-oxidant properties, besides antibacterial (Enterobacter cloacae) activity, indicating that M. alliacea is a potential anti-obesity herb. These activities occurred due to OE’s alkaloid concentrations. The study’s findings provided more trustworthy scientific information on the biological activities of M. alliacea flowers.
AUTHOR CONTRIBUTIONS
Conceptualization: T.C.L., C.K.T.D.; methodology: T.C.L., C.K.T.D.; investigation: T.C.L., D.T.P., D.V.M., N.H.B.L., P.K.D., C.K.T.D.; data curation: T.C.L., D.T.P., D.V.M., N.H.B.L., P.K.D., C.K.T.D.; validation: T.C.L., D.T.P., D.V.M., N.H.B.L., P.K.D., C.K.T.D.; project administration: C.K.T.D.; resource: C.K.T.D.; writing-original draft: T.C.L., D.T.P., D.V.M., N.H.B.L., P.K.D., C.K.T.D.; writing-review and editing: T.C.L., D.T.P., D.V.M., N.H.B.L., P.K.D., C.K.T.D.. All authors have read and agreed to the published version of the manuscript.