

1. INTRODUCTION
The local people have widely utilized the Moringaceae family as a staple food. Moringa oleifera, in particular, has been consumed not only for its nutritional value but also for its medical benefits (Anwar F et al., 2007).
Different parts of the M. oleifera plant contain important mineral profiles and are good sources of protein, vitamins, â-carotene, amino acids, and various phenolics. The root part of M. oleifera provides a combination of zeatin, quercetin, â-sitosterol, caffeoylquinic acid, and kaempferol (Bharali et al., 2005). Some studies have shown that this plant contains saponins and polyphenols (flavonoids), namely quercetin and catechin, two additional alkaloids in the form of moringine and moringinine, vanilla, â-sitosterol, â-sitostenone, 4-hydroxymellin, and octacosanoic acid (Faizi et al., 1995; Krinasi et al., 2015). Isothiocyanates and glucosinolates are also present. Isothiocyanates (ITC) are found in nature in the form of benzyl isothiocyanate (BITC), phenethyl isothiocyanate (PEITC), or phenyl isothiocyanate (PITC) (Bose C et al., 2007; Krinadi et al., 2015).
It is reported that M. oleifera root is widely used for various diseases, such as antimicrobial, anti-fungal, and antibacterial purposes, and can also reduce cholesterol levels [4–8]. The prevalence of diseases caused by high cholesterol worldwide in 2023 is quite high and is frequently encountered in society. For example, coronary heart disease accounts for 31.5%, stroke 24.4%, peripheral vascular disease 10.1%, and chronic kidney disease 2.4% (Ahmed et al., 2015; WHO., 2023).
Diseases with a high prevalence worldwide are often caused by microbes. Infectious diseases of the gastrointestinal tract, such as diarrhea, have a prevalence of 10–20%, dysentery 1–2%, and typhoid 0.1–0.5%. These diseases can be caused by bacterial infection. In addition to these, other diseases caused by bacteria include urinary tract infections at 0.5–1% and hemolytic uremic syndrome (HUS) at 0.01% (Pandey et al., 2012; WHO., 2023).
Bacterial infection in certain cases can also be associated with increased blood cholesterol levels by various mechanisms, such as HUS caused by O157:H7. Although this disease has a low prevalence compared to others, several studies have shown that people infected with E. coli O157:H7 have higher total cholesterol levels than those who are not infected. This demonstrates that E. coli infection is associated with elevated cholesterol levels. This type of bacteria produces toxins that can damage cells in the small intestine. This damage leads to the release of lipopolysaccharide (LPS) and increases blood cholesterol levels. In addition, E. coli bacterial infections can also cause inflammation, which can lead to increased cholesterol production in the liver (Feng et al., 2018; Liu et al., 2020; Nakajima et al., 2021; WHO., 2023).
This research will determine the anti-cholesterol activity of Moringa root extract (Moringa oleifera), considering the potential of this plant as discussed previously in the literature. Compounds with potential as anti-cholesterol agents include polyphenolic/phenolic group compounds, flavonoids, and alkaloids. Based on studies, these compounds can be optimally extracted with the addition of acid during the extraction process (Adebayo et al., 2022; Grupta et al., 2022, Oliveira et al., 2022; Sari et al., 2022; Zhu et al., 2022).
2. MATERIALS AND METHODS
2.1. Materials
Methanol, glacial acetic acid, Wagner, Mayer, FeCl3, and Liebermann-Burchard reagents; Nutrient Agar (NA), Nutrient Broth (NB), paper discs; methanol (technical grade), DMSO (Dimethyl Sulfoxide), tetracycline, E. coli bacteria, simvastatin, CMC, 25 male white rats, and cholesterol strips were used. The chemicals were obtained from Sigma-Aldrich, USA.
2.2. Preparation of M. oleifera root
Fresh MO roots obtained in Tanete Hamlet, Timoreng Panua Village, Panca Rijang Sub-district, Sidenreng Rappang District, South Sulawesi were first cleaned. Then, all parts of the plant were dried by aerating at room temperature in the open air until dry. The dried MO roots were cut into small pieces and then pulverized using a grinder (faika et al., 2019).
2.3. Preparation of Extracts and Phytochemical Screening
The ground powder of MO root was weighed and then macerated using various concentrations of methanol solvent with 1% acid addition. The samples were soaked for 3 × 24 h (1:4, b/v), and then evaporated to produce a viscous methanol extract (ME). The samples were diluted and tested for each ME using Wagner, FeCl3, and Liebermann-Burchard reagents (Ankad et al., 2015; Faika et al., 2019).
2.4. Antibacterial Bioactivity Assay
The antibacterial bioactivity assay against Escherichia coli was performed using the Kirby-Bauer disc diffusion method. E. coli bacteria were cultured and diluted with sterile distilled water until the cell density reached 25% transmittance at 600 nm (equivalent to OD600 approximately 0.8–1.0). Nutrient Agar (NA) and Nutrient Broth (NB) were used as solid and liquid media, respectively. Sterile 6 mm diameter paper discs were saturated with 20 μL of test extracts dissolved in DMSO at concentrations of 0.5%, 2%, 4%, and 6%. As controls, 20 μL of pure DMSO was used as a negative control, and 20 μL of tetracycline solution (30 μg/mL) was used as a positive control. The saturated discs were carefully placed onto the surface of NA plates previously inoculated with E. coli at standardized cell density. The plates were incubated at 37°C for 24 h. After incubation, antibacterial activity was assessed by measuring the diameter of the clear zone (inhibition zone) formed around each disc using a digital caliper. The clear zone indicated the area where bacterial growth was inhibited or killed (Greenwood et al., 1995; Bharali et al., 2003; Zhu et al., 2022).
2.5. Anti-cholesterol Bioactivity Assay
The test subjects used in the study were 25 mature mice. The age of the test animals was 2–3 months old. Adaptation to laboratory conditions was carried out for 1 week, each with a density of 5 animals per cage and grouped into 5 groups. The treatment was given every day for 21 days (Oliveira et al., 2022; Andini et al., 2023).
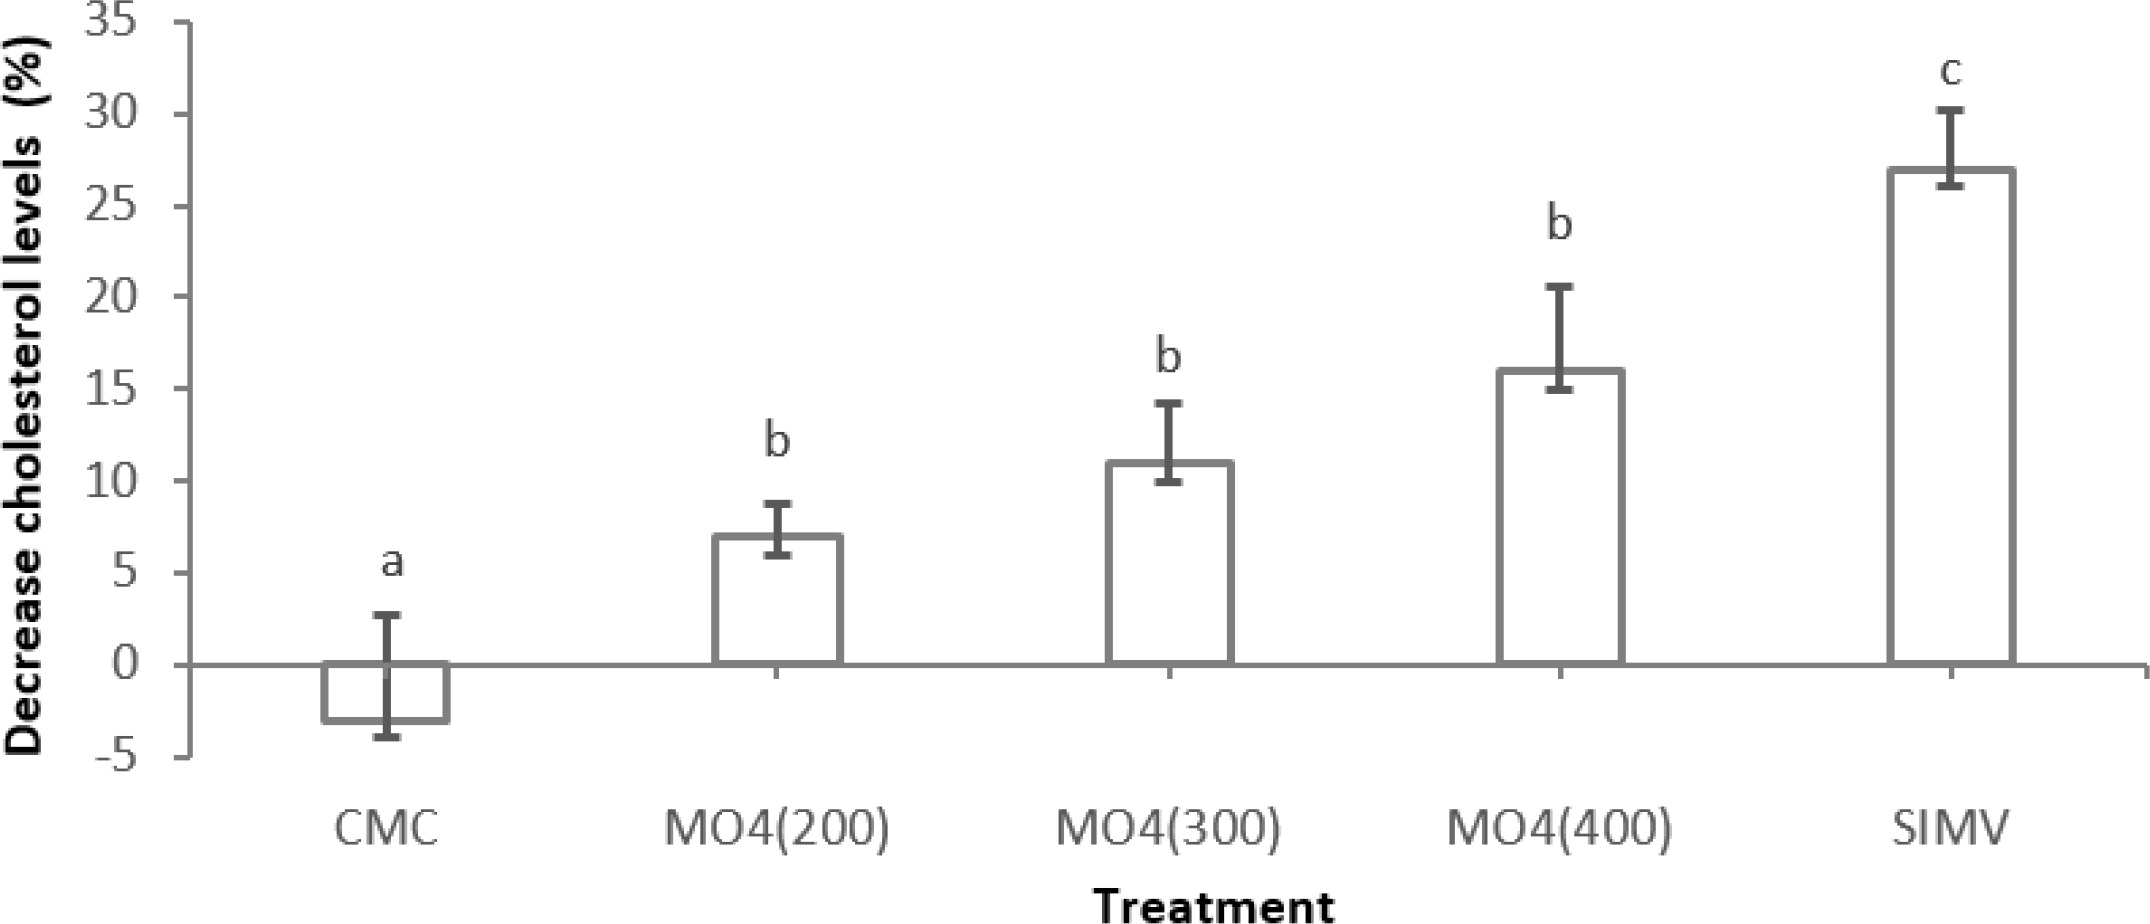
In this study, 25 adult male mice aged 2–3 months were used as experimental subjects. The animals were acclimatized to laboratory conditions for one week, with five mice housed per cage under standardized environmental settings. The mice were randomly assigned into five groups: a negative control group (receiving 0.5% CMC), a positive control group (receiving simvastatin at a dose of 5 mg/kg body weight), and three experimental groups administered the test extract at doses of 200, 300, and 400 mg/kg body weight, respectively. Treatments were administered once daily for a total duration of 21 days. Hyperlipidemia was induced by oral administration of quail egg yolk for 14 consecutive days to elevate blood cholesterol and lipid levels. Following the induction period, the experimental groups received the extract treatment for seven consecutive days according to their respective dosages, while the negative control group continued to receive CMC and the positive control group continued with simvastatin administration. Blood samples were collected via tail snipping. Samples were immediately analyzed to determine total cholesterol levels. The data obtained from these measurements were subsequently used to evaluate the effects of extract administration on total blood cholesterol levels in mice.
2.6. LCMS/MS Analyzer
ME that showed the best antibacterial activity was further analyzed using Liquid Chromatography-Mass Spectrometry/Mass Spectrometry (LC-MS/MS) to identify compounds based on molecular weight using the existing Massbank database and online resources, and was compared with some existing literature (Andini et al., 2023).
2.7. Ethical Approval
The animal study was conducted after receiving approval from the Animal Ethics Committee of Hasanuddin University, Makassar, Indonesia, with approval number: 940/UN4.6.4.5.31/PP36/2023. The experiments were conducted in accordance with the guidelines provided by the Faculty of Medicine.
2.8. Data Analytics
Data analysis was performed using SPSS software version 22.0 (IBM Corp., Armonk, NY, USA). The normality of data distribution was assessed using the Shapiro–Wilk test, and the homogeneity of variances was evaluated using Levene’s test. Since the data were normally distributed and showed homogeneity of variance, a one-way analysis of variance (ANOVA) was conducted to assess significant differences among groups. Post hoc comparisons were performed using Tukey’s Honestly Significant Difference (HSD) test. Results were considered statistically significant at p < 0.05.
3. RESULT AND DISCUSSION
3.1. Extraction Process
MO root samples that had been cleaned, cut into small pieces, and dried were weighed, yielding 3.55 kg. The sample was pulverized to obtain 1.15 kg of MO powder. Then extraction process was then carried out using a 1:25. b/v ratio.
The results in Table 1 and Figure 1 were analyzed using the ANOVA test and further tested with the Tukey test (p = 0.05), showing significant differences between different characters (a, b, c), while the same characters (a a/b, b/c, c) showed no significant differences.
Table 1
Treatment Tags.
| Treatment | Extracts |
|---|---|
| MO1 | 30% Methanol |
| MO2 | 30% methanol + 0.1% glacial acetic acid |
| MO3 | 50% Methanol |
| MO4 | 50% methanol + 0.1% glacial acetic acid |
| MO5 | 70% Methanol |
| MO6 | 70% methanol + 0.1% glacial acetic acid |
Figure 1
Average yield percentage (n = 3) of Moringa oleifera root methanolic extract (ME) at different concentrations (MO1–MO6), comparing samples with acid addition (light gray) and without acid (dark gray).
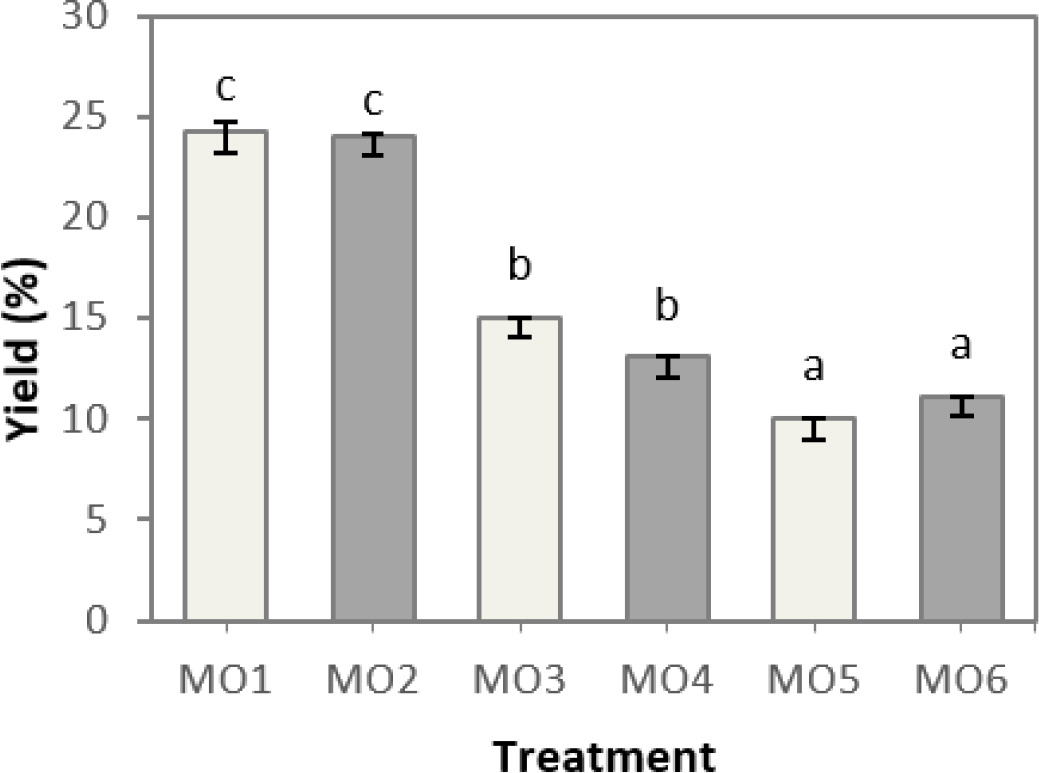
It is known that solvent concentration affects the yield (p < 0.05), but the addition of acid does not affect MO root extract (p > 0.05). Several previous studies reported ME yields from MO roots ranging from 17.2% to 18.9%. However, in this study, relatively high yields were obtained under the best conditions of MO1 and MO2 treatments, namely 24.25% and 24.05%, respectively. Concentration affects the solubility of the solvent. As the concentration of methanol decreases, the solubility of the solvent increases; this is due to water having a high polarity index. Some research supports this by showing higher yields with decreasing solvent concentration, allowing more polar active compounds to be extracted (Zhang et al., 2010; Adebayo et al., 2022; Grupa et al., 2022; Oleivera et al., 2022; Sari et al., 2022; Zhu et al., 2022).
3.2. Phytochemical Screening
Determination of compounds was conducted by phytochemical screening on each ME sample using several reagents. FeCl3 was used to test the flavonoid group by changing the color of the sample to green, blue, or black. Wagner’s reagent was used for identification of alkaloid compounds by turning the ME sample into a brown or reddish precipitate. Libermann-Burchard reagent was used to test steroid or terpenoid compounds; a change in the color of the sample to green, yellow, or blue indicated positive steroid compounds, while red, brown, or purple indicated positive terpenoid compounds (Ankad et al., 2015; Faika et al., 2019).
3.3. Antibacterial Bioactivity Assay
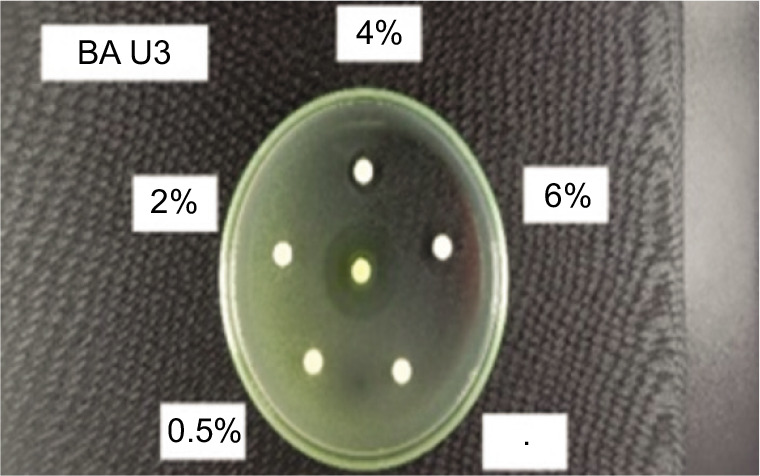
The antibacterial bioactivity assay against E. coli bacteria was conducted using the Kirby-Bauer diffusion method. This test uses a 6 mm paper disc, which is saturated with samples dissolved in DMSO, a negative control (DMSO), and a positive control in the form of an antibiotic (tetracycline). Tetracycline is used as the positive control because it is an antibiotic active against bacteria, inhibiting protein synthesis, and serves as a benchmark for determining the antibacterial activity of the extract by comparing the diameter of the inhibition zone formed. The negative control is used to determine whether the solvent affects the growth of E. coli, ensuring that any antibacterial activity observed is due to the test substance and not the solvent.
The previously saturated paper disc was placed on the surface of the agar medium (NA). Observation showed a clear zone formed around the paper disc, which is the bacterial inhibition zone. This clear zone indicates that the bacteria in that area did not grow or were killed.
According to Figure 2, the results of the ANOVA analysis and subsequent Tukey test showed that concentrations sharing at least one character were not significantly different (a, a: ab, ab: bc, bc: ab, bc, etc.) (p > 0.05), while concentrations with entirely different characters showed significant differences (a, bc: ab, cde: cde, gh, etc.) (p < 0.05). The highest inhibitory effect against E. coli bacteria was observed with MO4 extract (6%), with inhibitory power comparable to the positive control tetracycline (p > 0.05). Based on the MIC (Minimum Inhibitory Concentration), the lowest concentration required to inhibit bacterial growth was MO4 (2%) (Bharali et al., 2003; Bose et al., 2007; Zhu et al., 2022).
Figure 2
Average inhibition zone diameter (mm) (n = 3) of Moringa oleifera root methanolic extract (ME) against Escherichia coli bacteria.
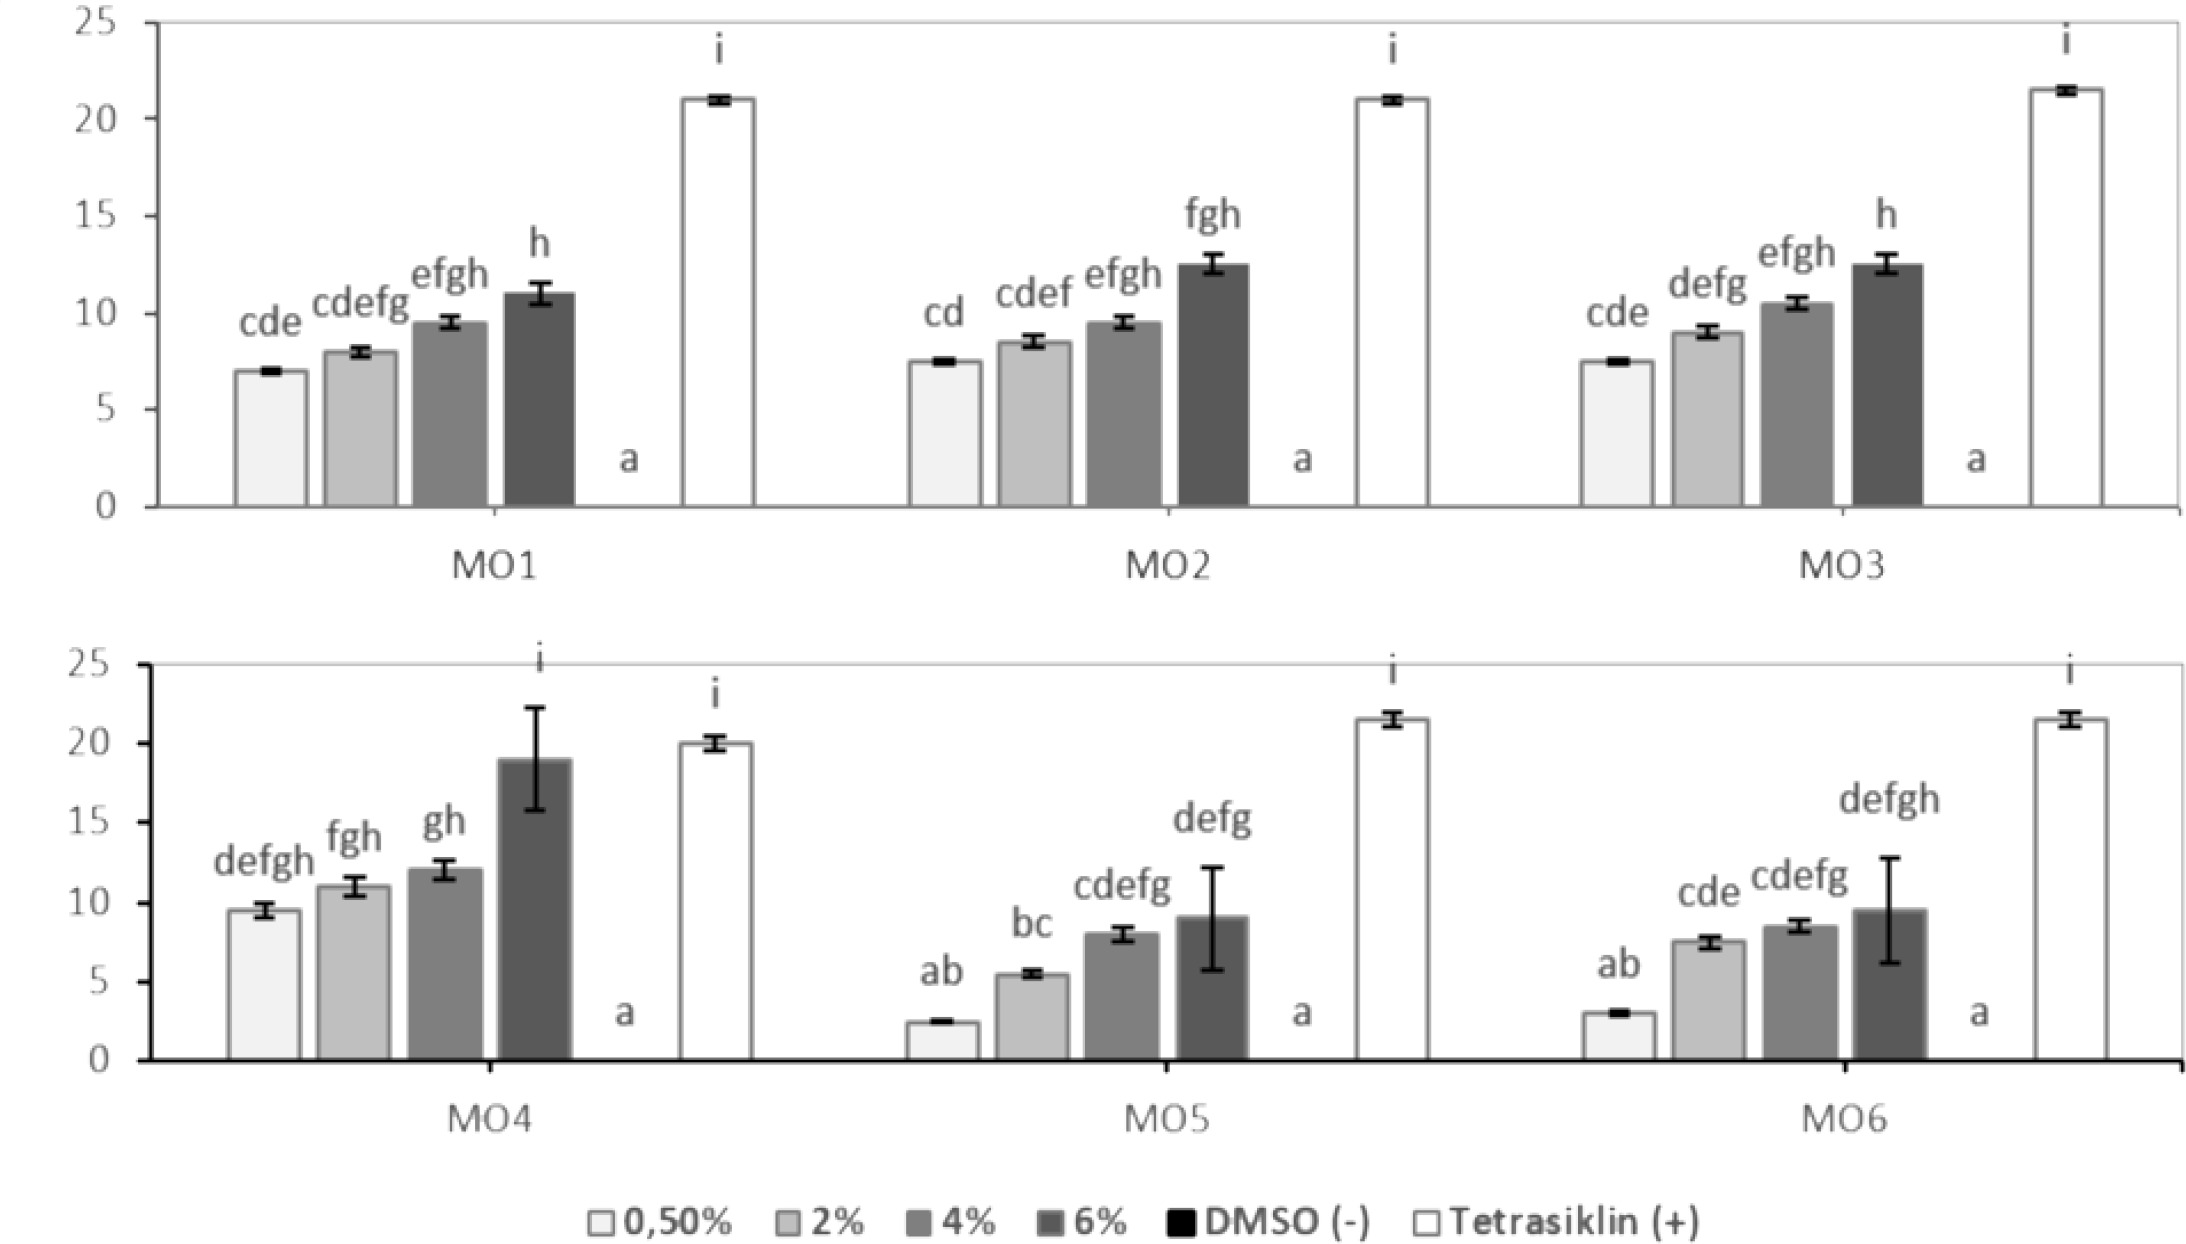
Based on several previous studies, it was reported that MO root ME inhibits the growth of E. coli bacteria with inhibition zones of 10–15 mm. In this study, excellent results were obtained, with a 19 mm inhibition zone and a MIC (Minimum Inhibitory Concentration) of 11 mm. This improvement is attributed to the addition of acid during the extraction process, which optimizes the extraction of substances with antibacterial properties (Adebayo et al., 2022; Grupa et al., 2022; Oleivera et al., 2022; Sari et al., 2022; Zhu et al., 2022). The storage for the anticholesterol test is based on the results of the best antibacterial test, as compounds with antibacterial properties—such as polyphenols/phenolics, flavonoids, terpenoids, and alkaloids—also possess antioxidant properties that can help reduce cholesterol levels in the blood (Li et al., 2016; Chen et al., 2015; Wu et al., 2021).
3.4. Anti-cholesterol Bioactivity Assay
ME of MO root that has the best antibacterial activity, which is continued to be tested in mice.
According to Figure 4, the results of ANOVA analysis and subsequent Tukey test showed that the average percentage of cholesterol level reduction with the same character (b) was not significantly different (p > 0.05), while different characters (a, b, c) were significantly different (p < 0.05) (Oliveira et al., 2022; Andini et al., 2023). Several studies have shown that Moringa root is able to lower total cholesterol levels and improve serum total cholesterol levels (Saleem et al., 2016; Kimi et al., 2019; Alhabeeb et al., 2023).
3.5. LCMS/MS Result
The extract with the best bioactivity was analyzed by Liquid Chromatography-Mass Spectrometry/Mass Spectrometry (LCMS/MS). Based on the compound analysis results from LCMS/MS, the methanol extract of Moringa oleifera L. root contained 21 compounds. The active compounds found in Moringa root extract have medicinal properties such as antibacterial, anti-inflammatory, antioxidant, and anticholesterol effects (Guevera et al., 1999; Husain et al., 2018; Lin et al., 2019).
Based on the results of LCMS/MS analysis (Figure 5), Moringa root extract contains compounds such as alkaloids (dibenzylurea, Aurantiamide acetate, and Isotriornicine), flavonoids (Apiin, Apigenin, Isoflavones, Kaempferol, Folinic acid, Rhamnetin, and Quercetin), polyphenol/phenolic compounds (Benzyl isothiocyanate, Benzyl Glucosinolate, Dicaffeoylquinic acid, ligustilide, and Eugenol), and terpenoids (Zeaxanthin), as well as other compounds including fatty acids (Palmitic Acid, Octadecadienoic acid, Elaidolinoleic acid), vitamin B3 (Niacin), and essential amino acids (Tryptophan) (Guevera et al., 1999; Husain et al., 2018; Lin et al., 2019).
Figure 5
Chromatogram showing the compound content analysis of Moringa oleifera root methanolic extract (MO4).
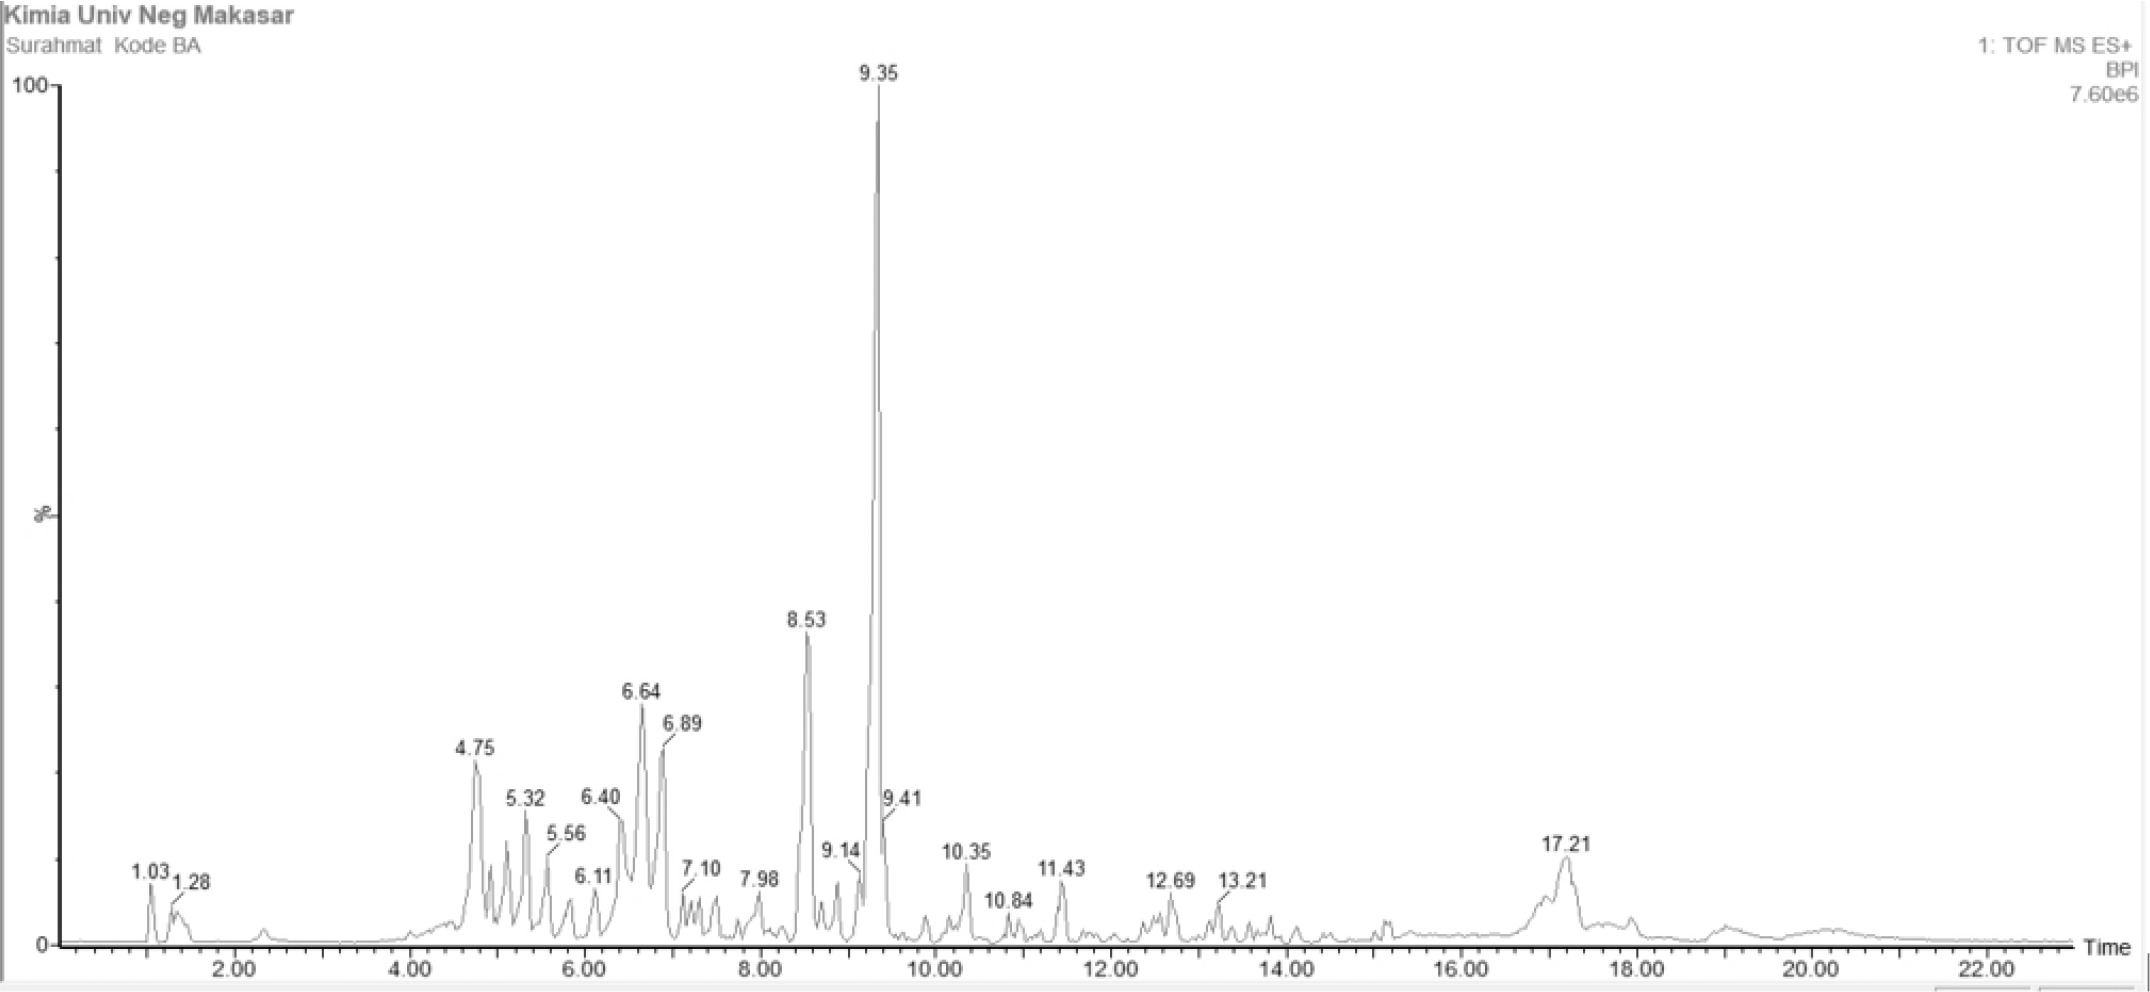
Table 2
Results of phytochemical screening.
Figure 5. Chromatogram showing the compound content analysis of Moringa oleifera root methanolic extract (MO4).
According to Figure 5, the results of compound analysis from Liquid Chromatography-Mass Spectrometry/Mass Spectrometry (LC-MS/MS) show that secondary metabolite compounds in Moringa root extracts extracted using 50% methanol solvent with the addition of 0.1% acid include alkaloid, flavonoid, and terpenoid compounds. This is evident from the structure of the compounds: alkaloids contain one or more nitrogen atoms usually incorporated in a cyclic system with basic properties; flavonoids have basic structures consisting of aromatic groups bound to one or more OH groups; and terpenoids are built from two or more isoprene units generally joined head-to-tail. Organic compounds classified as terpenoids follow the isoprene rule, which describes the structural regularity and includes two key aspects. Some compounds identified in Moringa root extract based on LC-MS/MS analysis include Niacin, Folinic acid, 1,3-Dicaffeoylquinic acid, 3-Butylidene-4,5,6,7-tetrahydro-6,7-dihydroxy-1(3H)-isobenzofuranone, Benzyl Glucosinolate, Palmitic Acid, 1,3-Dibenzyl urea, Isoflavones, Quercetin 3-O-(6’’-acetyl-glucoside), and Isotriornicine (Harbone et al., 1987; Arabshahi et al., 2007; Ahmed et al., 2015).
Conclusions
According to the research results obtained, it can be concluded that:
Methanol solvent concentration affects the yield of Moringa oleifera root extract, while acid affects antibacterial activity against E. coli bacteria.
Moringa oleifera Lam. root methanol extract exhibits biological activity as a potential anti-cholesterol agent.
Active compounds contained in the verified extract of Moringa oleifera L. roots include alkaloids, polyphenols, flavonoids, and terpenoids.