

1. Introduction
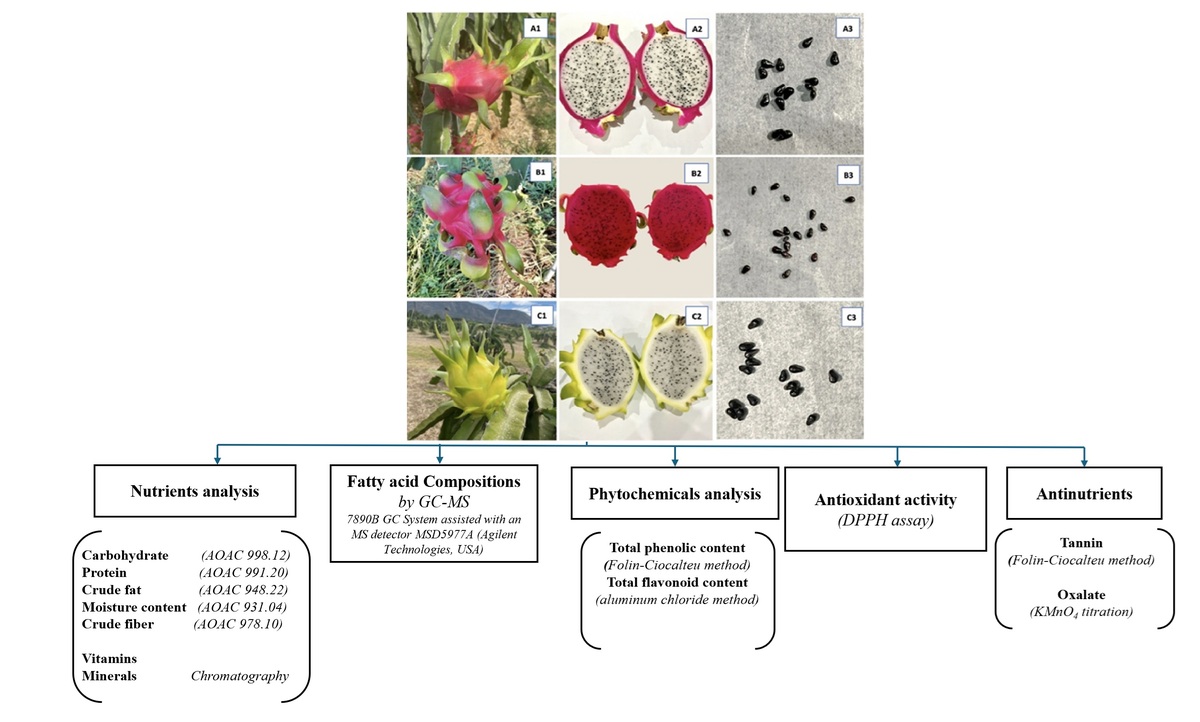
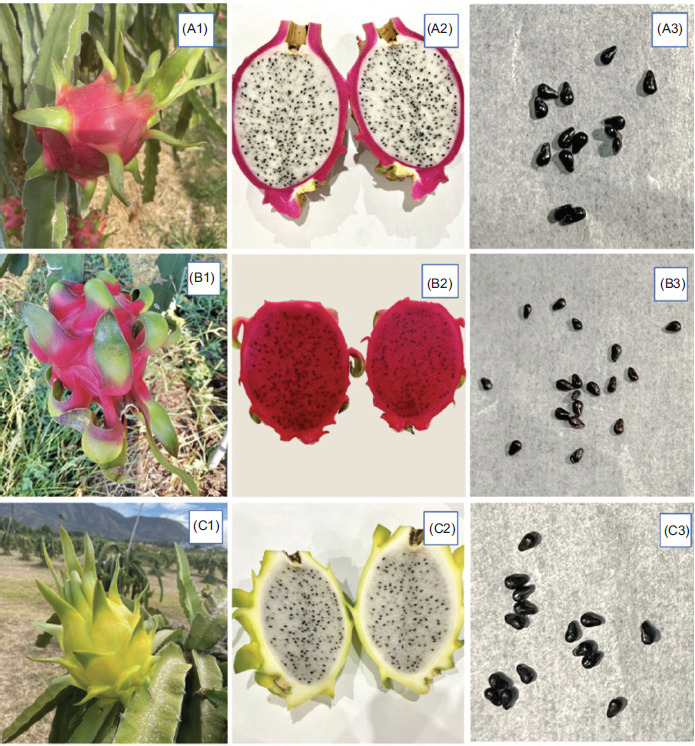
Dragon fruit (DF), also known as pitaya or pitahaya, is an edible fruit of the Hylocereus genus belonging to the Cactaceae (cactus) family. This herbaceous perennial climbing cactus, highly tolerant to drought, originally grew all over the tropical and subtropical regions of Central and South America, but is now widely cultivated commercially in many other countries, including Mexico, Colombia, the Philippines, Southern China, Taiwan, Thailand, Australia, and Vietnam (Abirami et al., 2021). DFs have a distinctive appearance with its bright pink or yellow skin and green scales (Rojas-Sandoval and Praciak, 2022). They come in three popular species with attractive colors: Hylocereus undatus (H. undatus) is a red- or pink-skinned fruit with white flesh (pink dragon fruit [PDF]), Hylocereus polyrhizus (H. polyrhizus) is a red-skinned fruit with red flesh (red dragon fruit [RDF]), and Hylocereus megalanthus (H. megalanthus) bears yellow-skinned fruit with white flesh (yellow dragon fruit [YDF]) (Figure 1). In Vietnam, DF is cultivated on a large scale (farms) in Binh Thuan (BT), commercially providing for domestic and international markets. BT (11°06′01″N 108°08′28″E), a coastal province of South Central Vietnam, typically features a tropical/equatorial monsoon climate. The province is best known as the driest region of the country, divided into two distinct seasons (dry and rainy), having no winter but sunshine and wind throughout the year.
Figure 1
Three different dragon fruit species: Hylocereus undatus (A1, A2, A3); Hylocereus polyrhizus (B1, B2, B3); Hylocereus megalanthus (C1, C2, C3).
Phytochemical analysis of DF revealed the presence of numerous health-implementing constituents such as polyphenols, flavonoids, and vitamin C, typically responsible for the antioxidant potential of DF (Mahattanatawee et al., 2006). Its flesh and its seeds have been reported to be composed of various fatty acids, particularly essential fatty acids (Luu et al., 2021). In recent years, there has been an increasing interest in the health benefits of DF. Studies have shown that this fruit may help lower blood sugar levels in people with type II diabetes; one study indicated that the consumption of DF by type II diabetics substantially reduces the levels of total cholesterol, triglycerides, and LDL (low-density lipoprotein) cholesterol while increasing the levels of HDL (high-density lipoprotein) cholesterol (Luu et al., 2021).
Note that the nutritional value of DF may be likely to vary depending on the species, botanical origin, and harvesting time (Wijitra Liaotrakoon, 2013). On the current market, the yellow-skinned, white-fleshed DF is always regarded as the most valuable one, being sold at a high price, approximately 10–15 times compared to other types of DF; the white-fleshed, pink-skinned DF, in contrast, is often sold at the lowest price. In addition, there is also a concern about the correlation between the nutrients and other phytochemicals present in DF seeds (DFS) and their biological activities. This study was thus conducted to comprehensively quantify the nutritional values and phytochemicals of the seeds from three different DF species grown in BT province, Vietnam.
2. Materials and Methods
2.1. Sample preparation
A stratified random sampling approach was managed to ensure representativeness across the DF production landscape in BT province (10°56′N 108°6′E). DFS was completely isolated from the flesh by mechanical force, and then the collected seed samples from each species were mixed together to create a composite sample and stored in vials for the nutrient analysis.
2.2. Proximate analysis
2.2.1. Total carbohydrate content
The total carbohydrate content of the DFS sample was determined using a phenol-sulfuric acid colorimetric assay (Nielsen, 2010). Briefly, 5 g of the DFS sample was extracted with 45 mL of 80% (volume per volume [v/v]) ethanol under gentle agitation for 15 minutes. The resulting suspension was transferred to a 50 mL volumetric flask and brought to volume with 80% (v/v) ethanol. The mixture was subsequently filtered, and 10 mL of the filtrate was retained for analysis. For the colorimetric assay, 1 mL of the diluted filtrate was combined with 1 mL of 5% (weight per volume [w/v]) phenol solution and 5 mL of concentrated sulfuric acid. The reaction mixture was incubated in a water bath for 10 minutes, followed by a 5-minute cooling period at room temperature. The absorbance of the resulting colored complex was measured spectrophotometrically at 490 nm against a reagent blank. Total carbohydrate content was quantified using a glucose standard curve and expressed as milligrams of glucose equivalents per gram of dry sample (mg GE/g) and as a percentage of the sample’s dry weight.
2.2.2. Total protein content
The determination of the protein content of DFS samples was carried out using the Kjeldahl method (Association of Official Analytical Chemists [AOAC] 2001.11, 2005; AOAC 991.20, 2005) and a Kjeldahl digestion and titration procedure was implemented. A 1 g of the sample was subjected to acid digestion within a Kjeldahl flask, utilizing 10 mL of concentrated sulfuric acid and 1 g of a catalyst mixture. This catalyst was formulated from potassium sulfate and copper sulfate in a 9:1 mass ratio. The digestion process was carried out under heat until a clear solution was achieved. The resulting digestate was then diluted to a final volume of 100 mL using deionized water in a volumetric flask. Subsequently, the diluted digestate was subjected to steam distillation following an addition of 25 mL of 45% sodium hydroxide solution to the distillation apparatus, which continued until 100 mL of distillate was collected in a conical flask containing 10 mL of 4% boric acid solution along with a few drops of bromocresol green indicator. The nitrogen content was determined by titrating the distillate with 0.1N (normality) hydrochloric acid until a pink endpoint was observed. The protein content of the sample was then calculated as a percentage, utilizing a standard nitrogen-to-protein conversion factor of 6.25.
2.2.3. Fat content
The fat content of the samples was determined using the Soxhlet method (AOAC 948.22, 2012). One gram aliquot of the sample was precisely measured and transferred into a cellulose thimble suitable for Soxhlet extraction. This thimble was subsequently installed within the Soxhlet apparatus, and 50 mL of hexane was introduced as the extraction solvent. The system was then activated, initiating a continuous reflux of the solvent through the sample material. After a duration of approximately 6 hours, ensuring comprehensive lipid removal, the heating element was deactivated and the solvent was permitted to cool to ambient temperature. The collection flask containing the extracted lipids was then removed from the apparatus. To eliminate residual moisture, the flask was subjected to a drying process, followed by cooling in a desiccator, prior to a final gravimetric analysis.
2.2.4. Dietary fiber content
The crude fiber content of DFS was determined using the Weeden method (AOAC 978.10, 2000). A 2 g sample was introduced into a conical vessel containing 200 mL of 0.128M (morality) sulfuric acid. This mixture underwent a 30-minute incubation period, during which intermittent agitation was employed to ensure a thorough interaction. Subsequently, the liquid phase was separated via filtration and rinsed with heated water to eliminate residual acidity. The collected filtrate was then subjected to a boiling phase, followed by a second wash using 200 mL of 0.313M sodium hydroxide in a separate vessel. The resulting precipitate was isolated and transferred to a preconditioned, dry crucible and excess moisture was removed by evaporation on a heated surface. The crucible and its contents were then dried in an oven at 105°C for 2 hours, followed by a 20-minute cooling period within a desiccator. The mass of the crucible and fiber residue was recorded as W1. The crucible assembly was subsequently placed within a muffle furnace and subjected to a 500°C heat treatment for 2 hours. After a 20-minute cooling period in a desiccator, the crucible containing the residual ash was reweighed; this mass was designated as W2. The crude fiber content was then computed using a designated formula and expressed as a percentage of the initial sample mass:
2.2.5. Moisture content
The moisture content of the DFS sample was quantified using the gravimetric method (AOAC 931.04, 2000). A 1 g aliquot was dried to constant weight in a glass petri dish at 105°C for 3 hours, with subsequent cooling in a desiccator prior to final weighing. Moisture content was calculated as a percentage of the initial sample weight.
2.2.6. Energy content
The energy contents of all DFS varieties were determined by summing up the amount of proteins, fats, and carbohydrates in DFS with different factors (Islam et al., 2023). The value was calculated by the following equation:
Energy = (Protein × 4.1) + (Fat × 9.3) + (Carbohydrate × 4.1)
2.3. Fatty acid compositions
A 0.5 g of DFS sample was extracted with 0.5 mL of hexane using 2 mL of 1% methanol-potassium hydroxide as a catalyst. The extraction was assisted by an ultrasonic bath at 80°C for 60 minutes. Later, 1 mL hexane was added and evaporated under a nitrogen stream. The residue was dissolved in 1 mL of hexane (Knothe and Van Gerpen, 2010).
The fatty acid compositions were identified and determined by gas chromatography-mass spectrophotometer (GC-MS) (Sienkiewicz et al., 2020) using the 7890B GC System assisted with an MS detector MSD5977A (Agilent Technologies Inc., Santa Clara, CA, USA) (Son L. Hoang and Nhi H.M. Nguyen, 2023). A 1 µL of the dissolved residue was injected via an Agilent 7683 Injector with a split ratio of 30:1, where the injector and transfer line temperatures were set at 260°C. Helium was used as carrier gas with a constant pressure of 100 kPa with capillary column HP-88 (100 m × 0.25 mm, 0.20 µm) at a constant flow rate of 1.0 mL/minute. The GC temperature program was set at 140°C for 5 minutes and increased to 240°C at a rate of 4°C/minute where it was held for 9 minutes. Fragmentation was carried out by electron impact under a field of 70 eV (electron volts). Retention times from full scan measurement (mass-to-charge ratio [m/z] 60–400) were used for qualitative analysis. For GC-MS in the single ion monitoring mode, fragment ions were recorded throughout the run.
2.4. Vitamin contents
The vitamin contents of the samples were analyzed primarily based on various AOAC methods. Vitamin A, E, C and group B vitamins, including B1, B2, B3, B6, and B12, were determined by the high-performance liquid chromatography (HPLC) method by Thermo Scientific Ultimate (Thermo Scientific Inc., Waltham, MA, USA) 3000 HPLC System (Vries et al., 1979; AOAC 2001.13, 2011; European Standard, EN 14122-2003, 2003; Hossain et al., 2019; AOAC 961.14, 1989; Mann et al., 2005; AOAC 2011.10, 2011; AOAC 2012.21, 2013). Vitamins B5 and B9 were evaluated by the ultra-performance liquid chromatography in the tandem mass spectrometer (QTRA5500) (Andrieux et al., 2013; AOAC 2011.06, 2011). The vitamin contents were expressed in mg/100 g of the sample.
2.5. Mineral contents
The determination of mineral contents in the samples was conducted by AOAC standard methods. The content of sodium (Na) and potassium (K) were determined by the flame photometer FP910 (AOAC 969.23, 2005); calcium (Ca), magnesium (Mg), zinc (Zn), copper (Cu), and iron (Fe) were analyzed by the atomic absorption spectrophotometer (Infitek SP-IAA4530) (AOAC 968.08, 2000); manganese (Mn) and selenium (Se) were assessed by the inductively coupled plasma mass spectrometry (ICP-MS) method (AOAC 2015.01, 2015; Nelson et al., 2019) by ICP-MS Agilent model 7500cx; phosphorus (P) was quantified by the spectrophotometric method (AOAC 995.11, 2000); chlorine (Cl) analysis was conducted by the Volhard method (Nordtest method, 1996), and the vitamin contents were determined primarily based on different AOAC methods.
2.6. Antinutrient contents
2.6.1. Tannins
The total tannin content of the DFS sample was determined using the Folin-Ciocalteu colorimetric assay (Hoang and Le, 2024), with tannic acid serving as the calibration standard. Briefly, 0.1 mL of the sample was combined with 500 µL of Folin-Ciocalteu reagent and 1 mL of a 35% (w/v) sodium carbonate solution. The volume was then adjusted to 10 mL with deionized water. The resulting mixture was vortexed for 5 minutes and then incubated in the dark at ambient temperature for 30 minutes. The absorbance of the reaction product was measured spectrophotometrically at 725 nm against a reagent blank. The tannin content was quantified using the tannic acid calibration curve and expressed as milligrams of tannic acid equivalents per gram of sample (mg TAE/g).
2.6.2. Oxalates
The oxalate content was determined using a titration method (Hoang and Le, 2024). Acid hydrolysis was conducted in a 0.25 g DFS sample mixture of water (50 mL) and concentrated sulfuric acid (5 mL) at 80°C. Following filtration, the filtrate was titrated with 0.1N standardized KMnO4 (standardized against 0.1N oxalic acid) to a persistent pale pink endpoint at least for 30 seconds.
2.7. Phytochemical compounds
2.7.1. Total phenolic content
The total phenolic content (TPC) was measured using the Folin-Ciocalteu method (Siddiqui et al., 2017) and gallic acid was used as a standard for the calibration curve. The assay was prepared by mixing 36 µL of sample and 300 µL of Folin-Ciocalteu reagent (diluted 10 times) and then vortexed for 5 minutes before adding 300 µL of saturated Na2CO3 (soda ash or washing soda). The mixture was kept in the dark for 30 minutes at room temperature. The absorbance of the sample was measured against the blank at 725 nm using a spectrophotometer connected with BioTek Synergy HT 96-well plate. TPC was expressed in terms of GAE per gram (mg GAE/g) of sample.
2.7.2. Total flavonoid content
The total flavonoid content (TFC) was determined using the aluminum chloride method (El Ghouizi et al., 2023) and quercetin was used to calibrate the standard curve. The assay was prepared by mixing 100 µL of sample with 150 µL of 5% sodium nitrite (NaNO2), followed by adding 150 µL of 10% aluminum trichloride or aluminum chloride (AlCl3). The mixture was then vortexed for 5 minutes prior to adding 200 µL of 1% sodium hydroxide (NaOH). The mixture was then kept in the dark for 1 hour at room temperature. The absorbance of the mixture was measured against the blank at 510 nm using a spectrophotometer connected with BioTek Synergy HT 96-well plate. TFC was expressed as quercetin equivalent (QE) per gram of sample (mg QE/g of sample).
2.7.3. DPPH free-radical scavenging assay
The antioxidant activity of the DFS sample was assessed by 2,2-diphenyl-1-picrylhydrazyl (DPPH) assay (Hoang and Le, 2024), where ascorbic acid was used as the standard reference. The assay was prepared by mixing 80 µL of sample with 720 µL of DPPH 0.1 mM and then shaken vigorously. The mixture was incubated for 30 minutes in the dark at room temperature. The absorbance of the mixture was measured against the blank at 517 nm using a spectrophotometer connected with BioTek Synergy HT 96-well plate.
3. Results and Discussion
3.1. Essential nutrients
In general, all the seeds from the three studied DF species were recorded with moderate energy-yielding nutrients in Table 1. The fat content of PDF (15.176 ± 0.781 g/100g) and YDF (15.576 ± 0.966 g/100g) was observed to be relatively similar. Notably, the fat content of RDF was significantly high at 20.160 ± 0.979 g/100g, aligning with the benchmark results reported by Boyapati et al. (2023) in India, which indicated 24.20 ± 0.73%. Remarkably, the seeds from the RDF were superior to other species of the DFS, claiming the highest values in all energy-producing nutrients and dietary fiber. RDF seeds thus resulted in correspondingly higher energy, approximately three times as much as that of PDF or YDF, thereby providing well-informed choices for planning a daily diet, particularly for diabetics and controlling body weight.
Table 1
Essential nutrient contents of the seeds from three different dragon fruit species.
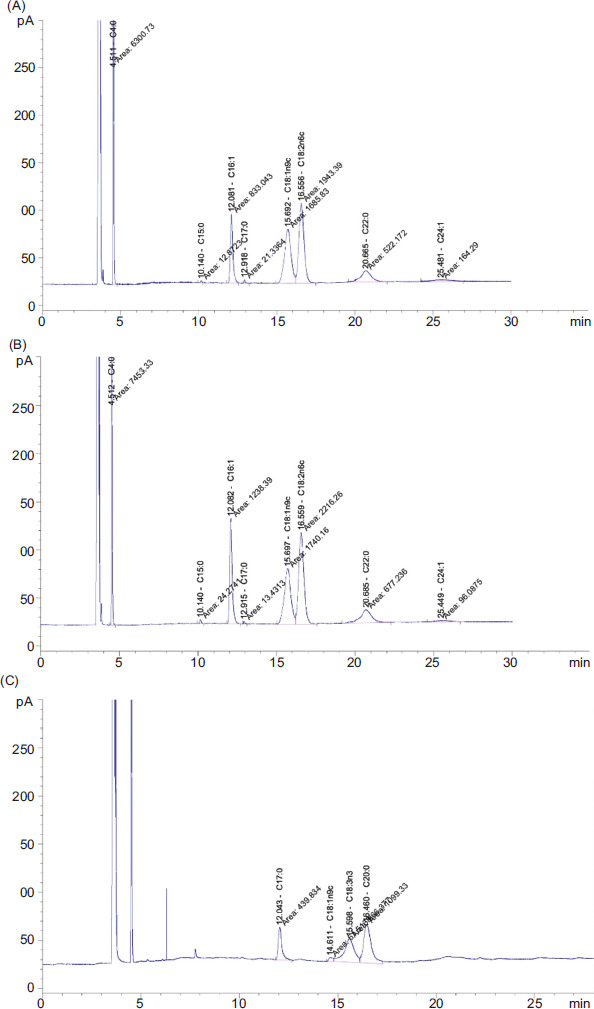
3.2. Fatty acid compositions
Perhaps the most valuable nutrients present in DFS are essential fatty acids (Table 2 and Figure 2). Totally, 100 g of RDF possessed 8.18 mg of saturated fat which was 3 times as much as that of YDF and approximately 12 times greater than that of PDF. In contrast, PDF exerted the highest content of both total monounsaturated and polyunsaturated fatty acids (1.2% and 2.23%, respectively). A variety of fatty acids were recorded in PDF, including omega 6 and 9, stearic, palmitic, oleic, and linoleic acids, but not omega 3. On the contrary, omega 3 was detected in RDF and YDF with low concentrations of 0.9% and 0.51%, respectively.
Table 2
Fatty acid compositions by GC-MS in seeds from three different dragon fruit species.
Figure 2
Geographic map: (A) Geographic region of Binh Thuan province as highlighted; (B) Different districts of Binh Thuan province to be selected for sampling.
The benefits of monounsaturated and polyunsaturated fatty acids to human health are well documented. For instance, these acids are known to help reduce low-density and very low-density lipoprotein fractions associated with increased serum cholesterol (Beynen and Katan, 1985; Jenkins et al., 2002). In addition, linoleic and alpha-linolenic acids are necessary to maintain cell membranes, brain functions, and the transmission of nerve impulses under normal conditions (Glick and Fischer, 2013; Jerónimo-Santos et al., 2015). Linoleic acid, a polyunsaturated fatty acid, is important for the human health and in countering the increase in cholesterol levels due to the negative effects of saturated fatty acids (Chemah, et al., 2010). DFS contain lauric, myristic, and palmitic acids believed to be cholesterol-raising agents; however, raising these saturated fatty acids will lead to the raising of plasma levels of the protective HDL which can act as a buffer to counteract the cholesterol. A dietary linoleic acid level of 3–7% kcal is recommended for the Malaysian population (National Coordinating Committee on Food and Nutrition, n.d.). The seeds of DFs may reduce triglycerides and lower the risk of cardiovascular disorders (Sonawane, 2017), indicating that people with cardiovascular disorders are recommended to consume H. undatus instead of the two other types of DFS (Rathi et al., 2023).
3.3. Vitamin and mineral contents
Vitamins are organic substances contained in food—water-soluble and fat-soluble. Table 3 summarizes the quantities of nine types of water-soluble vitamins, including B1, B2, B3, B5, B6, B7, B9, B12, vitamin C, and fat-soluble vitamins A, D, E, and K.
Table 3
Vitamin contents in the seeds from three different dragon fruit species.
In general, all seeds from the three different DF species are not rich in both fat- and water-soluble vitamins. The analysis revealed the presence of vitamins D3 and E, but not vitamins A and K1, and confirmed the presence of vitamins B1, B3, and B5, but not B2, B6, B9, and B12. Vitamin C was only detected in RDFS with low values of 0.340 ± 0.006 mg/100 g.
Moreover, not all minerals studied were detected as the report revealed the void of I, Ni, Co, Cr, and Cu (Table 3). Meanwhile, Mn was merely detected in PDF and YDF seeds with the same amounts of 0.4 mg/100 g. There were significant differences in macromineral contents as PDF was predominant in P (105.00 ± 1.00 mg/100 g), whereas YDF was recorded with the highest K (116.00 ± 1.00 mg/100 g). In contrast, RDF claimed the highest values of Ca, Na, and Mg (11.37 ± 0.29; 2.77 ± 0.00; 105.00 ± 0.58 mg/100 g, respectively). Remarkably, RDF was noted with the highest values of Fe and Zn (3.63 ± 0.02 and 1.87 ± 0.01 mg/100 g), but an extremely low concentration of Cl, which was approximately one-tenth as much as that of PDF and YDF. There were no significant differences in sulfur content among the seeds from the three DF species.
3.4. Phytochemicals
All three studied DFS generally possessed moderate values of phenolic and flavonoid contents (Table 4). RDF had the highest TPC and TFC (25.06 ± 0.219 mg GAE/g and 58.15 ± 3.065 mg QE/g, respectively), whereas PDF contained the lowest values (16.56 ± 1.822 mg GAE/g and 33.42 ± 5.618 mg QE/g, respectively), indicating the significant differences in TPC and TFC among the seeds from three DF species. However, RDF illustrated strong DPPH free radical scavenging activity with an IC50 (half-maximal inhibitory concentration) value of 138.5 ± 1.719 µg/mL, apparently reflecting the correlation between TPC and TFC with antioxidant activity. Nonetheless, the antioxidant property of these samples was apparently not effective compared to the IC50 of ascorbic acid, which was 2.69 ug/mL from the calibration curve y = 16.943x + 6.5073 (R2 = 0.9917).
Table 4
Phytochemical and antioxidant activities of the seeds from three different dragon fruit species.
3.5. Antinutrient contents
In general, the seeds from the three DF samples contained low concentrations of oxalates while tannins were insignificantly detected. Oxalate content in DF seeds varied significantly among the three varieties tested (ρ = 0.000004). The oxalate results showed H. polyrhizus seeds contained the highest concentration at 0.53 ± 0.01 mg/100g, followed by H. megalanthus and H. undatus at 0.35 ± 0.03 and 0.29 ± 0.01 mg/100g, respectively. Oxalates have been a concern in the human diet in terms of antinutrients, restricting the bioavailability of some nutrients by binding to minerals, such as calcium, magnesium, or iron, reducing their absorption and leading to the redundancy of these minerals. The American Academy of Nutrition and Dietetics recommends limiting the dietary intake of oxalates to under 50 mg per day in patients with kidney stones (Bernardino and Parmar, 2017). The oxalate values obtained in the seeds from three DF species were generally safe for daily consumption.
4. Conclusion
In conclusion, all three DFS were generally not potential sources of energy-yielding nutrients (carbohydrates, fat, and protein) as well as nonenergy nutrients (vitamins and minerals). Nevertheless, the most valuable nutrients were essential fatty acid contents with significant differences among the seeds from the three DF species. The contents of tannins and oxalates were not significant and thus generally considered safe for daily consumption. These findings provide well-informed options for nutritionists/dietitians, food manufacturers, and consumers.
This study offers a preliminary understanding of the nutritional variability and phytochemical diversity within the seeds of the three specific DF varieties cultivated in Vietnam. The data, encompassing essential nutrients, phytochemical profiles, antioxidant capacity, and antinutrient content, provides a scientific foundation for dietary recommendations relevant to nutritionists, food manufacturers, and consumers. A key limitation is the focus on only three varieties within Vietnam. Future studies should broaden the geographical scope, investigate nutrient bioavailability, evaluate potential health benefits, and explore the development of novel food products. Furthermore, these studies should account for the influence of diverse geographic and environmental conditions on seed composition.
ACKNOWLEDGMENTS
The authors are grateful to the authorities at the Department of Applied Biochemistry, Faculty of Biotechnology, International University, National University, Ho Chi Minh City, Vietnam for providing the facilities to conduct this study.
AUTHOR CONTRIBUTIONS
Research concept and design: S.L.H.; Collection and/or assembly of data: T.N-K.L., T.N.K.N.; Data analysis and interpretation: S.L.H., T.N.K.N.; Writing the article: S.L.H., T.N.K.L.; Critical revision of the article: S.L.H., T.N.K.L; Final approval of the article: T.N-K.L., S.L.H., T.N.K.N.