

1. INTRODUCTION
Papaya is a fruit that belongs to the Caricaceae family. Its production areas include tropical and subtropical countries, including Indonesia (Medina et al., 2003). The composition percentage of a single papaya fruit consists of seeds (5.4%), peel (25.3%), and flesh (69.3%) (Medina et al., 2003). Papaya contains a relatively high amount of soluble fiber, 1.7 g per 100 g of raw fruit (U.S. Department of Agriculture, 2018).
Papaya is widely used in the production of food products such as jams and jellies (Pathak et al., 2019). However, the by-product of these processes—papaya peel—is often unused (Pathak et al., 2019). The nutritional value contained in papaya peel includes carbohydrates (89.9 g), ash content (10.6 g), protein (15.8 g), and fat (1.46 g) per 100 g of dry weight (Oliveria et al., 2021). Another study reported the nutritional composition of ripe papaya peel as follows: protein (3.5%), fiber (26.2%), fat (3.05%), ash (15.03%), and carbohydrates (52.2%) (Akintunde et al., 2022).
Nata is a water-insoluble, gel-like substance formed on the surface of the fermentation medium in the form of cellulose produced by Acetobacter xylinum (Tallei et al., 2022). Nata contains high amounts of insoluble fiber (Tallei et al., 2022). Nata products have significant potential due to their benefits, popularity, and high economic value (Harmoko & Lokaria, 2022). Therefore, producing nata from fruit-based fermentation media can benefit health, particularly for individuals with diabetes mellitus.
Diabetes mellitus remains a prevalent condition both globally and in Indonesia. The International Diabetes Federation reported a global diabetes prevalence of 536.6 million people (10.5%) aged 20–79 in 2021, projected to increase to 783.2 million (12.2%) by 2045 (International Diabetes Federation, 2021). In Indonesia, in 2021, the diabetes prevalence reached 19.5 million (10.8%), and it is expected to rise to 28.6 million (15.8%) by 2045 (International Diabetes Federation, 2021). Research suggests that adequate dietary fiber intake can prevent and manage metabolic diseases such as diabetes mellitus (He et al., 2022). According to WHO recommendations, a daily fiber intake of 27–40 g/day may help prevent obesity, diabetes, cardiovascular diseases, and various cancers (Nishida et al., 2004). Another study also states that the recommended dietary fiber intake for diabetes management is 35–40 g daily (Mogos et al., 2017).
Insoluble fiber has been found to help prevent obesity and diabetes (Okouchi et al., 2019). Soluble fiber is known to inhibit the absorption of glucose and fats from the digestive tract and reduces blood glucose and lipid levels (Galisteo et al., 2008). The mechanism by which fiber prevents worsening hyperglycemia involves its fermentation in the colon by gut microbiota, producing short-chain fatty acids (SCFAs), which in turn influence glucose and lipid metabolism (Grover et al., 2010). Dietary fiber is fermented by gut microbiota to produce SCFAs, which then stimulate the secretion of satiety hormones (GLP-1 and PYY). These hormones help enhance insulin secretion and regulate blood glucose levels (He et al., 2022). One of the gut microbiotas involved in glucose regulation is Lactobacillus gasseri, which is known to have antidiabetic effects (Adeshirlarijaney & Gewirtz, 2020).
In addition to its high fiber content, papaya also contains high levels of antioxidants. The antioxidant-active parts of the papaya plant (Carica papaya L.) include the fruit, peel, and leaves. Among all parts of the papaya plant, the ethanol extract of the peel has the highest antioxidant activity, with an IC50 value of 13.769 µg/mL (Santi et al., 2021).
People with diabetes mellitus are particularly vulnerable to free radical formation in the body (Widowati, 2008). Hyperglycemia exacerbates the formation of reactive oxygen species (ROS) through various mechanisms (Widowati, 2008). Antioxidants protect cells from damage caused by reactive oxygen free radicals. The body needs antioxidants to slow or prevent oxidation (Fachraniah & dan Novilasi, 2012).
Numerous studies have discussed the effects of papaya consumption on blood glucose regulation. A study involving papaya consumption for 6 weeks showed reduced blood glucose levels (Santoso, 2011). Another study found that consuming 20 g of papaya effectively reduced fasting blood glucose (FBG) and insulin resistance, demonstrating its efficacy as a glycemic control agent (Yu et al., 2014). However, no research has been conducted using nata made from papaya peels. Therefore, this study aims to develop an innovative product like nata made from papaya peel to enhance its value. Subsequently, its effects on blood glucose levels and gut microbiota in male rats with type 2 diabetes mellitus were evaluated.
2. MATERIALS AND METHODS
2.1. Animals
Twenty male Wistar rats, aged 6–8 weeks and weighing 180–200 g, were obtained from Hasanuddin University’s animal facility. They were acclimated for 7 days in cages maintained at 28–32 °C, with a standard diet (5–10 g daily) and unrestricted access to water. The cages were cleaned three times daily.
2.2. Ethical approval
Ethical approval was obtained from the Health Research Ethics Committee of the State University Hospital, Hasanuddin University (RSPTN UH), from Dr. Wahidin Sudirohusodo Hospital, Makassar, with Approval Number 563/UN4.6.4.5.31/PP36/2024 and protocol number UH24060453.
2.3. Induction of diabetes
The rats were fasted overnight and then given a single intraperitoneal injection of 40 mg/kg streptozotocin (STZ) in 0.1 M citrate buffer (pH 4.5). A 10% sucrose solution was provided orally for 24 h post-injection to prevent hypoglycemic shock (Fajarwati et al., 2023).
2.4. Experimental design
The study used a Completely Randomized Design (CRD) with four groups of five Wistar rats each, selected based on inclusion and exclusion criteria. The negative control (NC) received 2 mL of distilled water, while PPN1, PPN2, and PPN3 were given 0.5, 0.6, and 0.7 g of papaya peel nata (PPN), respectively. Treatment was administered orally once daily for 4 weeks.
2.5. Determination of treatment doses
Papaya peel nata doses were based on WHO’s recommended daily fiber intake (27–40 g) and a study suggesting 35–40 g for diabetics (Mogos et al., 2017; Nishida et al., 2004). Using a 0.018 conversion factor for rats, doses were set at 0.5, 0.6, and 0.7 g (Laurence & Bacharach, 1964).
2.6. Papaya peel nata preparation
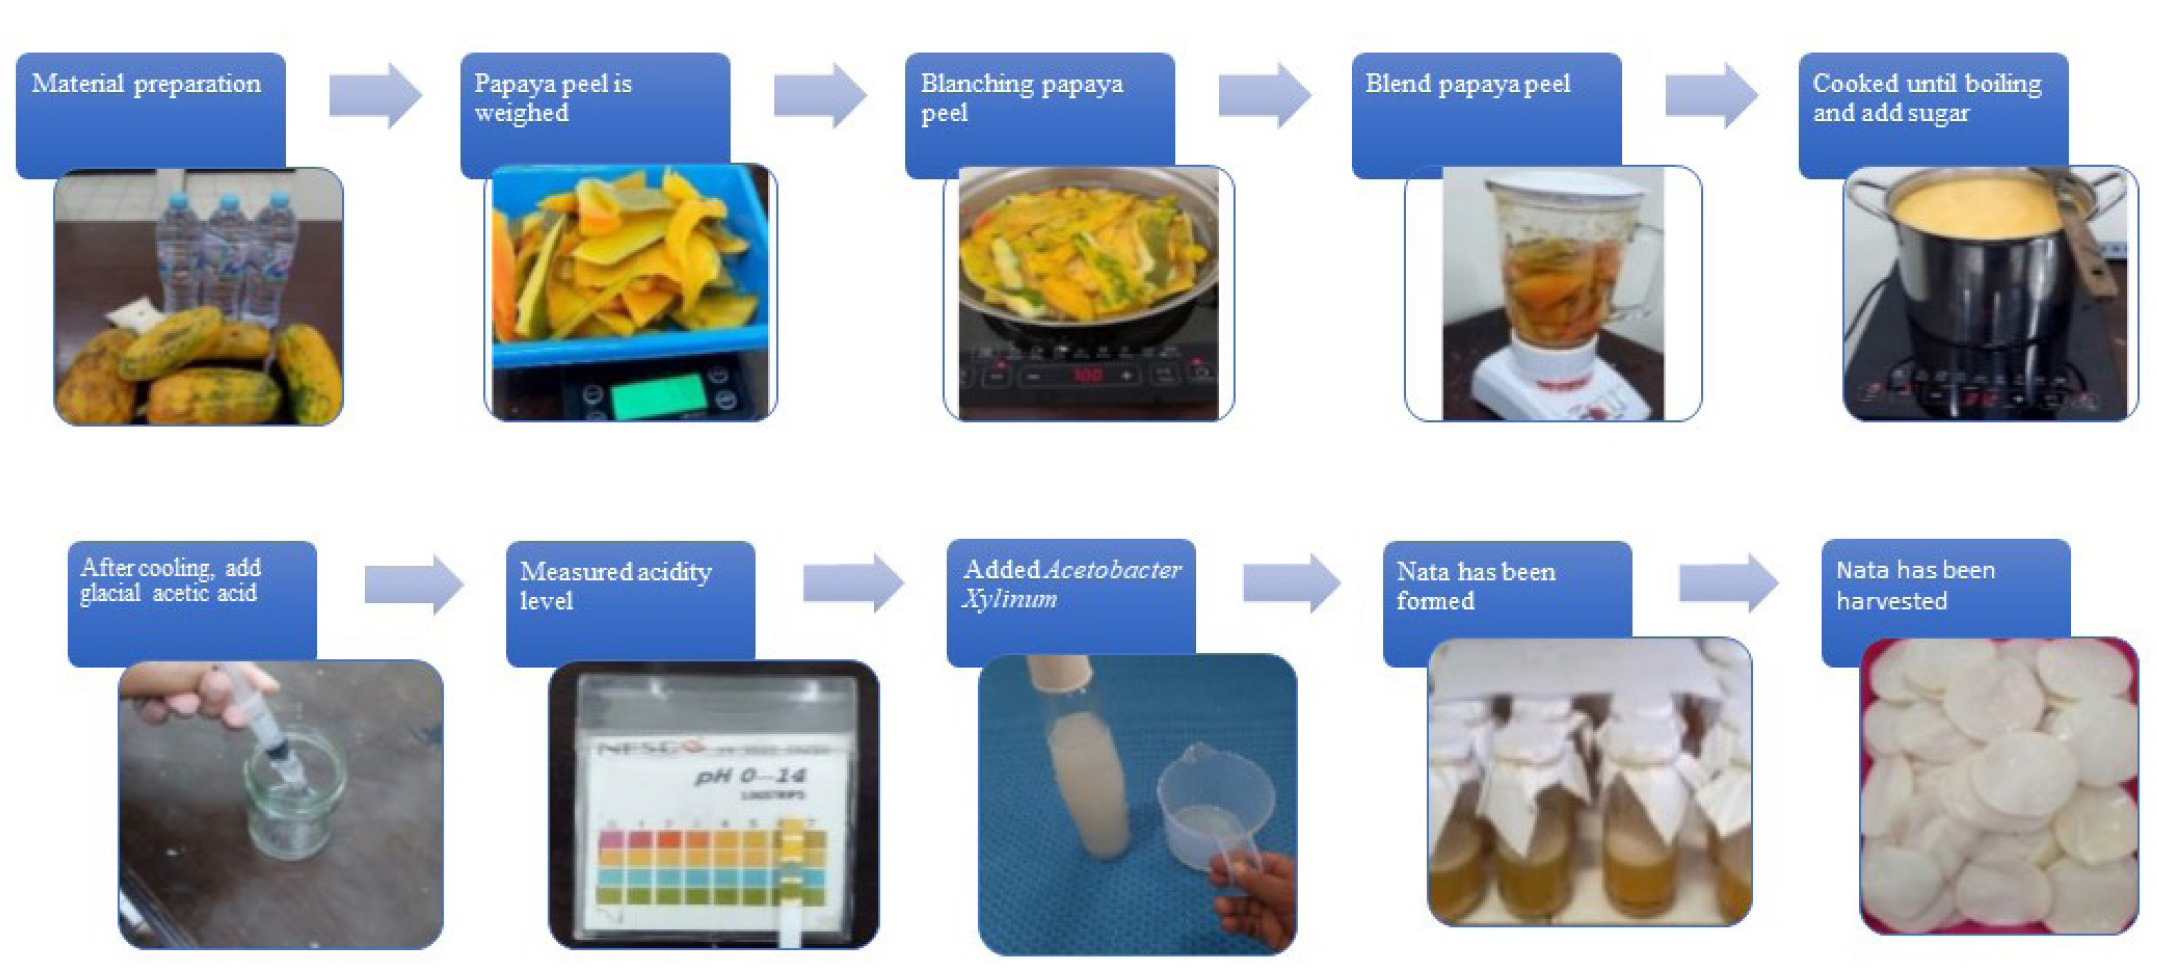
The papaya fruits used in this study were obtained from Tidung Market, Rappocini District, Makassar City, and identified as Carica papaya L. at the Pharmacognosy Laboratory, Faculty of Pharmacy, Hasanuddin University, number 036/SKIT/Pharmacognosy/XI/2024. The papaya peel was cleaned, blanched for 15 min, rinsed, and blended with 1 L of water. The extract was filtered and mixed with 30 g of sugar and 7 g of ammonium sulfate. After boiling, the pH was adjusted to 4 with acetic acid, and the mixture was poured into sterilized bottles. A 20 mL starter culture of A. xylinum was added, and the bottles were incubated for 7 days. After fermentation, the nata was harvested, washed, blended, and given to the rats.
2.7. Determination of fiber content of papaya peel nata
The fiber content was analyzed by extracting 4 g PPN sample using acidic and alkaline solutions to isolate crude fiber. Fat was removed through stirring and settling, followed by three solvent treatments. The sample was boiled with 1.25% H2SO4 and 3.25% NaOH for 30 min each and filtered using ashless filter paper. The residue was washed, dried at 105 oC, and weighed until a constant weight was achieved (Rohmah et al., 2022).
2.8. Determination of antioxidant capacity of papaya peel nata
The antioxidant capacity of PPN was assessed using the DPPH assay with vitamin C as the standard. 0.2 g sample was mixed with 3.8 mL of 70% methanol, homogenized, and combined with DPPH solution. The mixture was vortexed and incubated in dark for 30 min, after which absorbance was measured at 515 nm using a UV-VIS spectrophotometer (Darmayanti et al., 2023).
2.9. Measurement of fasting blood glucose
Fasting blood glucose (FBG) levels were measured three times: before STZ induction, 3 days after, and at the end of Week 4. Rats were fasted for 16 h before each measurement, and blood samples were collected from the tail vein (Firdaus et al., 2016). Glucose levels were analyzed using a glucoDR Biosensor glucometer. Rats were considered diabetic if their FBG levels were ≥150 mg/dL (Fajarwati et al., 2023).
2.10. Measurement of Hemoglobin A1c
Hemoglobin A1c (HbA1c) levels were measured after 4 weeks of treatment (An et al., 2023), following blood collection via the retro-orbital plexus. Samples were processed with EDTA, centrifuged, and stored at −80 °C. HbA1c was analyzed using the ELISA method with a Rat Hemoglobin A1C kit from BT LAB.
2.11. Analysis of L. gasseri gut microbiota with RT-PCR
Gut microbiota analysis was conducted on fecal samples collected at the end of the fourth week to identify L. gasseri (An et al. 2023). DNA was extracted using the PrestoTM Stool DNA Extraction Kit. For bacterial detection, real-time PCR was performed with primers planF (5’-TGG AAA CAG TGC TMT ACC G-3’) and pREV (5’-CAG TTA CTA CCT CTA TCT TTC TTC ACT AC-3’). PCR mixtures included Sensifast Sybr No-Rox Mix, primers, and DNA samples. Negative and positive controls were also prepared. The PCR cycle involved initial activation at 95 °C for 10 min, followed by denaturation, annealing, and extension steps for 40 cycles.
2.12. Measurement of body weight, body length, and Lee index
The rats’ body weight and length were measured weekly using a digital scale and measuring tape. Obesity status was evaluated using the Lee index formula (Novelli et al., 2007).
2.13. Monitoring of rats’ health status
Weekly monitoring was conducted on various health indicators, such as skin lesions, lumps, eye condition, fecal consistency, movement, breathing, abdominal swelling, rectal prolapse, and anorexia (Burkholder et al., 2012).
3. RESULTS AND DISCUSSION
3.1. Characteristics of papaya peel nata
Nata, a chewy, agar-like food, is produced by A. xylinum through fermentation, requiring carbon, hydrogen, nitrogen, and minerals. Due to nutrient limitations, external supplementation like ammonium sulfate and sugar enhances water content, texture, and organoleptic properties (Anggreani et al., 2020; Tallei et al., 2022). PPN met the Indonesian National Standard (SNI) thickness of 1–1.5 cm, with A. xylinum synthesizing sugar into cellulose to form a dense structure. However, excessive incubation depletes nutrients, causing bacterial energy loss, with an optimal incubation period of 16 days (Rose et al., 2018; Utami & Kasmiati, 2021).
The sour aroma of PPN results from acetic acid, a fermentation by-product that lowers pH, although washing reduces this odor (Rachmawati et al., 2017). Its gelatinous texture, similar to other nata types, depends on water and fiber content, where higher fiber content strengthens cellulose bonds, reducing water and creating a firmer texture (Tubagus & Fizriani, 2021). The white color of nata is due to cellulose formation during sugar breakdown, with thickness and raw material color influencing its final appearance (Lusi & Nurmiati, 2017; Putri et al., 2021).
3.2. Crude fiber content of papaya peel nata
This study found that PPN contains 2.08% fiber per 100 g, higher than papaya peel paste (0.94%) and nata de durio (1.48%) but similar to dried papaya peel (2.39%) (Pavithra et al., 2017; Tampubolon et al., 2018; Yustisia et al., 2024). However, it has lower fiber than dragon fruit peel nata (3.83%) and pineapple peel nata (5%) (Nur’aini & Sari, 2015; Rahayu et al., 2023).
The lower fiber content of PPN compared to dragon fruit, pineapple, and guava peel nata may be due to the ingredient composition, substrate variations, environmental factors, and cellulose production of A. xylinum (Putriana & Aminah, 2013). Nitrogen levels and fermentation duration also impact fiber yield, with shorter periods (e.g. 8 days) producing thinner nata, while 16 days is optimal (Guntur et al., 2016; Putri et al., 2021).
3.3. Antioxidant capacity of papaya peel nata
The antioxidant capacity of PPN was measured using the DPPH radical scavenging assay, with ascorbic acid serving as the standard. This assay works by observing the reduction of the DPPH radical when it reacts with antioxidant compounds (Bartisz & Bratisz, 2022). PPN has an average antioxidant capacity of 6.4 µg AAE/g.
In a study by Dewi (2024), the production of Nata de Papaya, nata made from papaya flesh, yielded a total antioxidant capacity of 8.42 µg AAE/g based on the vitamin C standard. Furthermore, papaya juice yielded higher results, with a total antioxidant capacity of 43.01 µg AAE/g. This indicates that the total antioxidant capacity of nata made from papaya peel is lower than that made from papaya flesh and juice.
The low antioxidant capacity found in PPN may be attributed to the fact that other parts of the papaya, such as the flesh, generally contain a wider variety of antioxidant compounds, including polyphenols, flavonoids, tannins, anthocyanins, and quercetin (Khairani & Wahyuni, 2024). Moreover, unlike nata products, papaya juice is not subjected to heating or lengthy processing, which helps preserve its antioxidant compounds. This is consistent with the study by Suzery et al. (2020), which stated that temperature significantly affected antioxidant stability and activity. The higher the temperature, the less stable the antioxidant structure due to degradation. When structural degradation of antioxidants occurs, their antioxidant activity also decreases (Suzery et al., 2020).
3.4. Hemoglobin A1c level of rats
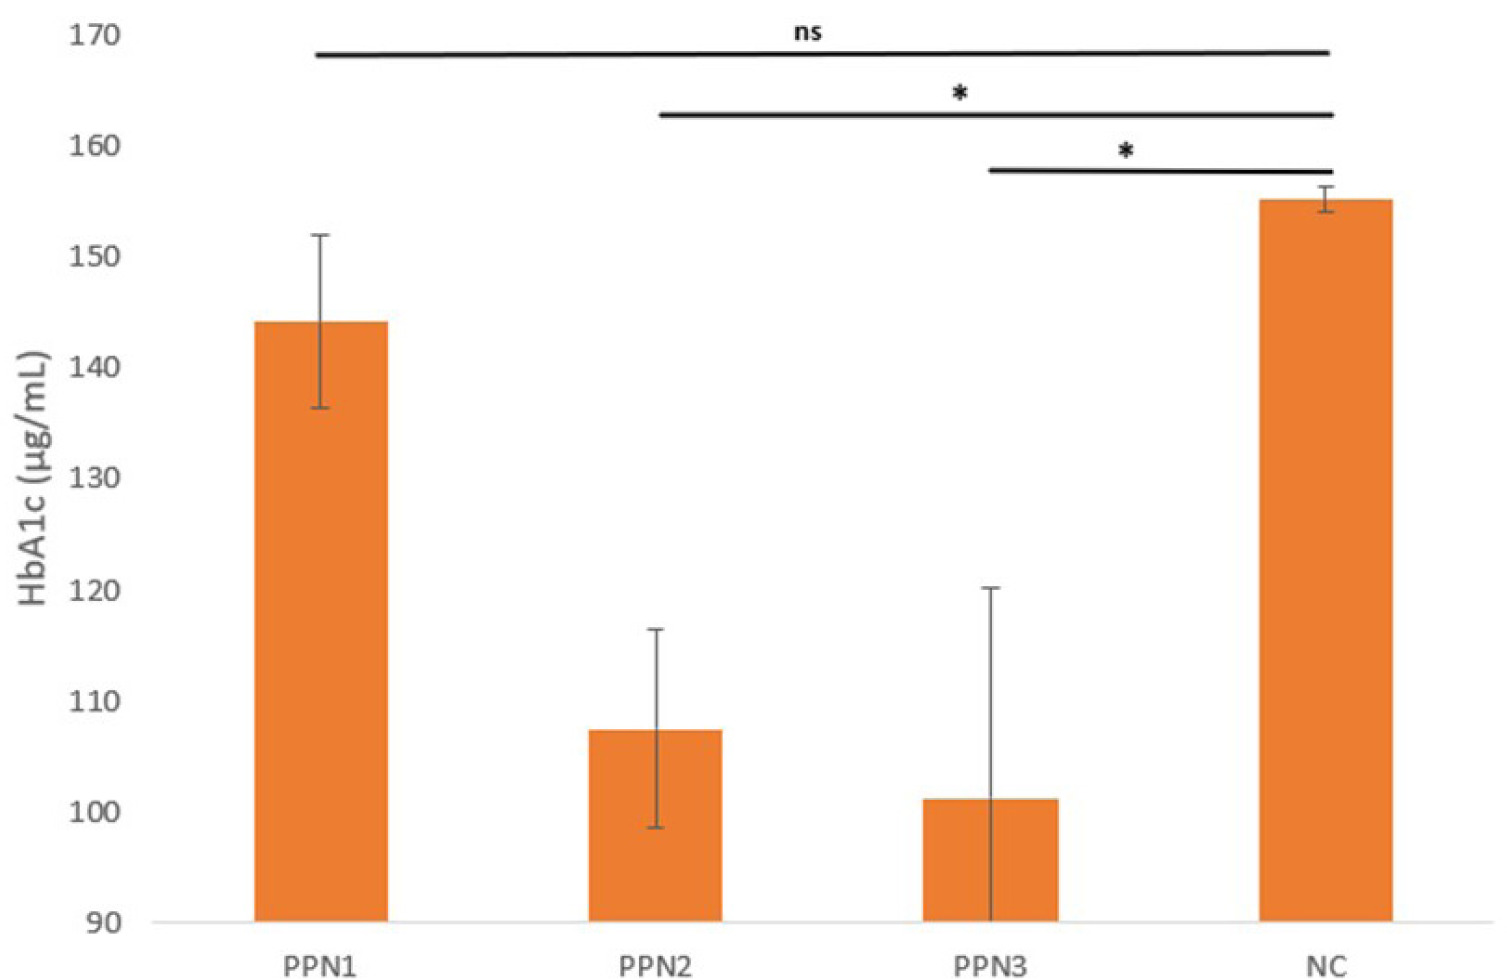
Hemoglobin A1c (HbA1c) testing was performed to measure glucose regulation in the blood over the past 90 days. Higher plasma glucose levels result in elevated HbA1c concentrations in red blood cells (Neon et al., 2024).
The HbA1c levels in all rats were assessed in each group during the fourth week, using ELISA. The findings (Figure 1) revealed HbA1c levels of 144.2 ng/mL ± 7.8 for PPN1, 107.5 ng/mL ± 8.9 for PPN2, 101.2 ng/mL ± 19.06 for PPN3, and 155.2 ng/mL ± 1.4 for NC. Statistical analysis was performed to determine significant differences among the groups using one-way ANOVA, which yielded a p-value of 0.008, indicating significant differences among the groups. Post hoc analysis was conducted to examine intergroup differences and revealed that changes in HbA1c in the PPN2 and PPN3 showed significant differences from the KN group (p = 0.02), as presented in Figure 1.
A significant reduction in HbA1c indicates improved long-term blood glucose levels (Estanyol et al., 2023). PPN is a soluble fiber (cellulose) that prolongs satiety and reduces food intake by lowering food energy density, inducing satiety through gut hormone release (Liu et al., 2024). Studies link this to increased glucagon-like peptide-1 (GLP-1), stimulating insulin secretion for better glucose control, and elevated peptide YY (PYY) levels, reducing food intake and aiding in glycemic control (Reimer et al., 2014). Fiber fermentation enhances gut microbiota diversity, increases SCFA production, and improves insulin secretion and HbA1c levels by stimulating intestinal GLP-1 and PYY production, while viscous, gel-forming fiber slows macronutrient digestion, and reduces intestinal permeability and glucose absorption, ultimately lowering postprandial blood glucose and HbA1c, thereby positively impacting metabolic health (Mao et al., 2021).
3.5. Fasting blood glucose of rats
Figure 2 illustrates FBG levels in rats. Before STZ induction, glucose levels were normal, but after induction, FBG increased significantly, confirming hyperglycemia. This aligns with moderate STZ doses (40–50 mg/kg BW), partially impairing insulin secretion, mimicking type 2 diabetes mellitus (Islam & Wilson, 2012). STZ damages pancreatic beta cells by alkylating DNA via the GLUT2 transporter, leading to beta-cell necrosis, NAD+, and ATP depletion, accelerated cell death, and the release of nitric oxide (NO) and ROS. However, their role in beta-cell damage is minimal (Lenzen, 2008).
Figure 2
Blood glucose changes for each treatment before STZ-induction, after STZ-induction, and post-treatment. Data represent mean + standard deviation, n = 5. NC: negative control (distilled water); PPN1: papaya peel nata 0.5 g; PPN2: papaya peel nata 0.6 g; PPN3: papaya peel nata 0.7 g.
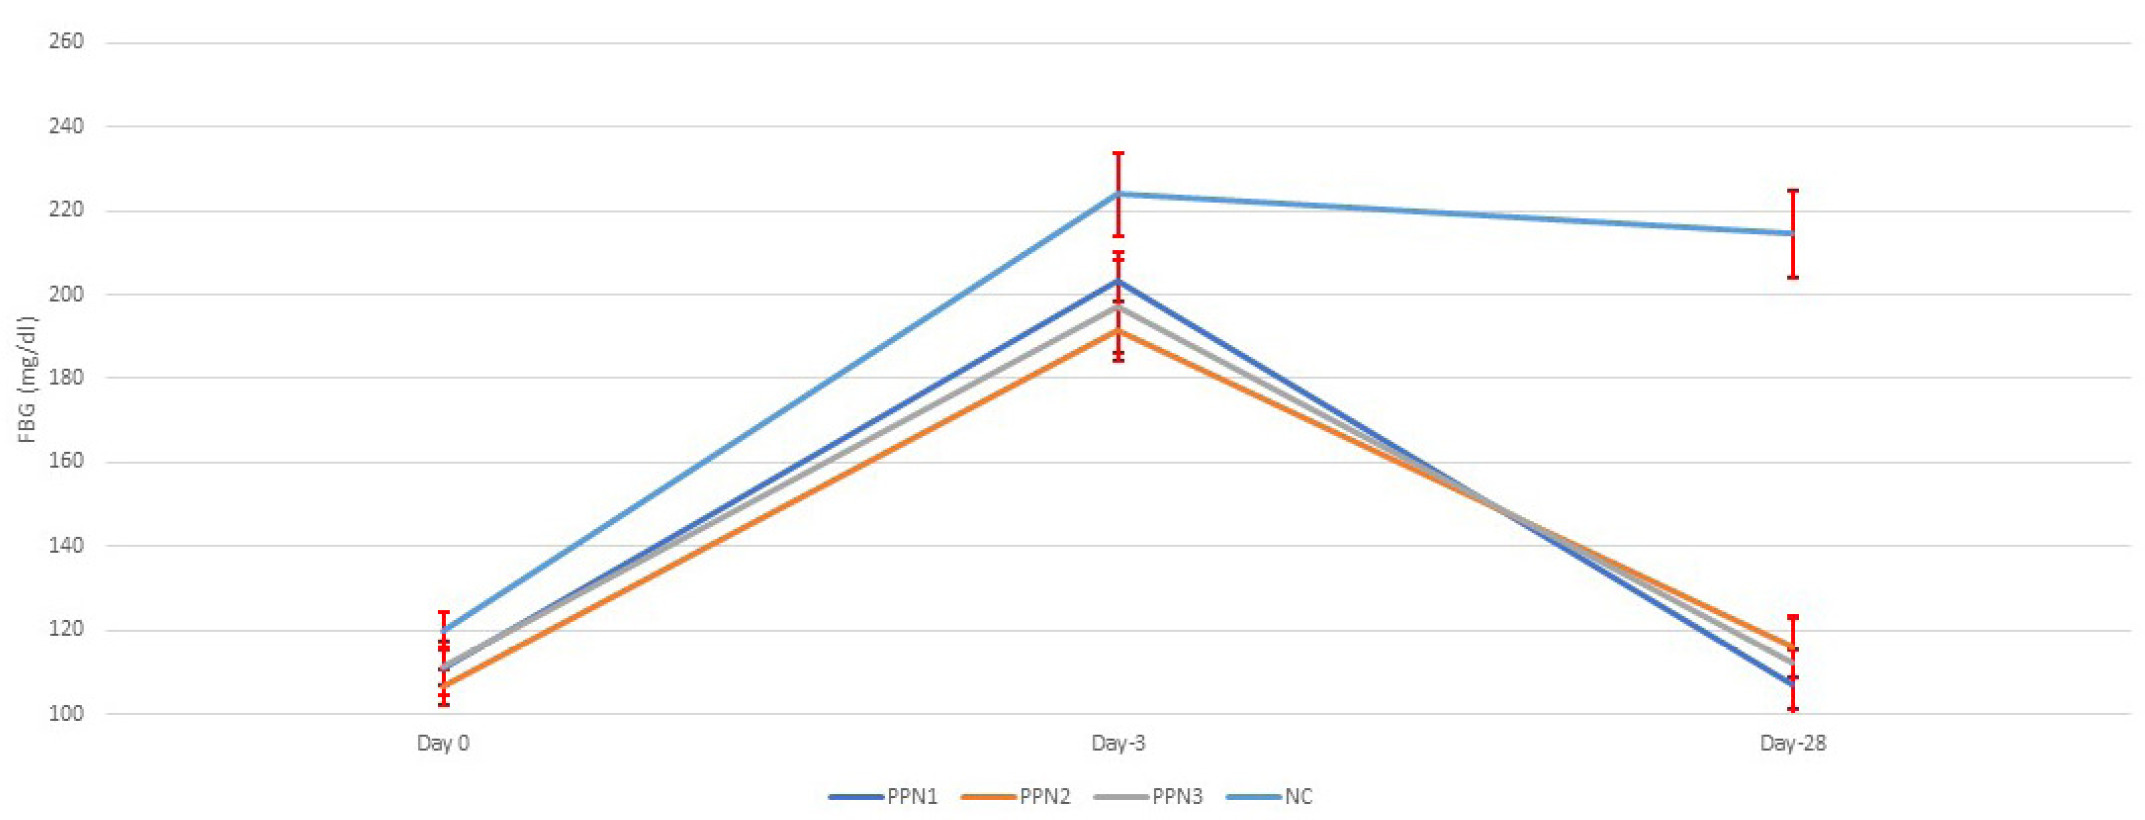
Following 4 weeks of treatment, FBG levels decreased across all groups. The PPN1 group showed an average FBG of 107.2 ± 8.1 mg/dL, PPN2 averaged 116 ± 7.2 mg/dL, PPN3 was 112.1 ± 11.0 mg/dL, and NC remained at 214.5 ± 10.4 mg/dL. FBG levels significantly improved in the PPN groups (0.5, 0.6, and 0.7 g), returning to normal, while the NC group remained hyperglycemic. This aligns with studies showing stabilization of STZ-induced hyperglycemia after an initial spike, with glucose levels declining over 10 days (Mostafavinia et al., 2016). Endogenous antioxidants may counteract the low ROS levels from STZ induction, minimizing beta-cell damage (Fajarwati et al., 2023). The FBG reduction was statistically significant (p < 0.001). Dietary fiber, including papaya extracts, can lower FBG by slowing gastric emptying, reducing glucose absorption, and improving insulin sensitivity (Adetayo et al., 2021; Brockman et al., 2012; Sindurani & Rajamohan, 2000).
However, post hoc tests showed no dose-dependent differences in FBG levels among PPN at 0.5, 0.6, and 0.7 g. This is in line with other studies in which fiber intervention using flaxseeds enriched with yogurt produced no significant changes in fasting blood glucose but showed a significant improvement in HbA1c levels (Hasaniani et al., 2019). In the study by Slavin (2013), it was also mentioned that short-term evaluations are less likely to reveal significant blood glucose responses. This indicates that FBG is only influenced by an individual’s recent diet. In contrast, HbA1c is a relatively strong predictor in diabetic subjects, reflecting the average blood glucose levels over a more extended period (Hasaniani et al., 2019).
3.6. Gut microbiota (L. gasseri) of rats
To further investigate the effects of fiber consumption from PPN, this study also examined gut microbiota. Gut microbiota was detected through fecal samples collected from rats in the fourth week using the RT-PCR method. The specific gut microbiota analyzed was L. gasseri.
The RT-PCR results, shown in Figure 3, indicate variability among the PPN treatment groups. The findings reveal that the L. gasseri population was higher in the PPN1 (334.1 ± 261.8) and the PPN3 groups (139.8 ± 81.7) compared to the negative control group, which only received distilled water (99.99 ± 86.9). The Kruskal–Wallis test was used to determine the significant differences among groups due to non-normal data distribution. The results showed significant differences in L. gasseri populations across the PPN1, PPN2, PPN3, and KN groups, with a p-value of 0.028.
Figure 3
HbA1c level of each group. Data represent mean + standard deviation, n = 5. NC: negative control (distilled water); PPN1: papaya peel nata 0.5 g; PPN2: papaya peel nata 0.6 g; PPN3: papaya peel nata 0.7 g; ns (p > 0.05)’ * (p < 0.0.5); ** (p < 0.01). One-way ANOVA.
Administering PPN, a dietary fiber source, increases gut microbiota populations, particularly L. gasseri, which aids blood glucose regulation. The decline in microbiota diversity in diabetics is enhanced by higher fiber intake. However, digestive enzymes cannot metabolize fiber, making it an accessible carbohydrate for microbiota and increasing SCFA production (Makki et al., 2018; Portincasa et al., 2022). L. gasseri metabolizes complex carbohydrates into SCFA (acetate, butyrate, and propionate), which activates G-protein-coupled receptors (GPR41/GPR43) in intestinal cells, triggering peptide YY (PYY) secretion to slow intestinal motility and enhance nutrient absorption (Adeshirlarijaney & Gewirtz, 2020; Erejuwa et al., 2014) An increase in L. gasseri populations improves energy utilization and glucose tolerance, with SCFA binding to free fatty acid receptor 3 (FFA3/GPR41) in the intestines and sympathetic nervous system, stimulating energy expenditure (Shirouchi et al., 2016). SCFA, particularly butyrate, also enhances GLP-1 secretion via GPR41, regulating energy metabolism and digestion (Shirouchi et al., 2016).
However, the gut microbiota result did not correlate with the dose increase of PPN. PPN1 showed the highest number, whereas PPN3 was middle, and PPN2 showed the least. This is in line with the study by Hald et al. (2016), which stated that administration of a Health Carbohydrate Diet (HCD) caused a significant decrease in bacterial species richness in all individuals. However, it was found that HCD consumption increased the variation of gut microbiota both between individuals and within the same individual. This finding indicates that the increase in intestinal bacteria due to dietary fiber depends on the individual. This result is likely due to the substantial selection of certain bacterial types by dietary fiber on the taxa that were already present in each individual’s gut before the intervention. In addition, another study by Salonen et al. (2014) also found that individuals given resistant starch (RS) type 3 experienced a decrease in both the total number and diversity of microbiota. This is assumed to reflect the dominance of one particular bacterial type, which reduces the abundance of other bacterial species. However, it was observed that intervention with a non-starch polysaccharide (NSP) diet, which has a complex structure consisting of cellulose, pectin, and various types of hemicellulose, resulted in a more significant amount of microbiota. These findings provide insights into prebiotic mechanisms, suggesting that a simple and highly specific prebiotic, such as nata made from papaya peel, which consists only of cellulose, may reduce microbial diversity due to the dominance of bacteria most capable of utilizing it. Meanwhile, promoting a diverse microbiota likely requires the provision of multiple or complex substrates.
These results are supported by the study by Walker et al. (2011), which concluded that gut microbiota is generally in a continuous state of change over time, driven by short-term changes in dietary intake. Thus, only the most adaptive and competitive bacteria will commonly be found among the dominant microbiota during sampling in each individual. The composition of bacterial strains in the colonic microbiota also varies between individuals, indicating significant differences in how individuals’ microbiota responds to dietary changes and in the fermentation process of dietary substrates in the colon (Walker et al., 2011). Therefore, dietary recommendations regarding fiber intake are suggested to be individualized. Aside from dietary factors, the gut microbiota is also influenced by immunological factors, genetics, and microbial exposure at birth (Hald et al., 2016).
3.7. Body weight and Lee index of rats
Throughout the 4-week study, rats’ body weight changes were monitored across all treatment groups. In the first week following STZ induction, all groups experienced weight loss. The average body weights during this period were 189.6 ± 11.1 g (PPN1), 179.0 ± 22.2 g (PPN2), 173.8 ± 17.4 g (PPN3), and 173.0 ± 13.9 g (NC). Weight loss in hyperglycemic rats is linked to the body’s inability to use glucose as the primary energy source, leading to protein catabolism for energy, which causes muscle mass reduction (Pournaghi et al., 2012). Additionally, hyperglycemia-induced polyuria contributes to dehydration and further weight loss (Kim & Ha, 2013).
By the second week post-induction, body weight began to recover in all groups, with averages of 262.0 ± 14.3 g (PPN1), 231.6 ± 12 g (PPN2), 232.4 ± 14.9 g (PPN3), and 222.2 ± 4.0 g (NC). Significant weight increases were observed in the PPN2 group, reaching 261.4 ± 10 g by Week 3. By Week 4, body weight averages were 303.4 ± 14.4 g (PPN1), 303.0 ± 14.9 g (PPN2), 323.6 ± 15.4 g (PPN3), and 274.8 ± 7.9 g (NC). Significant differences in weight gain were found between the PPN-treated and negative control groups (p = 0.001). The PPN groups gained more weight, as per the post hoc test shown in Figure 4; the PPN1 (p = 0.02), PPN2 (p = 0.03), and PPN3 (p = <0.001) values were significantly increased (Figure 5), compared to NC. Higher fiber intake improved FBG, enhanced energy efficiency and insulin response, and reduced fat accumulation (Brockman et al., 2012).
Figure 4
The number of gut microbiota (L. Gasseri) in each group. Data represent mean + standard deviation, n = 5. NC: negative control (distilled water); PPN1: papaya peel nata 0.5 g; PPN2: papaya peel nata 0.6 g; PPN3: papaya peel nata 0.7 g. Kruskal-Wallis test.
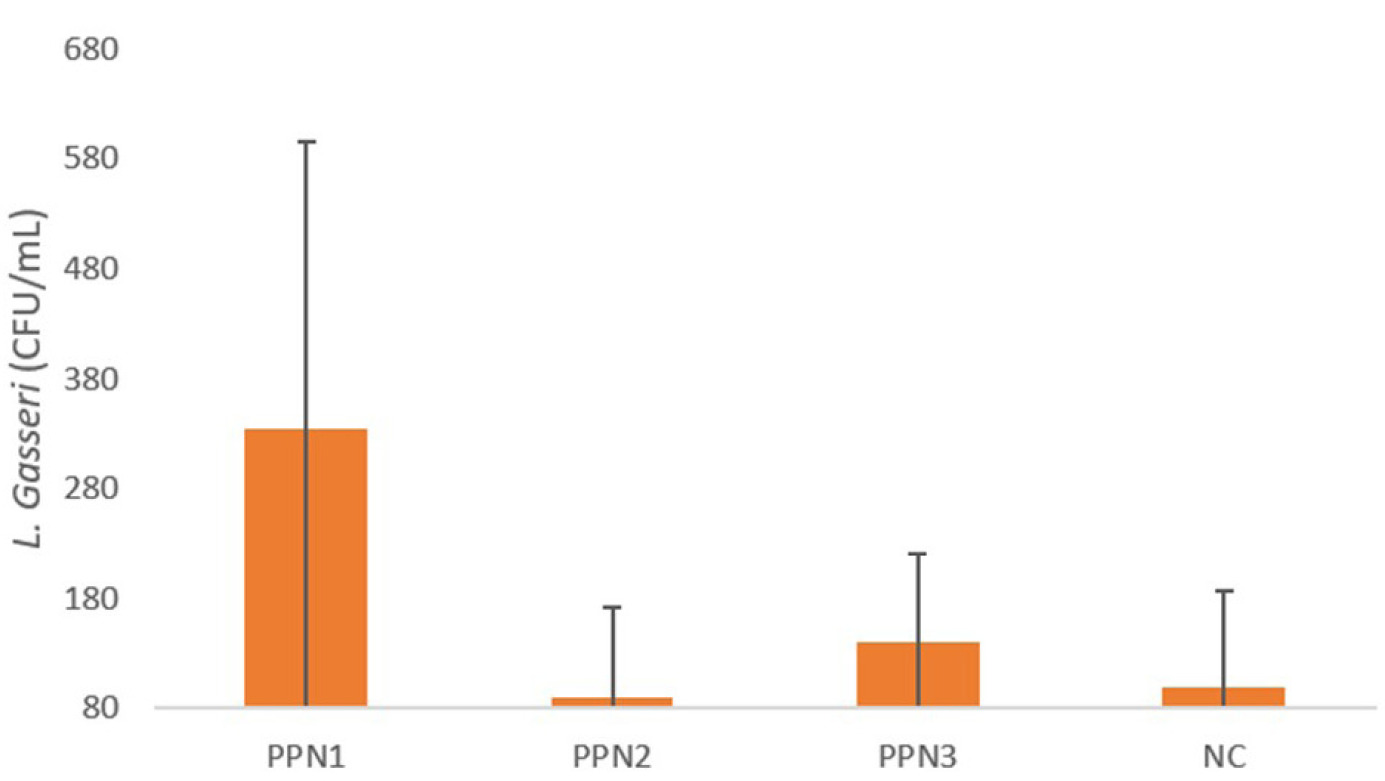
Figure 5
Changes in body weight (Day 28 – Day 0). Data represent mean + standard deviation, n = 5. NC: negative control (distilled water); PPN1: papaya peel nata 0.5 g; PPN2: papaya peel nata 0.6 g; PPN3: papaya peel nata 0.7 g; ns (p > 0.05); * (p < 0.05); ** (p < 0.01). One-way ANOVA followed by Post Hoc test.
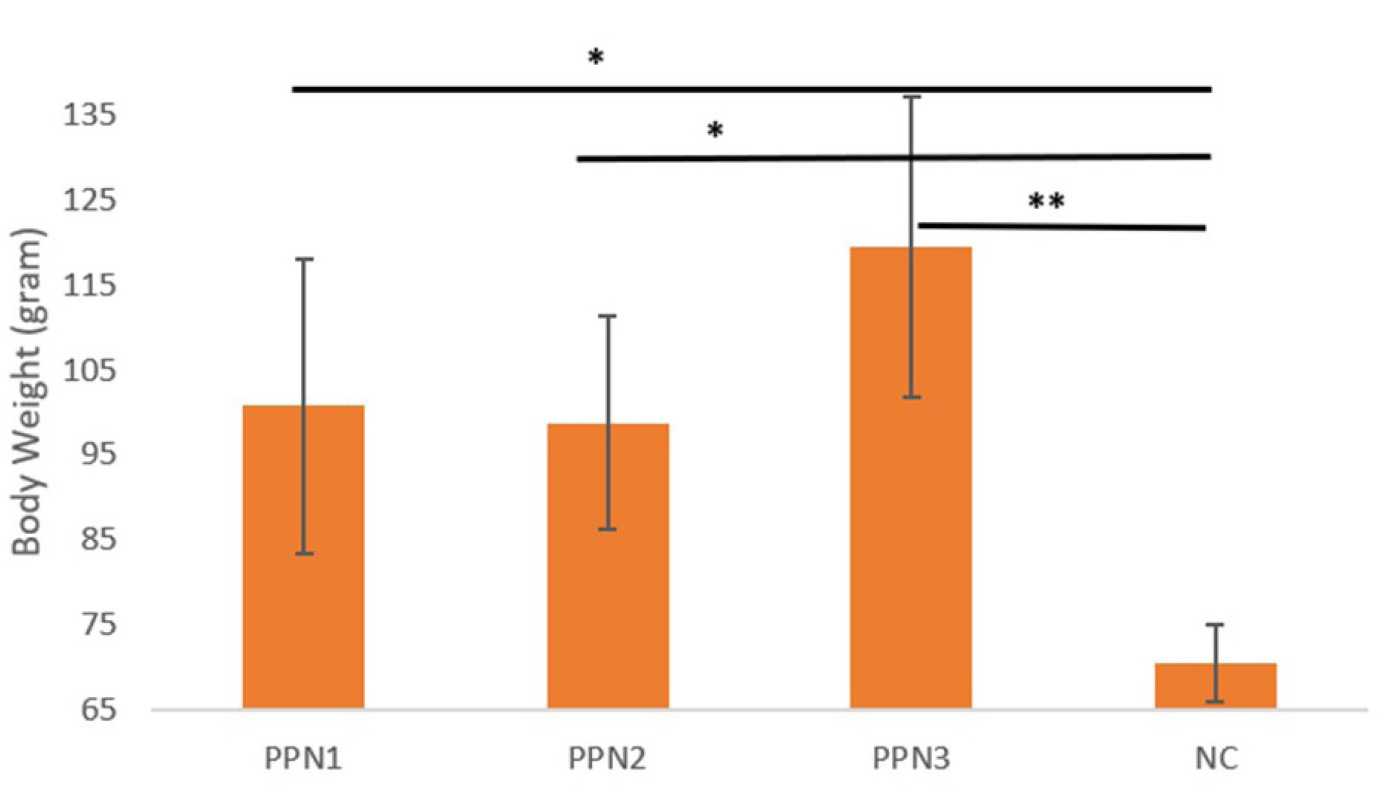
Figure 6
Lee index change for each treatment in week-0, week-1, week-2, week-3, and week-4. Data represent mean + standard deviation, n = 5. NC: negative control (distilled water); PPN1: papaya peel nata 0.5 g; PPN2: papaya peel nata 0.6 g; PPN3: papaya peel nata 0.7 g.
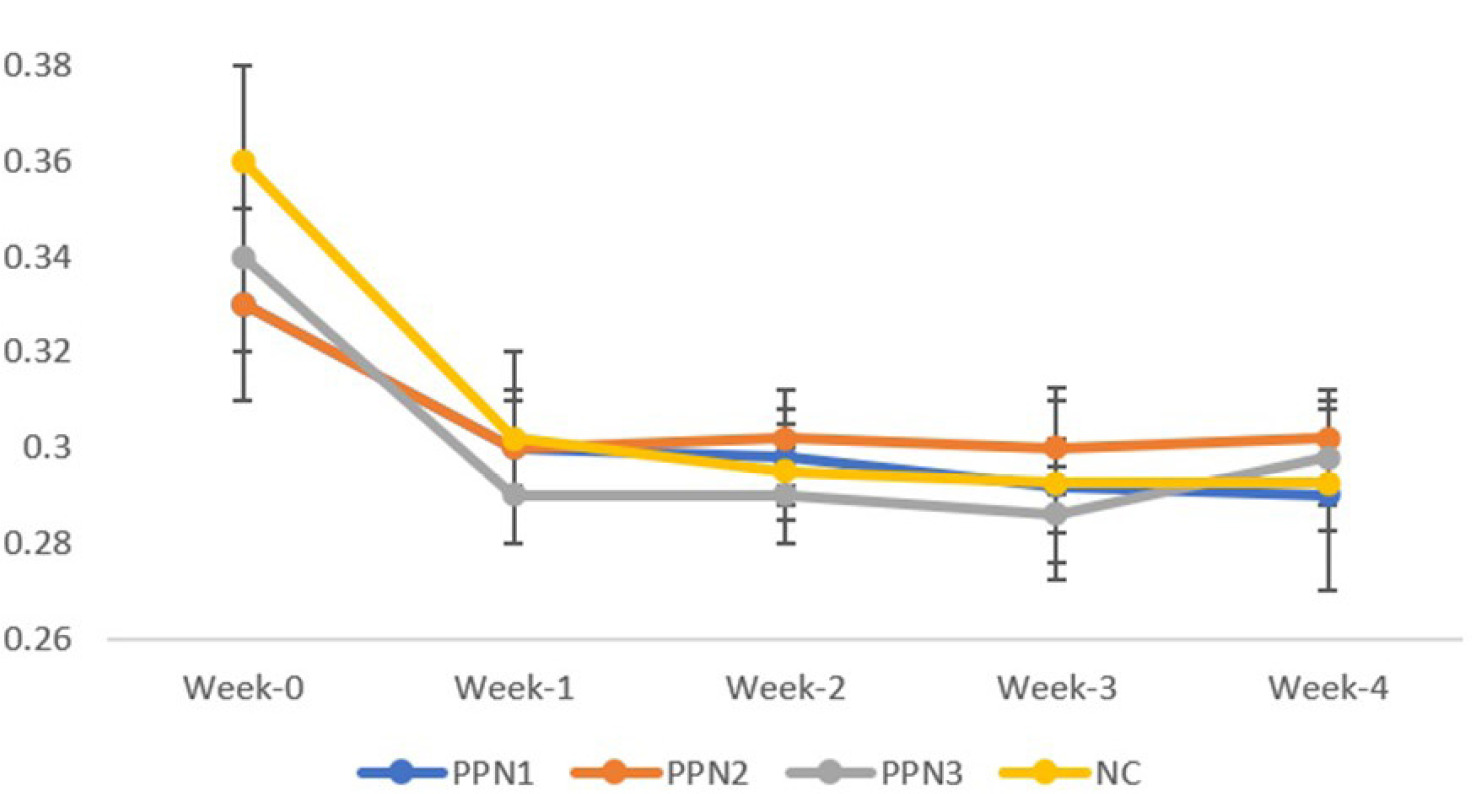
The Lee index was analyzed weekly using a Paired Samples T-test to assess obesity status (Figure 4). Initially, Lee index values were similar across groups. From Weeks 2 to 4, the index gradually increased. Significant changes were seen in the PPN2 (0.6 g) and PPN3 (0.7 g) groups, with changes of 0.03 ± 0.01 and 0.038 ± 0.013, respectively, and in the NC group (0.06 ± 0.03). No significant change was observed in the PPN1 (0.5 g) group (0.042 ± 0.038). Elevated blood glucose levels in STZ-induced rats caused weight loss, but in the PPN1 group, improved blood glucose levels reduced muscle mass loss, stabilizing the Lee index (Cruz et al., 2021).
3.8. Effect of papaya peel nata on the overall health status of the rats
Over the 4 weeks, one rat in the 0.7 g PPN group exhibited abdominal distension by the end of the treatment. A pitting edema test showed no fluid accumulation, suggesting the enlargement was due to gas buildup or bloating. High fiber intake, especially during initial dietary adjustments, can cause bloating and abdominal distension by increasing gastric content viscosity, delaying gastric emptying, and altering intragastric redistribution, which may lead to discomfort (Borkoles et al., 2022). Further research is needed to address digestive issues and assess the long-term effects of fiber consumption (Eswaran et al., 2013).
4. CONCLUSION
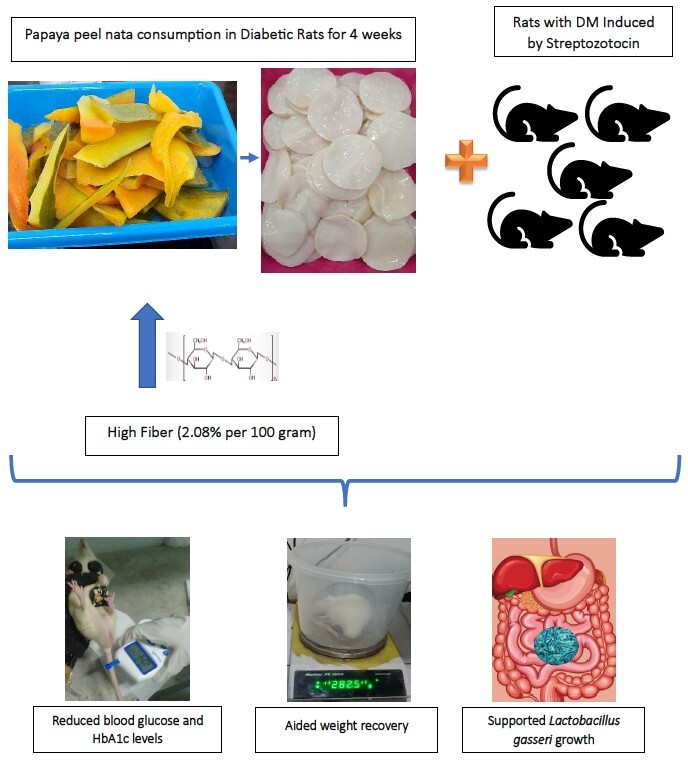
This study highlights PPN as a potential dietary intervention for diabetes and gut health. PPN reduced blood glucose and HbA1c levels, aided weight recovery, and supported the growth of L. gasseri in diabetic rats. Further research, including human studies and a positive control group, is necessary to confirm its long-term benefits and clinical relevance.
ACKNOWLEDGMENT
The author would like to thank the Graduate School of Hasanuddin University for supporting the research.