

1. INTRODUCTION
Neurodegenerative diseases are pathological conditions characterized by the selective damage or loss of specific groups of neurons. This neuronal loss disrupts the normal functioning of the central nervous system (CNS), impairing cognitive, motor, or both functions. The neurodegeneration process occurs silently over the years, with continuous nerve cell death throughout life before the first clinical symptoms appear (Silva and Pogačnik, 2020). Understanding the mechanisms underlying these changes has emerged as one of the most significant neurobiological challenges in recent decades, driving efforts to develop strategies to slow cognitive aging and preserve brain health (González-Fuentes et al., 2018).
In response to these challenges, the field of neuroprotection has gained prominence that encompasses strategies and mechanisms aimed at shielding the CNS from neuronal damage and preserving its functional integrity (Pertiwi et al., 2024). Key neuroprotective strategies often target oxidative stress and excitotoxicity, two critical contributors to neuronal cell death and neurodegeneration. Therapeutic interventions, including the use of glutamate antagonists and antioxidants, have demonstrated efficacy in both research and clinical settings (Lalkovičová and Danielisová, 2016).
Recent studies highlight the significant potential of natural resources in neuroprotection. Anjum et al. (2024) demonstrated that ethanolic extract of Mentha piperita significantly improved motor function, enhanced antioxidant capacity, and reduced neurodegeneration in the substantia nigra, highlighting its antioxidant and neuroprotective properties. Beppe et al. (2024) reported that an aqueous extract of Ximenia americana attenuated cognitive impairment induced by diazepam, further suggesting its neuroprotective and antioxidant effects. Malik et al. (2024) found that Acorus calamus effectively restored the antioxidant state of the brain and provided neuroprotection by reducing scopolamine-induced oxidative damage.
Similarly, Amaranthus has attracted considerable scientific interest for its many health benefits. Traditionally, it was used as a sedative, and modern research highlights the antioxidant, neuroprotective, and antidepressant properties of its leaves. These therapeutic effects affect critical brain functions, including sensory processing, movement regulation, mental and emotional balance, cognitive performance, and social behavior (Pertiwi et al., 2024). Despite its promising potential, further biochemical studies are required to validate and expand the understanding of these properties.
Protein-protein interactions (PPI) are vital to biological processes and the PPI network (PPIN) analysis reveals interaction principles and functional patterns in the cellular systems, enhancing our understanding of the biological system, also facilitating insights into disease mechanisms, gene and protein perturbations, and potential drug targets (Yugandhar and Gomiha, 2016). Grewal et al. (2024) used PPIN analysis to identify amyloid precursor protein as a potential hub protein and a key contributor to Alzheimer disease pathogenesis. Robati et al. (2024) used PPIN analysis to identify key proteins and genes involved in the cellular aging process and investigate the relationship between proteins in cellular rutin metabolic cycles.
Molecular docking plays a central role in drug discovery by providing detailed insights into molecular interactions that underpin key biological processes. It facilitates the identification and development of potential therapeutic agents (Shamsi et al., 2024). As a cost-effective and efficient alternative to experimental high-throughput screening, virtual screening allows compounds from digital libraries to be docked individually against target proteins, prioritizing candidates with the most favorable predicted binding affinities for further validation. Notably, virtual libraries often include unsynthesized compounds, enabling access to inexpensive and readily available molecules, thereby reducing both costs and dependency on docking precision (Paggi et al., 2024).
While docking provides a static approximation of binding interactions, its accuracy can be significantly enhanced through molecular dynamics (MD) simulations that model the real-time motion of all atoms within a system. This enables a more realistic prediction of binding poses and energetics (Paggi et al., 2024). At a quantitative level, MD-based approaches—particularly those employing free energy calculations—offer superior accuracy in estimating ligand binding affinities compared to docking alone (Hollingsworth and Dror, 2018).
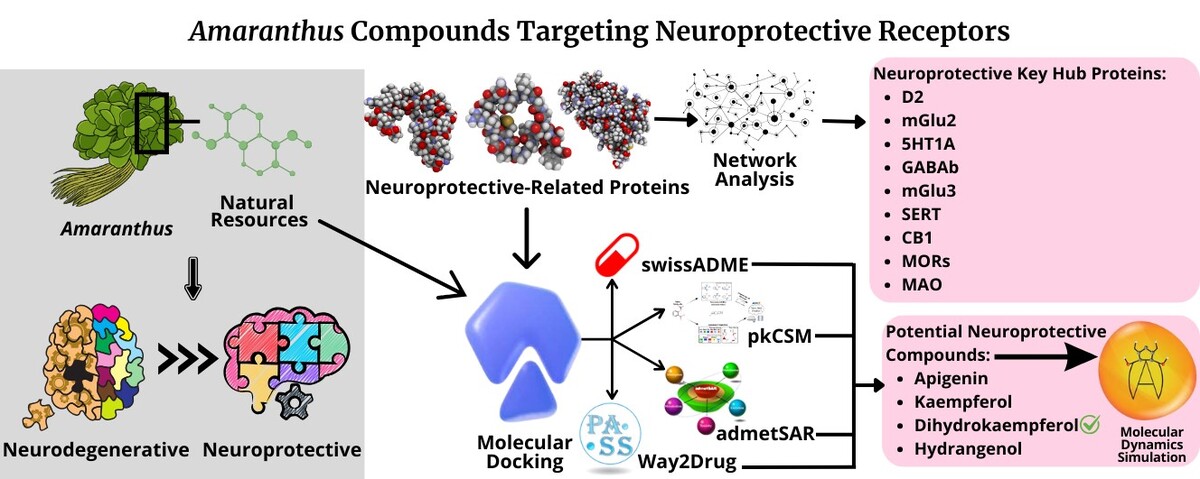
The neuroprotective potential of Amaranthus has been previously reported, yet the specific bioactive compounds and their molecular targets remain largely unexplored. The aim of this study was to identify key protein targets involved in neuroprotection through the PPIN analysis and to evaluate neuroprotective potential of Amaranthus-derived compounds via molecular docking and dynamics.
2. MATERIALS AND METHODS
2.1. Protein ID mapping
Protein identifier (ID) mapping was performed using the UniProt database (Consortium, 2023), with Protein Data Bank (PDB) ID and protein names as input. A total of 32 proteins (Table 1) were selected for further analysis based on a targeted literature review and database screening. The inclusion criteria were: (1) relevance to neuroprotective mechanisms or neuropsychiatric disorders (e.g., major depressive disorder, anxiety, and mood disorders) and (2) availability of 3D (three-dimensional) structures or interaction data in UniProt and PDB.
Table 1
List of 32 proteins associated with neuroprotection and mental health.
| Number | Protein | Gene | Physiological Relevance | PDB ID | Reference |
|---|---|---|---|---|---|
| 1 | Nrf2-Keap1 | KEAP1 INRF2 KIAA0132 KLHL19 | Anxiety, prevent depression, antidepression, bipolar | 8XGV | (Hashimoto, 2018) |
| 2 | P2X7R | P2RX7 | MDD, anxiety | 5XW6 | (Jaronczyk and Walory, 2022; Qi et al., 2024) |
| 3 | 5-HT1A | GNAI1 | MDD | 7E2Y/8PKM | (Ostrowska et al., 2018) |
| 4 | D3 | DRD3 | MDD | 3PBL | (Elek et al., 2021) |
| 5 | D2 | DRD2 | MDD | 6CM4 | (Elek et al., 2021) |
| 6 | MORs | OPRM1 MOR1 | Dysregulating this receptor may cause depression | 7UL4/4DKL/5C1M | (Jaronczyk and Walory, 2022; Jelen et al., 2022) |
| 7 | KORs | Not found | Dysregulating this receptor may cause depression | Not found | (Jaronczyk and Walory, 2022; Jelen et al., 2022) |
| 8 | DORs | Not found | Dysregulating this receptor may cause depression | Not found | (Jaronczyk and Walory, 2022; Jelen et al., 2022) |
| 9 | NOP | Not found | Dysregulating this receptor may cause depression | Not found | (Jaronczyk and Walory, 2022; Jelen et al., 2022) |
| 10 | mGlu2 | GRM2 GPRC1B MGLUR2 | MDD, Mood disorder | 5CNI | (Jaronczyk and Walory, 2022) |
| 11 | mGlu3 | GRM3 GPRC1C MGLUR3 | MDD, Mood disorder | 5CNK | (Jaronczyk and Walory, 2022) |
| 12 | GPR26 | GPR26 | MDD | Not found | (Albert, 2020; Jaronczyk and Walory, 2022) |
| 13 | GPR56 | ADGRG1 GPR56 TM7LN4 TM7XN1 UNQ540/PRO1083 | MDD | 7SF8 | (Albert, 2020; Jaronczyk and Walory, 2022) |
| 14 | GPR52 | GPR52 | MDD | 6LI2 | (Albert, 2020; Jaronczyk and Walory, 2022) |
| 15 | GPR158 | GPR158 KIAA1136 | MDD | 7SHE | (Albert, 2020; Jaronczyk and Walory, 2022) |
| 16 | TAAR1 | TAAR1 TA1 TAR1 TRAR1 | MDD | 8W8A | (Jaronczyk and Walory, 2022) |
| 17 | TAAR5 | TAAR5 PNR | MDD | Not found | (Jaronczyk and Walory, 2022) |
| 18 | CB1 | CNR1 CNR | MDD | 5TGZ/5XRA | (Jaronczyk and Walory, 2022; Patel and Hillard, 2009) |
| 19 | CB2 | CNR2 CB2A CB2B | MDD | 2HFF | (Jaronczyk and Walory, 2022; Patel and Hillard, 2009) |
| 20 | M1 | CHRM1 | MDD | 6ZFZ | (Jaronczyk and Walory, 2022) |
| 21 | M2 | CHRM2 | MDD | 5ZKC | (Jaronczyk and Walory, 2022) |
| 22 | GABAb | GABBR2 GPR51 GPRC3B | MDD | 4MR7 | (Jaronczyk and Walory, 2022) |
| 23 | GABAb | GABBR1 GPRC3A | MDD | 4MR7 | (Jaronczyk and Walory, 2022) |
| 24 | NK1 | TACR1 NK1R TAC1R | MDD | 6HLP | (Jaronczyk and Walory, 2022) |
| 25 | CCK2 | CCKBR CCKRB | MDD | 7F8W | (Jaronczyk and Walory, 2022) |
| 26 | Leucine transporter | Not found | MDD | 2A65 | (Jaronczyk and Walory, 2022) |
| 27 | NET | SLC18A1 VAT1 VMAT1 | MDD, ADHD | 8TGL | (Jaronczyk and Walory, 2022) |
| 28 | SERT | SLC6A4 HTT SERT | MDD | 5I6X | (Jaronczyk and Walory, 2022; Moazzem Hossen et al., 2021) |
| 29 | DAT | Not found | MDD | Not found | (Jaronczyk and Walory, 2022) |
| 30 | Mineralocorticoid receptor | NR3C2 MCR MLR | Sleep behavior, memory storage, and anxiety, MDD | 2AA2 | (Bledsoe et al., 2005; Jaronczyk and Walory, 2022) |
| 31 | MAOB | MAOB | Neurodegenerative disease | 2XCG | (Lv et al., 2023) |
| 32 | Glycogen synthase kinase 3s | GSK3B | Neuroprotection | 4PTE | (Rayasam et al., 2009) |
2.2. Protein-protein interaction
The proteins obtained from the ID mapping process were de-duplicated. The resulting list was input into the STRING (search tool for the retrieval of interacting genes/proteins) database (https://string-db.org/) (Szklarczyk et al., 2022) to identify interactions among the proteins. The analysis was performed using the following parameters: organism (Homo sapiens), network type (full STRING network), and minimum required interaction score (medium confidence threshold of 0.400).
2.3. Network analysis
The Cytoscape application was used to analyze the protein interaction network (Shannon et al., 2003). Centrality analyses performed included Betweenness Centrality, Degree, and Closeness Centrality. The CytoHubba plugin was employed to identify key proteins (hub proteins). The centrality measure used was Maximal Clique Centrality (MCC), defined by Equation 1.
Where S(v) is the collection of maximal cliques containing v; (|C| – 1)! is the product of all positive integers less than |C|; and if there is no edge between the neighbors of node v, then MCC(v) is equal to its degree (Chin et al., 2014).
2.4. Molecular docking
The molecular docking method described by Cahya et al. (2024) was used with some modifications.
2.4.1. Ligand preparation
The ligand preparation process involved in the retrieval of 240 Amaranthus-derived compounds is hereafter referred to as test ligands (listed in Table S1, Supplementary). These compounds were selected based on literature reports of the liquid chromatography-mass spectrometry (LC-MS) phytochemical profiling of four commonly studied Amaranthus species: A. viridis, A. spinosus, A. tricolor, and A. caudatus. The keyword search was conducted using combinations of these species such as “LC-MS Amaranthus viridis”; “LC-MS Amaranthus spinosus”; “LC-MS Amaranthus tricolor”; and “LC-MS Amaranthus caudatus” in Google Scholar. LC-MS-based identification was used to ensure that only experimentally detected and naturally occurring compounds were considered, and then the compounds with the available 3D structural data in the PubChem database (https://pubchem.ncbi.nlm.nih.gov/) were used. The 3D structures were downloaded in .sdf format and converted to .pdb format using Open Babel software. Ligand optimization was then performed using AutoDock Tools v1.5.6, which included hydrogen atoms, calculation of Gasteiger charges, merging of nonpolar hydrogens, and the definition of rotatable bonds. Finally, the ligands were saved as .pdbqt format for docking analysis.
2.4.2. Receptor preparation
The receptors used in this study were key receptors selected on the basis of MCC value. The receptors were obtained in .pdb format from the PDB website (www.rscb.org/pdb). The preparation of these receptors involved separation of natural ligands, removal of water molecules, and elimination of attached residues using PyMOL software. The receptors were further optimized using AutoDock Tools version 1.5.6 by adding hydrogen atoms, calculating Gasteiger charges, and regulating the fusion of nonpolar hydrogens. The optimized receptors were saved in .pdbqt format for further analysis.
2.4.3. Redocking and blind docking
The receptor preparation process involved separating natural ligands, followed by redocking experiments with their respective receptors using AutoDock Vina 1.1.2. Molecular docking validation was performed using grid box sizes spaced at 1.000 Å intervals centered on the coordinates of the corresponding natural ligands. This process was repeated three times, and the grid box size that yielded the lowest Root Mean Square Deviation (RMSD) value was selected for further molecular docking analyses. Meanwhile, blind docking was performed using grid box sizes spaced at 1.000 Å intervals centered on the macromolecule coordinates. This process was also repeated three times and the conformation with the lowest binding energy was selected. The grid box size and center coordinates at 1.000 Å spacing intervals of the selected ligand conformation were stored for subsequent molecular docking analyses.
2.4.4. Virtual screening
Molecular docking simulations were conducted using AutoDock Vina 1.1.2 against their respective receptors. Docking parameters, including grid box dimensions, spacing, and coordinate points, were determined from both validation and blind docking results. The grid parameter used (center_x, center_y, and center_z, respectively) for each protein PDB ID were 50.742, 161.373, 30.939 (2XCG); –50.735, 22.457, –27.419 (4MR7); 2.026, 15.920, –58.785 (5C1M); 202.777, 46.765, 28.721 (5CNI); 21.588, –17.595, 51.595 (5CNK); –32.314, –21.112, 2.120 (5I6X); 48.771, 40.858, 299.565 (5TGZ); 15.668, 5.065, –17.580 (6CM4); and 108.981, 118.548, 95.060 (8PKM). The grid box size used for all protein were 20 × 20 × 20 with 1.000 Å spacing intervals. A configuration file detailing the grid box size and coordinates was created within the Vina directory. The docking process was then initiated from the Command Prompt (CMD). The output was generated as .pdbqt files, accompanied by a “log.txt” file containing the binding energy (ΔG) values. The ΔG values for the test ligands were compared with those of the cocrystal or control ligands to assess the spontaneity of ligand-receptor interactions. The top 10 test ligands with the most negative ΔG values were selected as the preferred ligands. The selected ligand was loaded in to the receptor using the PyMOL software and saved in the *pdb format. The file then opened using Discovery Studio Visualizer and LigPlot+ software to assess the binding site similarity (BSS) between the selected ligand and the cocrystal or control ligand.
2.5. Absorption, distribution, metabolism, excretion, and toxicology and bioactivity
Ligands with a BSS percentage greater than 50% were analyzed for their physicochemical properties, druglikeness, and medicinal chemistry using the SwissADME tool available at http://swissadme.ch/. The structures of the compound were uploaded in the SMILES (Simplified Molecular Input Line Entry System) code. The analysis was performed based on parameters consistent with Lipinski’s Rules of Five, Ghose, Veber, Egan, Muegge, pan assay interference compounds (PAINS), and BRENK. Ligands that met all these parameters were used for further analysis. Absorption, distribution, metabolism, excretion, and toxicity (ADMET) predictions were performed using the pkCSM and admet-SAR websites. Meanwhile, bioactivity predictions were performed using the Way2Drug platform.
2.6. Molecular dynamics
The MD method was used as described on the website https://ambermd.org/tutorials/ and by Awaluddin et al. (2021) with some modifications.
2.6.1. Preparation of protein and ligand
MD simulations for the selected protein-ligand complexes were performed using the AMBER20 software package. Prior to simulation, the complexes were prepared with Pdb4amber, which involved the removal of water molecules and hydrogen atoms. The processed files were further refined for simulation using ambpdb and pdbamber scripts.
2.6.2. Relaxation
The relaxation step included minimization, heating, and equilibration, and simulation began with energy minimization focused on the added water and ions. Water molecules were placed using LEaP in positions optimized for water-water interactions, without considering solute or ion presence. During minimization, all other system components were restrained. Each minimization phase comprised 10,000 cycles, beginning with 500 steps using the Steepest Descent method, followed by the Conjugate Gradient algorithm for the remaining steps. Then, the system was gradually heated from 100 K to 298 K for over 1 ns (nanosecond) under constant volume. Initial random velocities followed a Maxwell-Boltzmann distribution. Following heating, the system was relaxed at constant pressure for 1 ns to allow the simulation box density to equilibrate. Then, positional restraints were reduced stepwise. An initial 1 ns run was performed with 10 kcal/mol•Å2 restraints. Minimization was repeated with restraints applied only to the protein backbone. Successive 1 ns simulation at constant pressure were conducted with decreasing backbone restraints: first 10 kcal/mol•Å2, then 1 kcal/mol•Å2, and finally 0.1 kcal/mol•Å2. The final relaxation step was carried out with no restraints for 1 ns at constant pressure. A small time step (1 fs [femtosecond]) was maintained, and center of mass motions were removed every 1000 steps to ensure system stability.
2.6.3. Production run
The next stage involved the production run using PMEMD.CUDA, aimed at observing the unrestrained, natural motion of molecules. This simulation is performed under an NPT ensemble (constant number of particles, pressure, and temperature) for 200 ns at a fixed temperature. Post simulation analysis includes RMSD to assess system stability. The relative binding free energy was estimated using the Molecular Mechanics/Generalized Born Surface Area (MM/GBSA) method.
3. RESULTS
3.1. Protein ID mapping
The goal of protein ID mapping is to verify and standardize the protein identifiers of 32 selected proteins to ensure consistency and enable subsequent functional annotation and data integration. Based on the 32 selected proteins, 27 were verified using the Uniprot’s IDmapping tool. The list is available in Supplementary Table S2.
3.2. Protein-protein interaction
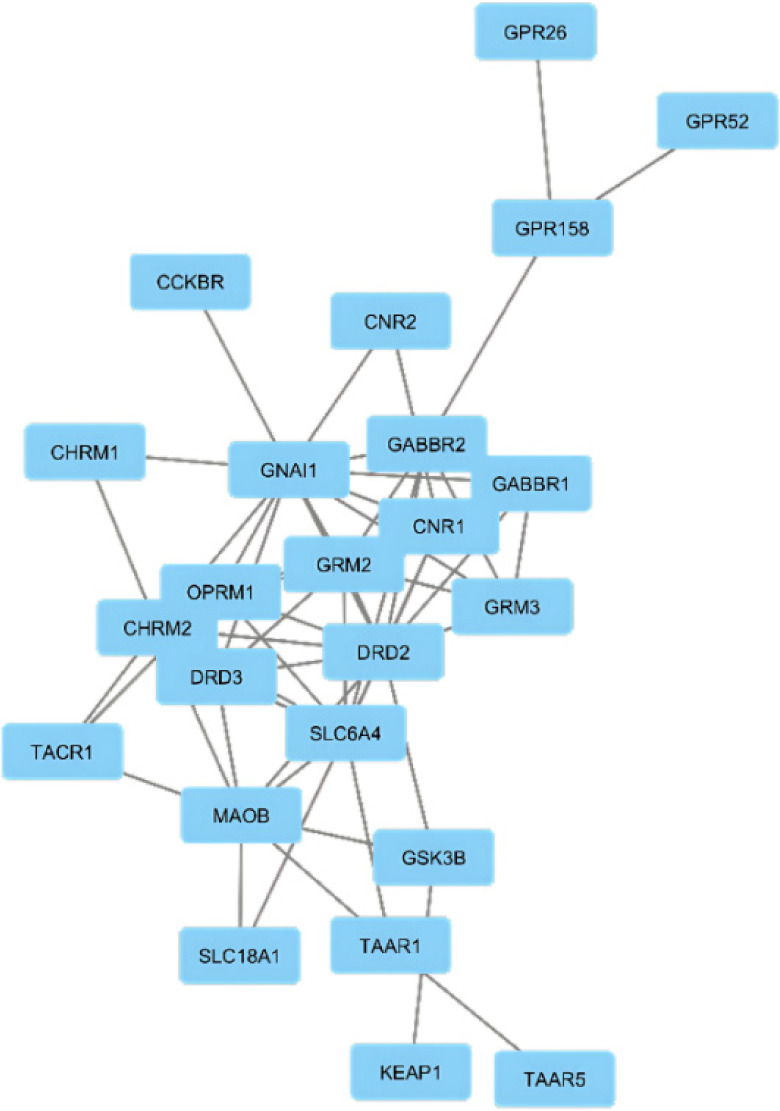
The aim of the protein-protein interactions was to identify key hub proteins potentially involved in neuroprotective mechanisms. The PPIN generated by STRING analysis comprised 24 proteins and 57 interactions at a medium confidence level (0.400) encoded by the input gene set (Figure 1). Further analysis was performed using network analysis.
3.3. Network analysis
Centrality analysis of 24 proteins (Table 2) and MCC-ranked key proteins (Table 3, Figure 2) highlight the central role of the dopamine receptor D2 (DRD2) gene (D2). D2 shows the highest degree, centrality, and ranking scores, underscoring its key function in the dopaminergic system’s link to neuroprotection. The guanine nucleotide-binding protein G[i] subunit alpha-1 (GNAI1) gene supports the importance of 5-hydroxytryptamine 1A receptor (5-HT1A), which shows high centrality through its connections across genes and pathways, emphasizing its role in neurotransmitter signaling as a G-protein subunit.
Table 2
Centrality analysis of 24 proteins.
Table 3
Key proteins based on the MCC ranking system.
| Rank | Protein | Gen | PDB ID | Score |
|---|---|---|---|---|
| 1 | D2 | DRD2 | 6CM4 | 202 |
| 2 | mGlu2 | GRM2 | 5CNI | 186 |
| 3 | 5HT1A | GNAI1 | 8PKM | 157 |
| 4 | GABAb | GABBR2 | 4RM7 | 127 |
| 5 | mGlu3 | GRM3 | 5CNK | 120 |
| 5 | GABAb | GABBR1 | 4MR7 | 120 |
| 6 | SERT | SLC6A4 | 5I6X | 52 |
| 7 | CB1 | CNR1 | 5TGZ | 50 |
| 8 | MORs | OPRM1 | 5C1M | 49 |
| 9 | MAOB | MAOB | 2XCG | 20 |
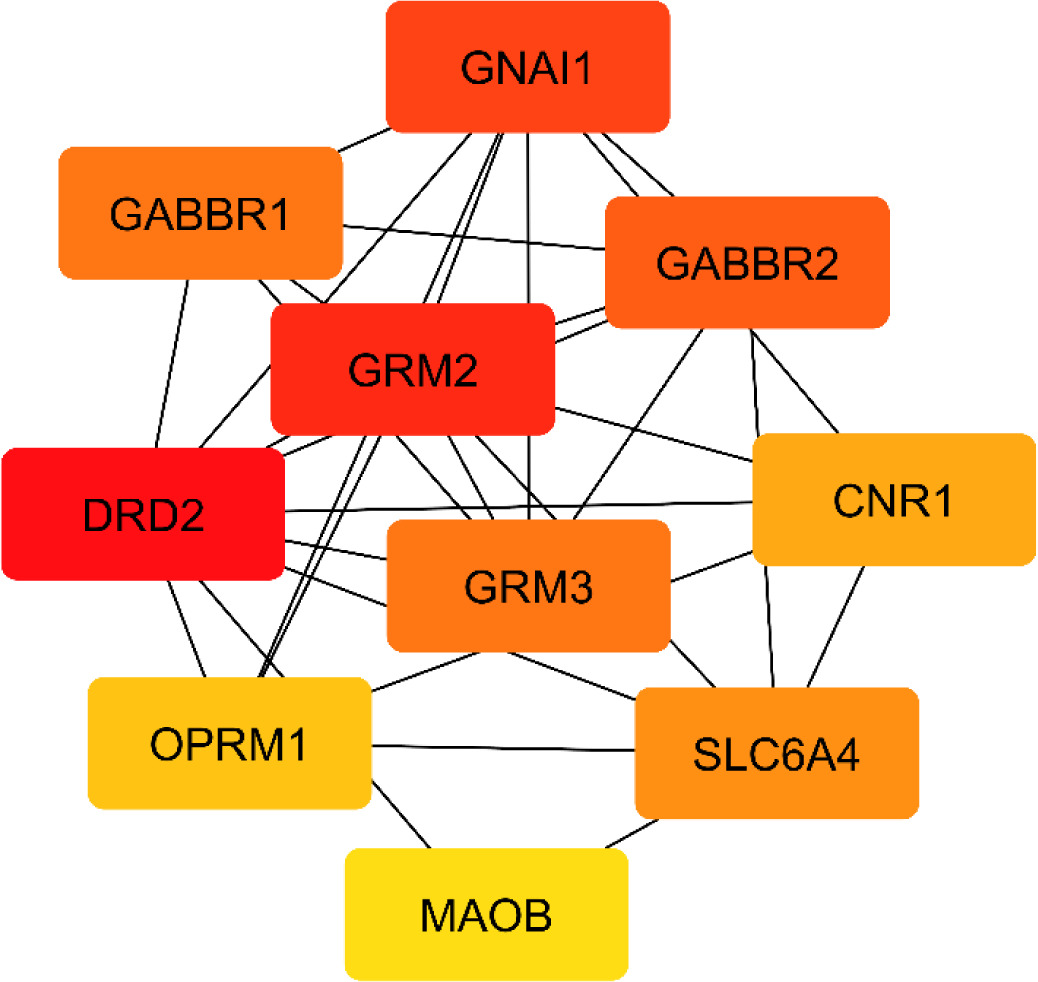
Figure 2
The network topology of the key proteins (encoded by its gene) based on the MCC ranking system, with colors indicating MCC scores: Red nodes show high MCC scores; yellow node shows low MCC scores.
GABAb proteins, especially Gamma-aminobutyric acid type B receptor subunit 2 (GABBR2), exhibit high betweenness centrality, suggesting a bridging role in inhibitory neurotransmission; Gamma-aminobutyric acid type B receptor subunit 1 (GABBR1), ranked fifth by MCC, also plays a significant part. mGlu2 and mGlu3, encoded by glutamate metabotropic receptor 2 (GRM2) and glutamate metabotropic receptor 3 (GRM3), are key modulators of glutamate signaling. Among them, mGlu2 shows stronger connectivity and higher centrality, linking with major neuroprotective proteins (D2, GABAb, 5HT1A) and playing a central role in balancing excitatory and inhibitory transmission. Though mGlu3 is less connected, it remains important in glutamate regulation.
SERT (solute carrier family 6 member 4 [SLC64A]) holds a central position with high degree and closeness centrality, acting as a connector in neuroprotective pathways. CB1 (cannabinoid receptor 1 [CNR1]) and MORs (Mu-type opioid receptor [OPRM1]), while moderately connected, serve as key bridges in neuroprotective signaling. Last, MAOB shows moderate centrality, reflecting its role in monoamine metabolism. Together, these findings reveal a highly interconnected neuroprotective network, with D2, mGlu2, 5HT1A, GABAb, and mGlu3 as major regulatory hubs.
3.4. Molecular docking
Molecular docking was used to virtually screen Amaranthus-derived compounds for potential binding to target proteins. Redocking validated the docking protocol by reproducing known ligand binding modes, while blind docking identified potential unknown binding sites. Blind docking was performed instead of using cocrystallized ligands, as the available ligands did not match the desired pharmacological actions (e.g., agonist or antagonist). As shown in Table 4, all receptor-ligand complexes had RMSD values < 2 Å, confirming docking precision.
Table 4
RMSD and binding affinity value of redocking or blind docking.
Binding affinities and BSS percentage values are summarized in Table S3 (Supplementary) and druglikeness and medicinal chemistry properties are summarized in Table S4 (Supplementary). Ligands with BSS percentage of > 50% and acceptable pharmacological profiles were shortlisted (Table 5). Several ligands showed better binding energy than control ligands (e.g., PDB: 2XCG, 5CNI, 5CNK, 4MR7), indicating potential for enhanced neuroprotective activity. Ligand-protein complexes (e.g., PDB: 4MR7, 5C1M, 5CNK, 5I6X, 5TGZ, 6CM4, 8PKM) were excluded due to violations of druglikeness or medicinal chemistry criteria (Table S4).
Table 5
Binding affinity of selected ligand with > 50% BSS and compliance of the druglikeness and medicinal chemistry.
Figure 3 illustrates the binding interactions of selected ligands, showing whether they bind the same region as the control ligand, suggesting comparable biological activity. Figure 4 presents the 3D interaction models of the selected ligands with the receptor, offering a structural perspective on their binding orientations. Table 6 details key amino acid interactions.
Table 6
Amino acid residue interactions between the selected and control ligands.
Figure 3
The similarity amino acid residue interaction between selected ligand and control ligand. (A) MAOB-apigenin; (B) mGlu2-kaempferol; (C) mGlu2-dihydrokaempferol; (D) mGlu2-hydrangenol.
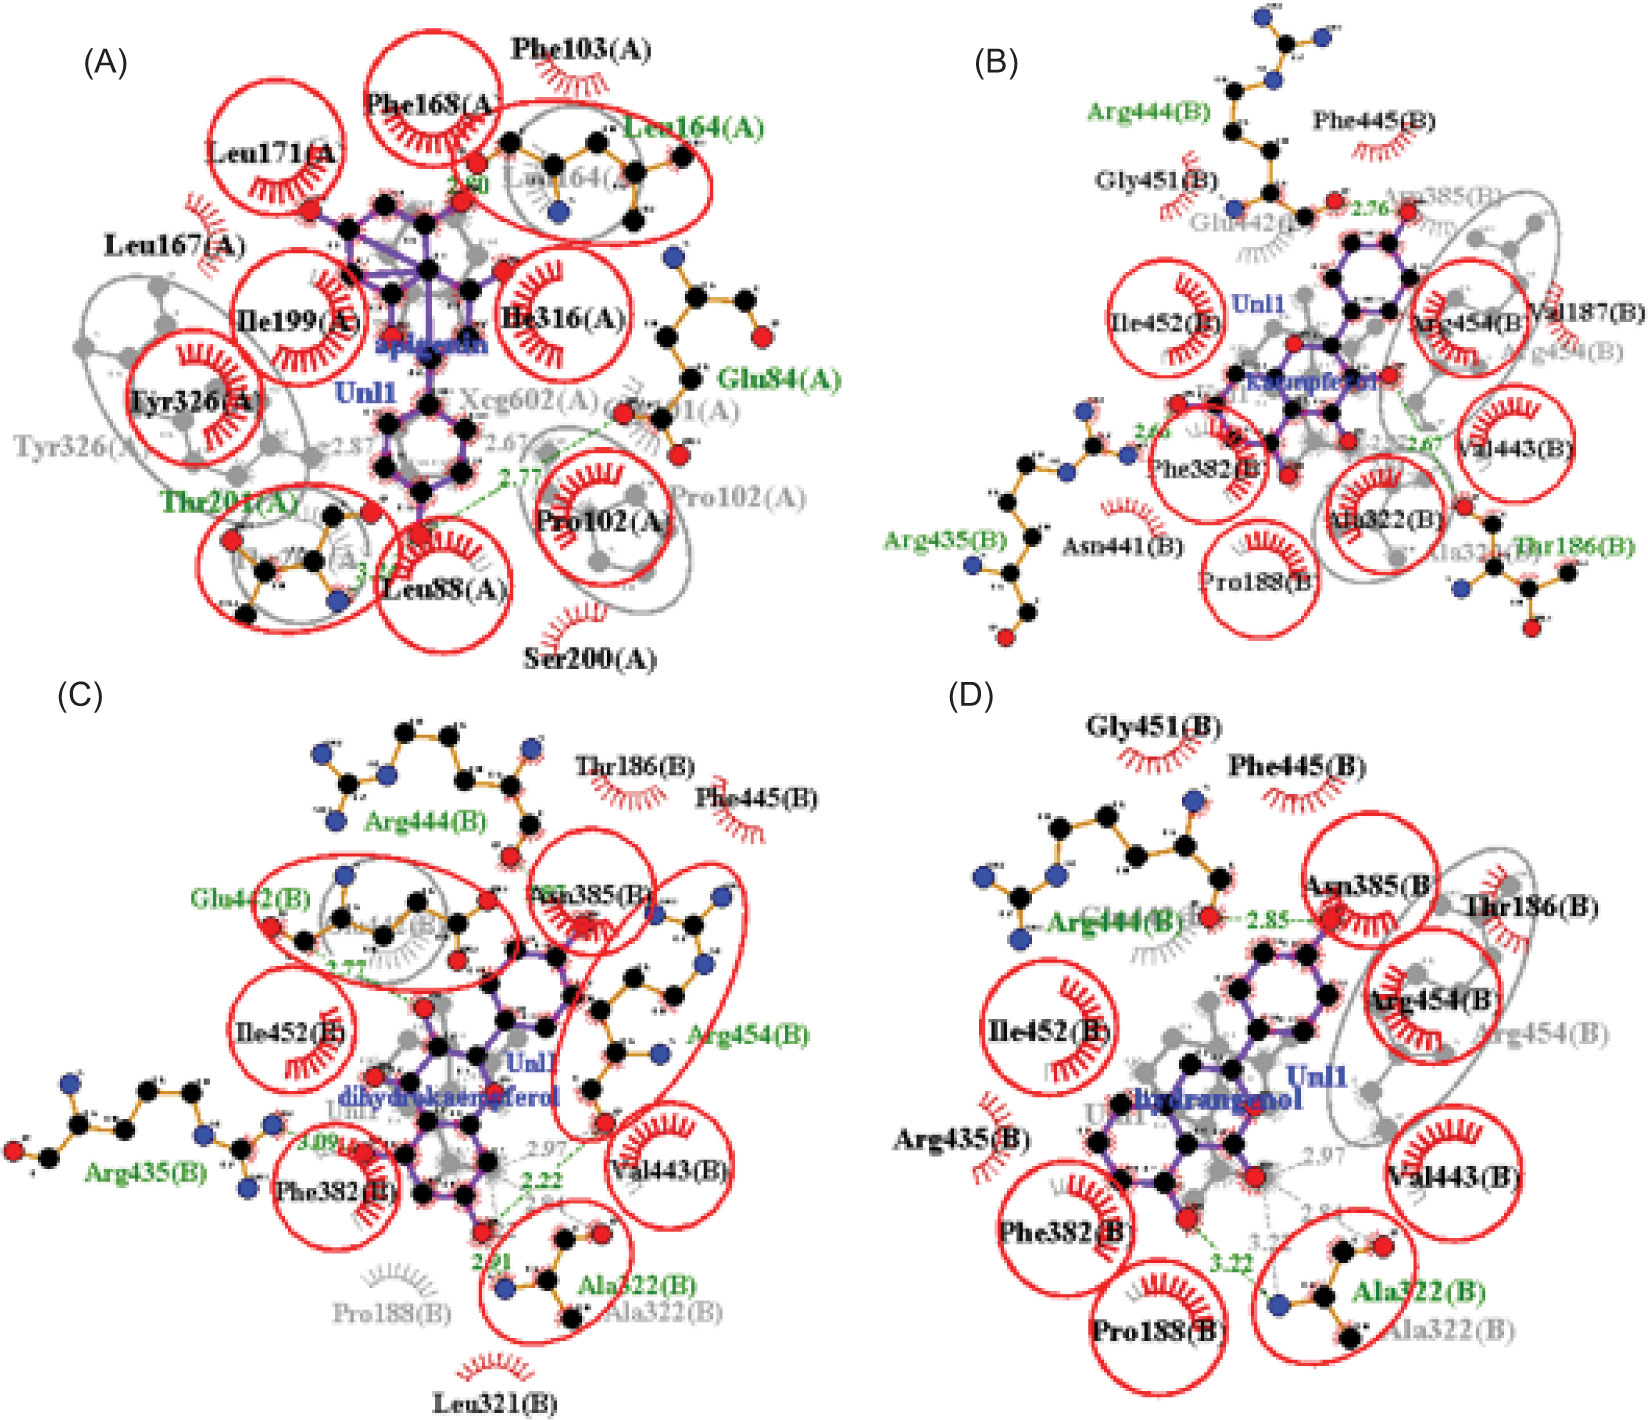
Figure 4
The visualization of 3D interaction between ligand and receptor. (A) MAOB-apigenin; (B) mGlu2-kaempferol; (C) mGlu2-dihydrokaempferol; (D) mGlu2-hydrangenol.
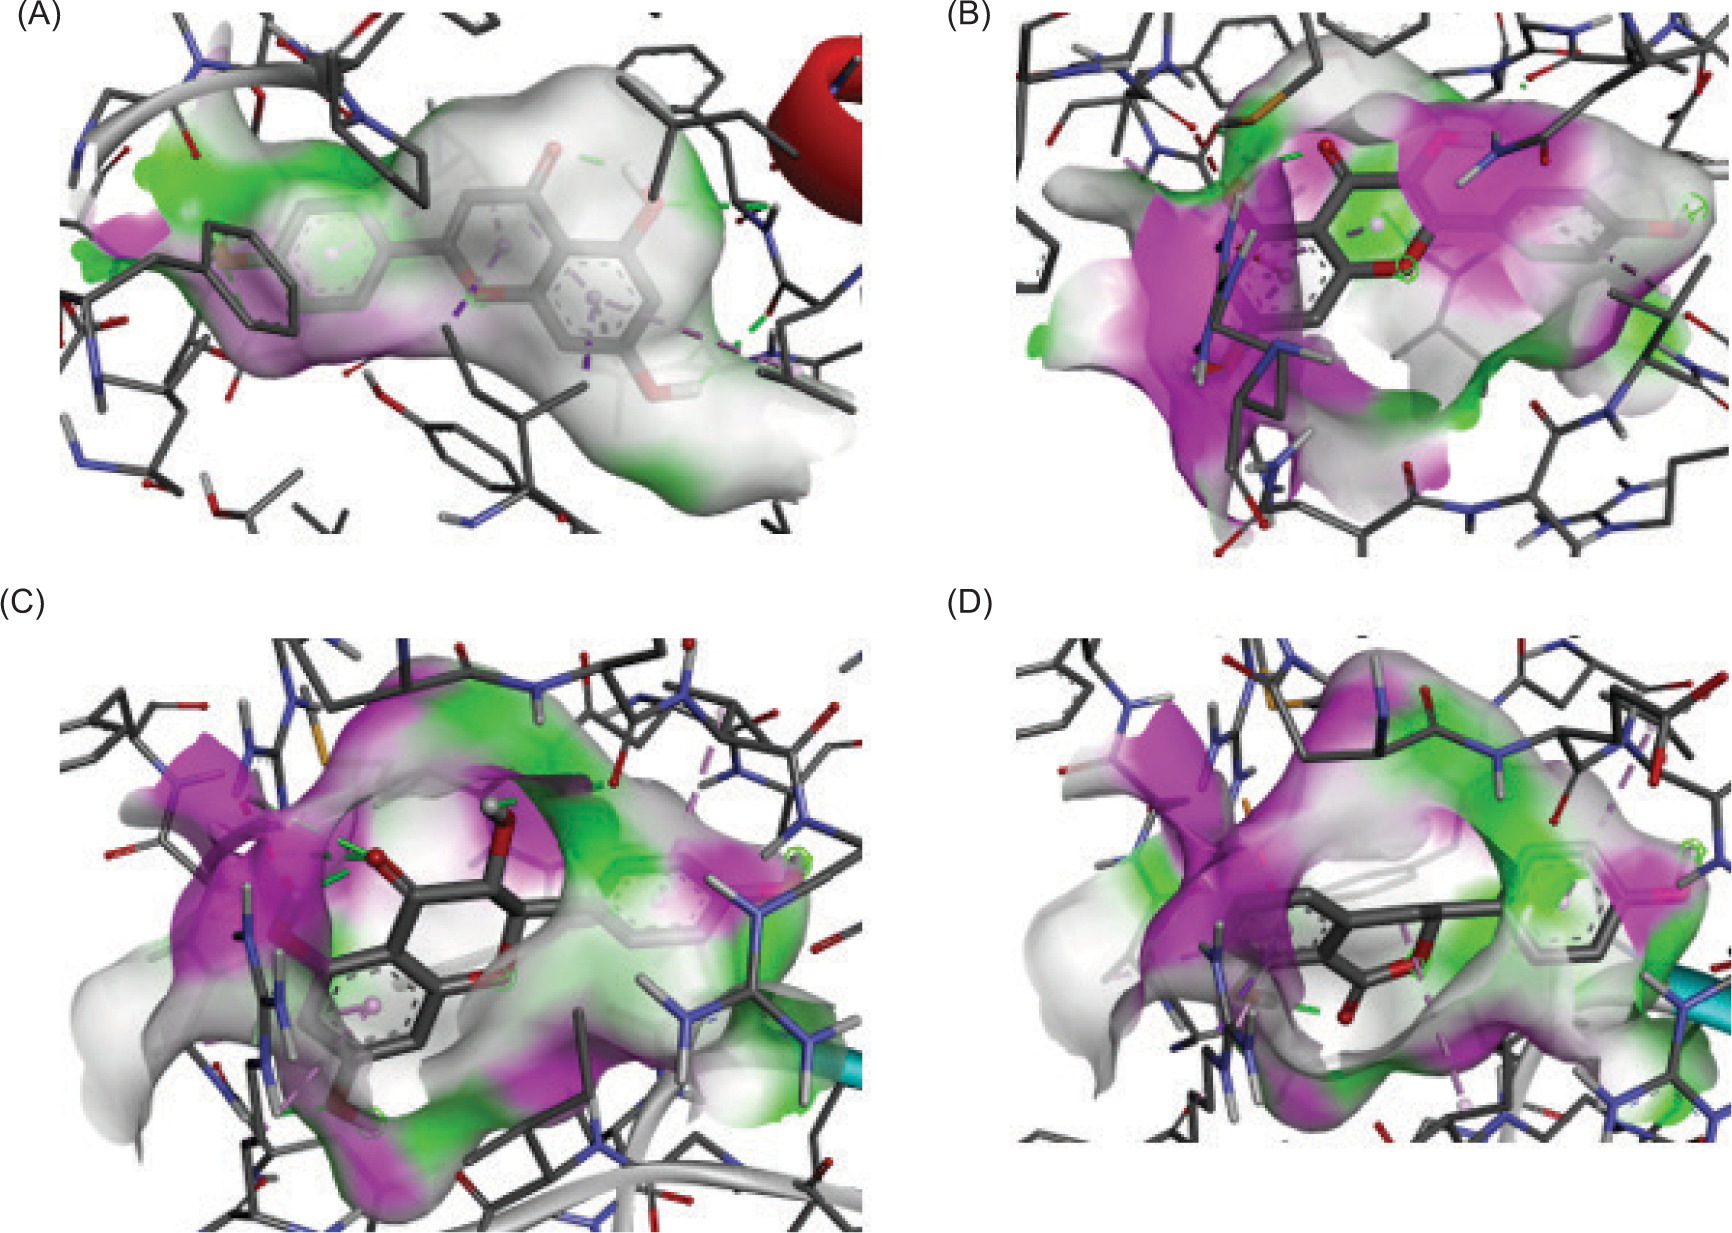
Notably, for MAOB, the control ligand binds mainly through hydrophobic interactions, forming hydrogen bonds with Tyr326 (tyrosine residue at position 326 in a protein) and Pro102. The selected ligand (e.g., apigenin), being more hydrophobic, shifts the interaction profile, possibly reducing polar contacts. However, its hydrogen bonding with Leu164, Thr201, and Glu84 suggests it may possess new polar groups, potentially enhancing MAOB inhibition and neuroprotective efficacy.
In mGlu2, residues Arg454 and Ala322 form hydrogen bonds with the control ligand but engage in hydrophobic interactions with kaempferol and hydrangenol, likely due to their aromatic structures. Dihydrokaempferol, in contrast, mirrors the control’s hydrogen bonding but with shorter bond distances, suggesting better alignment and stronger binding, potentially enhancing its functional activity.
3.5. ADMET and bioactivity
To identify the most promising neuroprotective drug candidates, selected ligands were evaluated based on their physicochemical properties (Table 7), ADMET profiles (Table 8), and bioactivity (Table 9). These evaluations ensured that each ligand possessed favorable characteristics for biological activity, pharmacokinetics, and safety. Physicochemical analysis showed that all compounds complied with standard druglikeness criteria, including Lipinski’s Rule of Five, Veber, Ghose, Egan, Muegge, PAINS, BRENK, and leadlikeness filters. The ligands exhibited total polar surface areas (TPSA) between 60 and 120 Å2, optimal for absorption and permeability, and all maintained bioavailability scores above 0.50 with good solubility, indicating their potential as drug candidates.
Table 7
Physicochemical properties of selected ligand
Table 8
ADMET values of selected ligand.
Table 9
Bioactivity of selected ligands.
ADMET evaluation revealed moderate water solubility (approximately –3 log mol/L) across all ligands. Most compounds demonstrated high intestinal permeability (log Papp > 0.9), with hydrangenol and apigenin showing absorption rates above 80% while kaempferol showed poor Caco-2 permeability. For CNS targeting, hydrangenol showed the highest blood-brain barrier (BBB) permeability, although apigenin exhibited superior CNS penetration, making it more suitable for neuroprotective applications. In the metabolism analysis, all ligands except dihydrokaempferol were predicted as CYP1A2 (cytochrome P450, family 1, subfamily A, polypeptide 2) inhibitors, suggesting a potential risk for drug-drug interactions. Excretion profiling showed moderate clearance values (log mL/min/kg between –1 and 1), and none of the compounds were substrates for the renal OCT2 (organic cation transporter 2), indicating minimal renal excretion involvement.
Toxicity predictions indicated no liver toxicity for any ligand. However, hydrangenol tested positive in the AMES test, suggesting potential genotoxicity and classified as extremely toxic in oral acute toxicity. Kaempferol and dihydrokaempferol were rated as highly toxic and apigenin had the lowest toxicity, indicating a relatively safer profile.
Bioactivity analysis showed that dihydrokaempferol had the strongest antioxidant and anti-inflammatory activities while hydrangenol scored the lowest in these categories. Kaempferol showed the highest antiapoptotic activity while hydrangenol demonstrated the strongest predicted activity in neurotransmitter antagonism and dopamine release. Apigenin showed potential in neurotransmitter uptake inhibition and was the top predicted MAOB inhibitor. Although dihydrokaempferol exhibited the weakest dopamine-related activity, it was the only compound predicted to have potential activity against neurodegenerative diseases. These findings highlight the importance of integrating multiple pharmacological and safety parameters to determine the most viable neuroprotective candidates.
3.6. Molecular dynamics
MD helps confirm whether the ligand-protein interactions seen in docking are realistic, stable, and biologically meaningful under dynamic conditions, making it a critical step in validating potential neuroprotective drug candidates. The binding free energy are shown in Table 10, Figure 5, while RMSD and distance is shown in Figure 6 and Figure 7, respectively.
Table 10
Binding free energy using MM/GBSA analysis.
Figure 5
Time-dependent binding energy profiles of ligand-receptor complexes over 200 ns molecular dynamics simulations. (A) MAOB-apigenin; (B) mGlu2-kaempferol; (C) mGlu2-dihydrokaempferol; (D) mGlu2-hydrangenol.
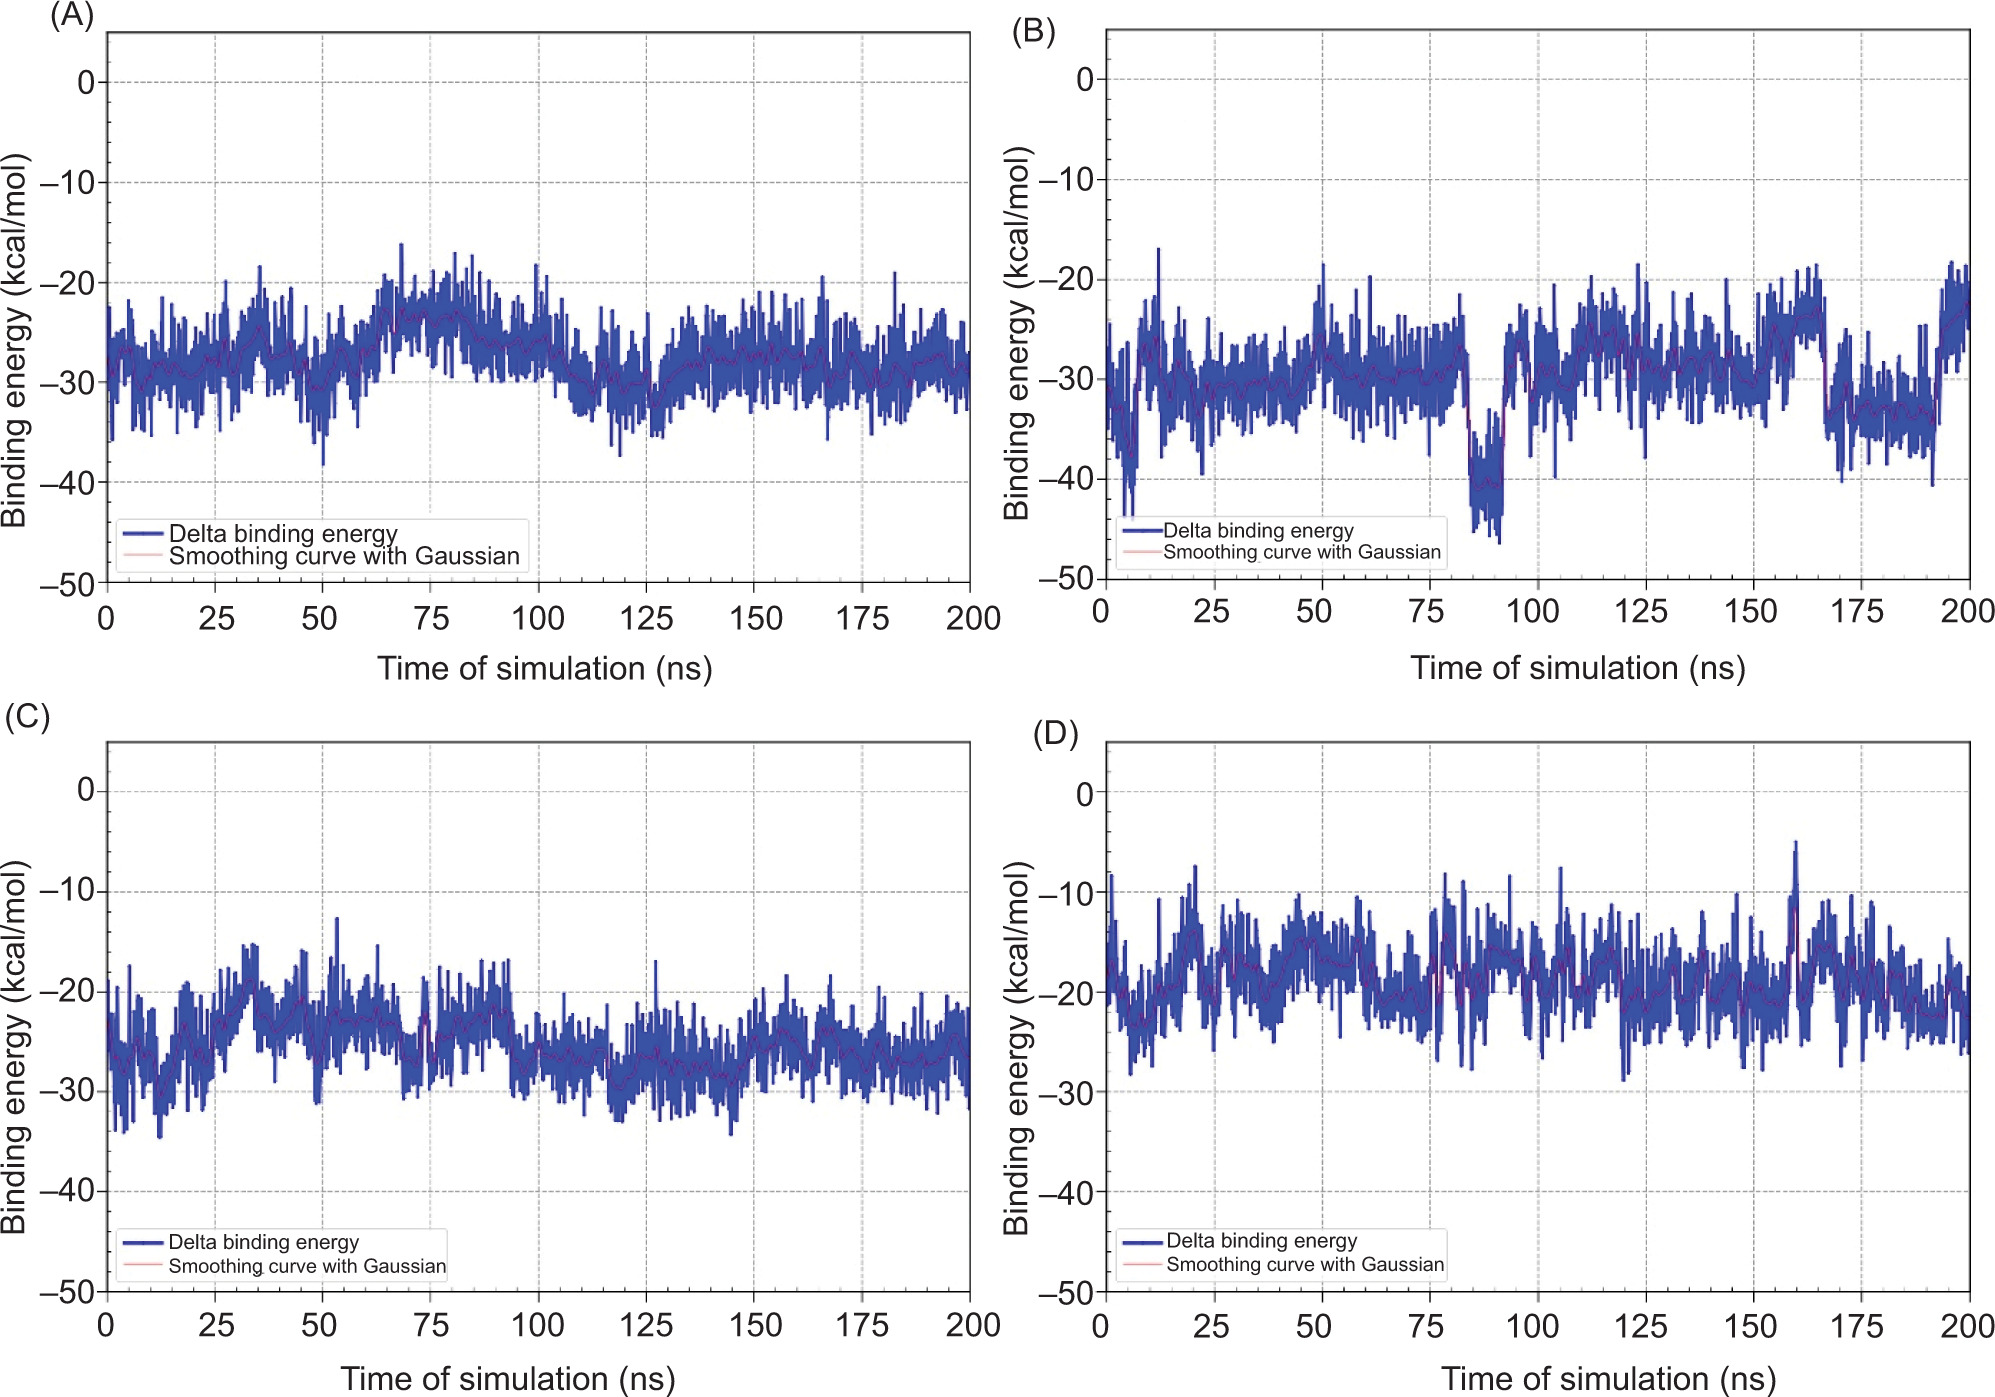
Figure 6
RMSD of C-Alpha atoms for the protein, ligand, and protein-ligand complex during 200 ns molecular dynamics simulations. (A) MAOB-apigenin; (B) mGlu2-kaempferol; (C) mGlu2-dihydrokaempferol; (D) mGlu2-hydrangenol.
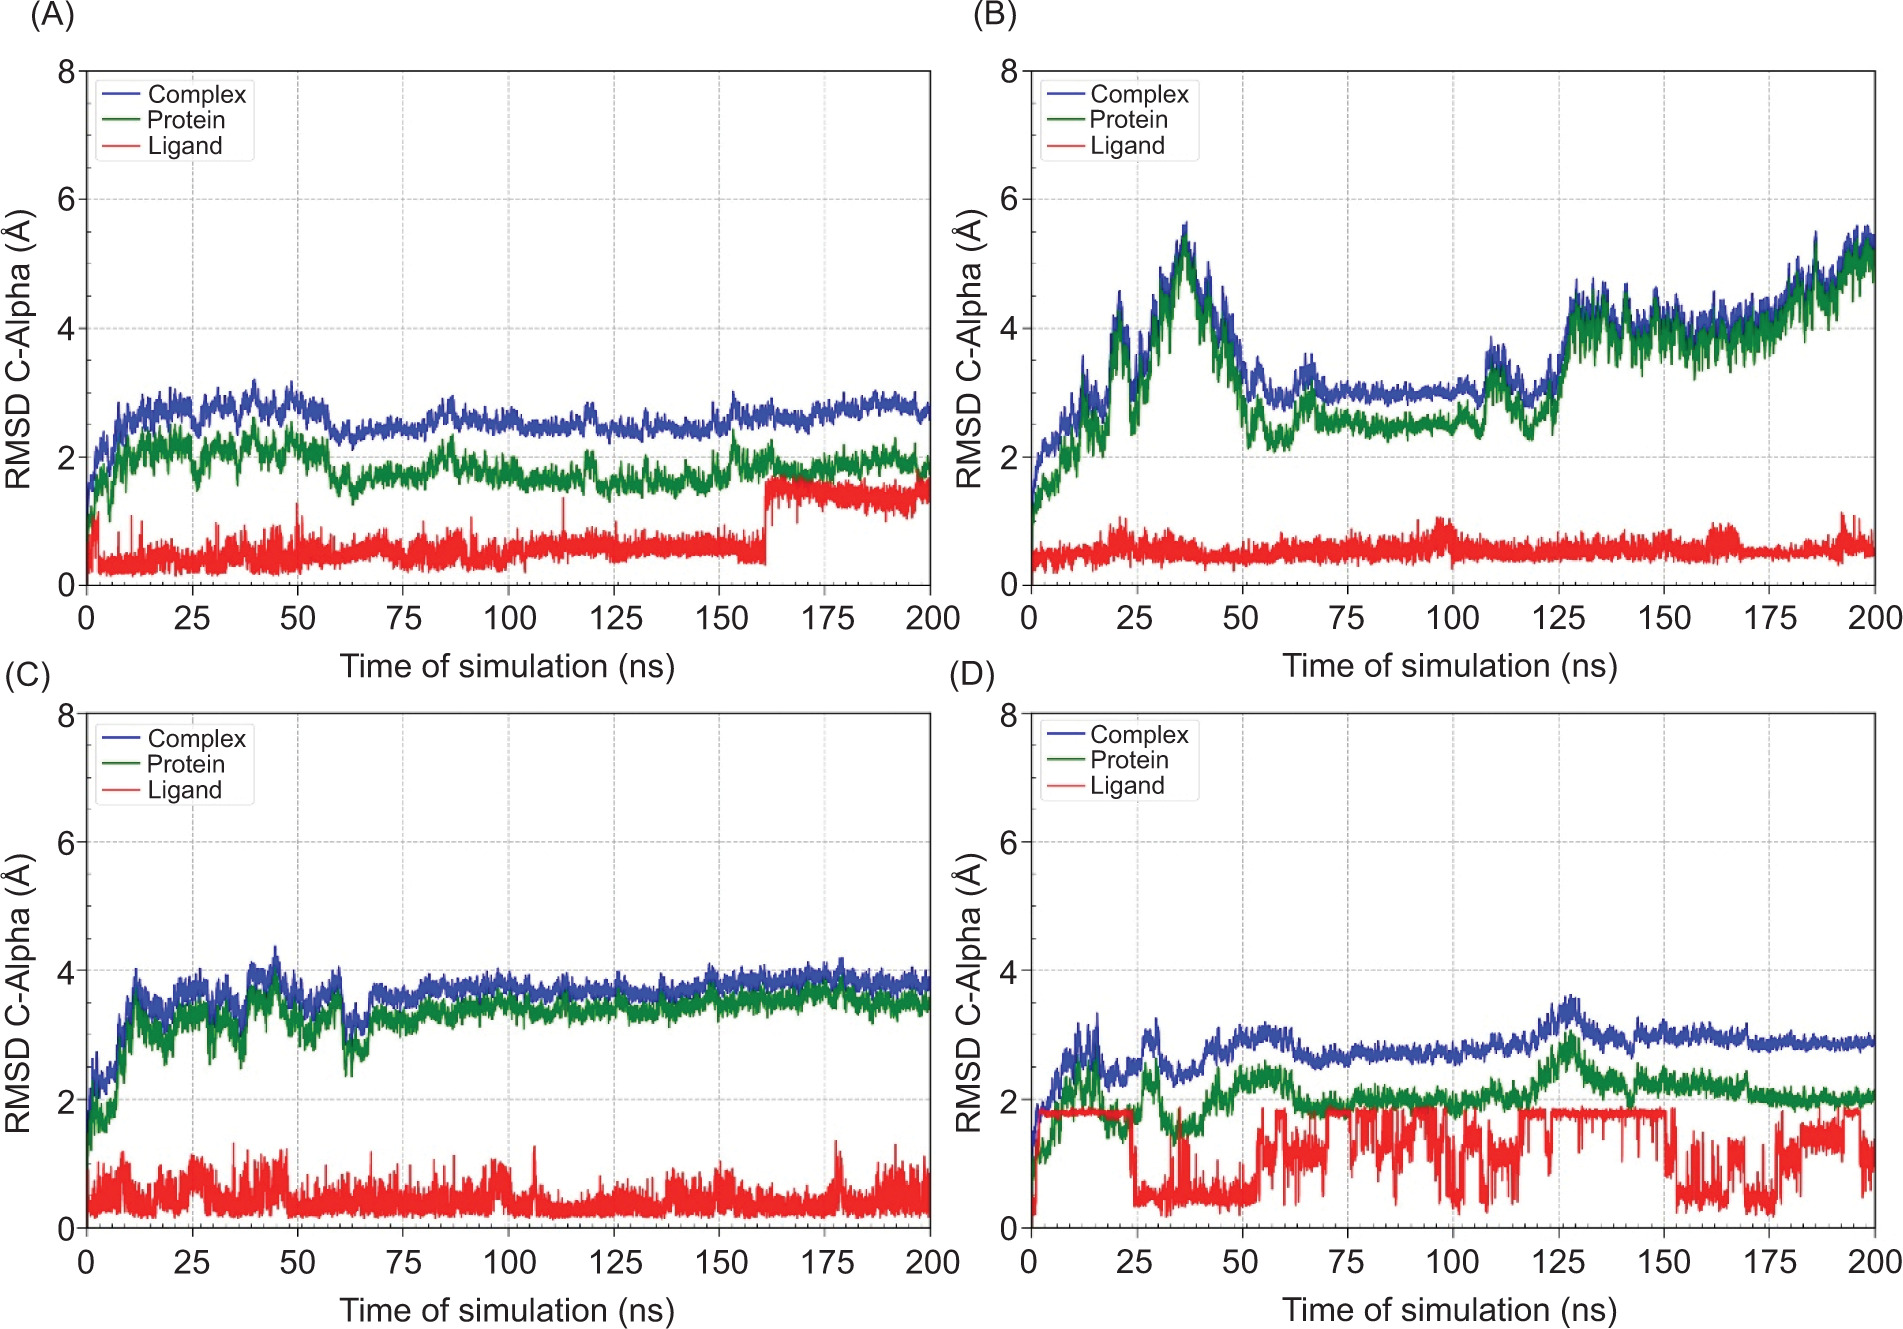
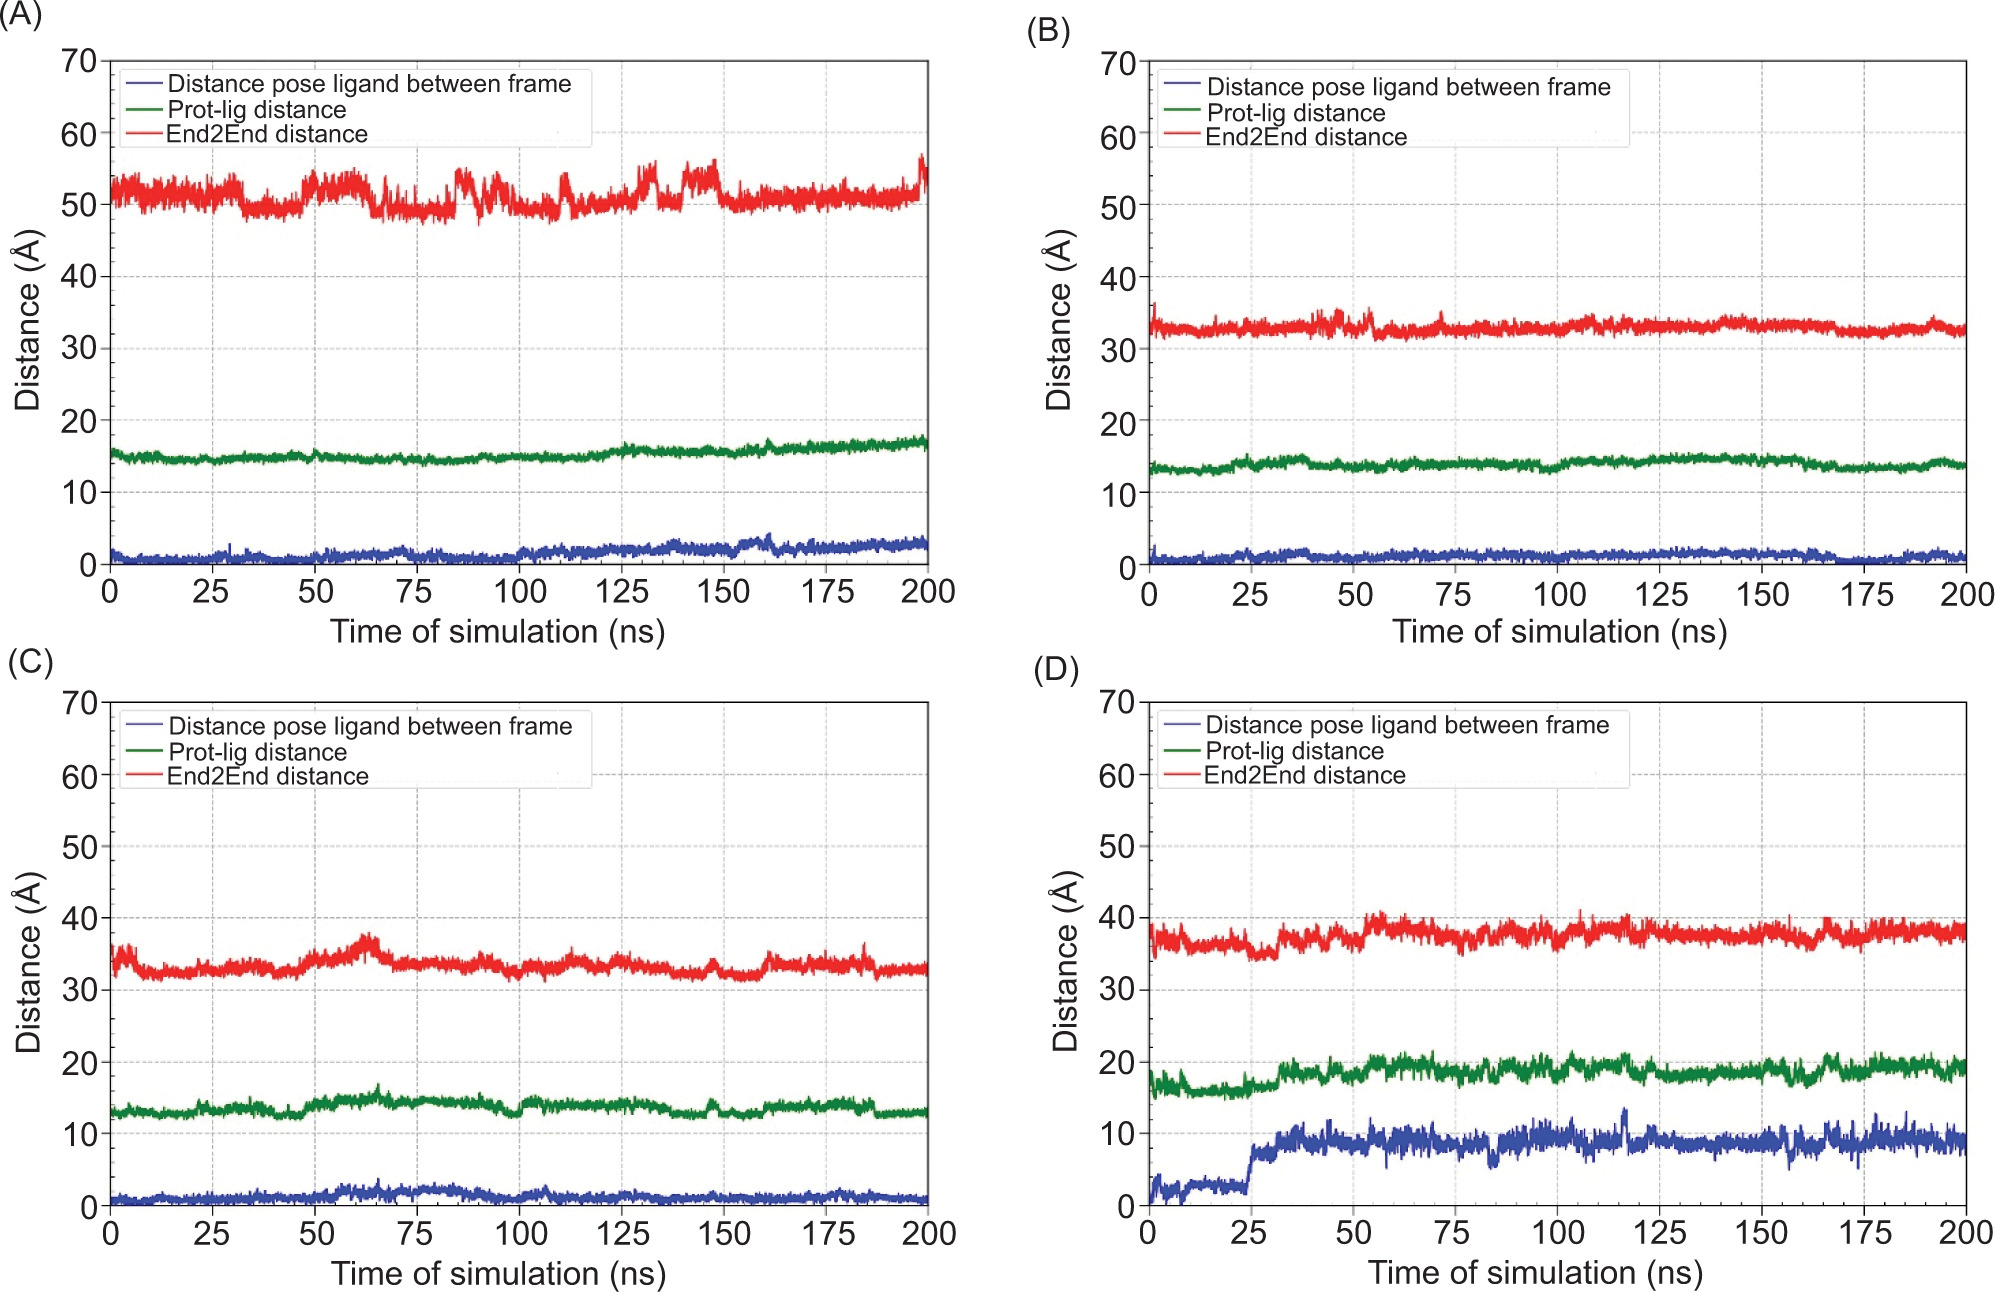
Figure 7
Distance analysis over 200 ns molecular dynamics simulations of the ligand-protein complexes. (A) MAOB-apigenin; (B) mGlu2-kaempferol; (C) mGlu2-dihydrokaempferol; (D) mGlu2-hydrangenol.
As shown in Table 10, all ligands exhibited negative van der Waals interaction energies (VDWAALS), indicating favorable steric interactions, with apigenin and dihydrokaempferol showing the most pronounced effects. Dihydrokaempferol also demonstrated the strongest electrostatic interaction energy (EEL), suggesting that charge-based interactions play a key role in stabilizing the complex. Dihydrokaempferol recorded the highest Generalized Born Solvation Energy (EGB), indicating reduced stability in aqueous environments compared to other ligands. In contrast, hydrangenol and kaempferol showed lower EGB values, reflecting more favorable polar solvation while apigenin exhibited moderate solvation energy. Nonpolar solvation energy (ESURF) was the most favorable for apigenin and dihydrokaempferol, suggesting better compatibility with nonpolar solvents.
Despite its gas-phase stability reflected by the most negative ΔGgas, dihydrokaempferol exhibited the highest overall solvation energy (ΔGsolv), indicating lower solubility in water, whereas hydrangenol with the lowest ΔGsolv appeared to be the most readily solvated in aqueous conditions. All ligands displayed negative total binding free energies (ΔGtotal), suggesting thermodynamically favorable interactions, with dihydrokaempferol showing the most favorable ΔGtotal, followed by apigenin, identifying both as the most promising candidates in terms of binding affinity and complex stability. To further evaluate the stability of these interactions over time, binding energy fluctuations were monitored throughout the 200 ns simulation, as illustrated in Figure 5.
Based on Figure 5, dihydrokaempferol exhibited a lower average binding energy, approximately from –30 to –40 kcal/mol, with higher fluctuations observed between 75 ns and 150 ns. While dihydrokaempferol showed the lowest average binding energies, hydrangenol demonstrated the most consistent binding energy profile with minimal fluctuations over time. This indicates that hydrangenol forms a moderately strong yet highly stable complex with the receptor, suggesting it may be the most favorable ligand in terms of binding stability.
RMSD analysis of the protein, ligand, and the complex (Figure 6) aims to evaluate the dynamic stability of the protein-ligand complexes during the 200 ns MD simulation. The RMSD analysis highlights that hydrangenol formed the most stable protein-ligand complex, both in terms of protein structure and ligand retention. In contrast, dihydrokaempferol caused greater structural deviation in the complex despite maintaining its position within the binding site.
To further assess ligand stability within the binding pocket, distance analyses were performed over the 200 ns MD simulation (Figure 7). Distance analysis over 200 ns MD simulations revealed that dihydrokaempferol exhibited the most stable binding, with minimal pose deviation and consistent proximity to the binding site. Hydrangenol also maintained a stable interaction while kaempferol showed notable pose fluctuations, suggesting less stable binding. The protein-ligand distance remained steady across all complexes, although kaempferol displayed minor variation. Notably, apigenin exhibited slight fluctuations in the end to end distance, indicating potential system-level conformational changes.
4. DISCUSSIONS
Neurodegenerative diseases such as Alzheimer’s and Parkinson’s present a growing global health concern, yet effective treatments remain limited. As a result, natural products with neuroprotective properties—particularly compounds derived from Amaranthus—have gained attention for their antioxidant and anti-inflammatory potential (Kosmopoulou et al., 2024; Peter and Gandhi, 2017). Through the PPIN analysis, key neurodegeneration-related targets were identified, providing insights into how these bioactive compounds could modulate disease-associated pathways.
PPIN analysis of 27 neuroprotective-related proteins identified several hub targets, with D2 emerging as the most central protein, highlighting its essential role in dopaminergic transmission, synaptic plasticity, and neuronal survival (Sung et al., 2006; Zhou et al., 2022). 5HT1A also displayed high centrality, reflecting its involvement in neurotransmitter responses and its role in maintaining synaptic stability across cholinergic and GABAergic systems (Demos-Davies et al., 2024; Fang et al., 2021). Similarly, GABAb receptors—particularly GABBR2—were highlighted for their bridging role in neuroprotective signaling pathways, consistent with their known function in excitotoxicity suppression and neuronal regulation (Bi et al., 2020; Chen et al., 2019). Metabotropic glutamate receptors mGlu2 and mGlu3 were also identified as central to maintaining the balance of excitatory and inhibitory signaling (Srivastava et al., 2020).
Beyond these, the network analysis pointed to additional targets with neuroprotective relevance, including SERT, CB1, MORs, and MAOB. SERT regulates serotonin signaling that is critical for mood regulation and cognitive processes (Haase and Brown, 2015), while CB1 and MORs are known to modulate inflammation and β-amyloid toxicity, supporting neuronal integrity (Gargano et al., 2021; Wang et al., 2015). MAOB, although less central, plays a dual role in neurotransmitter metabolism and oxidative stress, and remains a pharmacological target for Parkinson’s therapy (Elkamhawy et al., 2021; Kaur et al., 2023).
To complement this systems-level insight, molecular docking was conducted to predict ligand-target interactions for Amaranthus-derived compounds. We chose to conduct molecular docking first to explore the binding potential of all compounds without prematurely discarding compounds based on ADMET properties. After docking, we performed ADMET and bioactivity assessments. Finally, MD simulations were conducted to evaluate the stability and binding affinity of the ligand-protein complexes.
Docking identified apigenin, dihydrokaempferol, hydrangenol, and kaempferol as promising candidates, with reference ligands used to validate the method. Apigenin was identified as a strong MAOB inhibitor, likely due to its chromone-based structure that favors selective and stable hydrogen bonding (Mateev et al., 2023). Meanwhile, kaempferol, dihydrokaempferol, and hydrangenol were predicted to act on mGlu2 receptors, although lacking the typical orthosteric features of amino and carboxyl groups (Schoepp et al., 1999). Their structures, rich in hydroxyl and lactone moieties, suggest potential activity as positive allosteric modulators rather than direct agonists (Sheffler et al., 2011). Experimental validation is needed to confirm the stability and biological relevance of these predicted interactions.
ADMET predictions further evaluated these candidates, confirming that all four ligands met essential criteria for oral bioavailability, permeability, and blood-brain barrier penetration. Notably, apigenin exhibited a safer and more favorable pharmacokinetic profile, while dihydrokaempferol was highlighted for its strong predicted bioactivity, particularly as an antioxidant and anti-inflammatory agent. Hydrangenol’s favorable BBB penetration was counterbalanced by its potential toxicity. Kaempferol also displayed acceptable absorption but a comparatively weaker safety and bioactivity profile.
To validate docking results under dynamic conditions, MD simulations were conducted over a 200 ns timescale to evaluate the stability of ligand-protein complexes. Binding free energies were estimated using the MM/GBSA method, an efficient end-state approach that calculates binding affinity from MD snapshots by analyzing intermolecular interactions. Solvent effects were incorporated via the generalized Born model, with nonelectrostatic contributions derived from solvent-accessible surface area (Taylor and Ho, 2023). RMSD analyses were performed for proteins, ligands, and complexes. Protein RMSD values reflect conformational stability, whereas ligand RMSD indicates the stability of ligand binding within the active site. Lower RMSD values correspond to more stable systems (Sharma et al., 2022).
Among the ligands, dihydrokaempferol showed the most favorable binding free energy (ΔGtotal = –29.803 kcal/mol), suggesting high thermodynamic affinity. However, its high solvation penalty (ΔGsolv = 29.963 kcal/mol) implies significant desolvation costs, aligned with RMSD fluctuations observed between 75 ns and 150 ns. Hydrangenol, though slightly weaker in binding affinity (ΔGtotal = –25.415 kcal/mol), demonstrated the most consistent interaction, with stable RMSD and minimal energy fluctuations, indicating strong persistence within the binding pocket. Apigenin also exhibited favorable binding (ΔGtotal = –27.675 kcal/mol), supported by stable nonpolar solvation and van der Waals contributions, despite minor structural adjustments later in the simulation. In contrast, kaempferol had the weakest binding (ΔGtotal = –18.852 kcal/mol) and highest structural deviation, suggesting an unstable complex.
Based on the combined evaluation of docking, ADMET, bioactivity, and MD, dihydrokaempferol emerged as the most promising neuroprotective candidate due to its strong binding affinity, high bioactivity, and interaction with mGlu2, a key hub in the neuroprotective network. However, this strength is slightly limited by its less favorable pharmacokinetic profile and binding fluctuation. In contrast, apigenin demonstrated better pharmacokinetics and safety but targeted MAOB, a less central protein in the network. Overall, dihydrokaempferol offers the best neuroprotective potential, though further optimization is needed to address its pharmacokinetic limitations.
5. CONCLUSIONS
This study identifies D2, mGlu2, 5HT1A, GABAb, mGlu3, SERT, CB1, MORs, and MAOB as key protein targets involved in the neuroprotective effects. Molecular docking highlights apigenin as a potential MAOB inhibitor, whereas dihydrokaempferol, hydrangenol, and kaempferol show strong interactions with mGlu2. Among these, dihydrokaempferol emerges as the most promising neuroprotective candidate based on its strong binding affinity, high predicted bioactivity, and stable interactions in MD simulations despite pharmacokinetic limitations that warrant further optimization.
These findings lay the groundwork for further investigation of Amaranthus-derived compounds as potential adjunctive therapies for neurodegenerative disorders. Nevertheless, experimental validation is required to confirm the stability and biological relevance of these interactions. Future studies should include in vitro assays such as enzyme inhibition or neuroprotection assays using neuronal cell lines to verify the predicted interactions and biological activities. In addition, in vivo studies using animal models of neurodegenerative or mood disorders could be conducted to assess the pharmacodynamic and pharmacokinetic properties of the most promising compounds. These experimental validations will be essential to confirm the therapeutic potential and safety profiles of the identified ligands and to support their development as neuroprotective agents.
Acknowledgment
This article is part of the Masters Education to Doctorate for Excellence Undergraduate (Pendidikan Magister menuju Doktor untuk Sarjana Unggul [PMDSU]) research. In addition to the funding, the authors would like to thank Directorate General of Higher Education, Research, and Technology, Ministry of Education, Culture, Research, and Technology for their support throughout the project through PMDSU scholarship program.
Funding
This article was funded by the Directorate General of Higher Education, Research, and Technology, Ministry of Education, Culture, Research, and Technology for their financial support throughout the project, in accordance with the 2024 Research Program Implementation Contract Number 027/E5/PG.02.00. PL/2024, dated 11 June 2024.
Authors Contributions
Screening and docking, writing—original draft, final approval of the version to be submitted: M.S.P.; Conceptualisation and design of the study, validation, writing, review & editing, final approval of the version to be submitted: I.B.; Protein-protein network analysing, writing—original draft, final approval of the version to be submitted: R.F.; Molecular dynamics simulation, writing—original draft, final approval of the version to be submitted: S.T.W.; Validation, writing—review & editing, final approval of the version to be submitted: W.A.K.; Calidation, writing, review & editing, final approval of the version to be submitted: T.; Validation, writing, review & editing, final approval of the version to be submitted: B.P.P.