

INTRODUCTION
Cellular metabolism has as its main function the production of energy for the proper functioning of the body (Deberardinis & Thompson, 2012; Yang & Quayle, 2021). However, this important process is also the main source of production of reactive species (free radicals or their precursors) (Lobo, Patil, Phatak, & Chandra, 2010). Thus, the physiological balance is maintained by the presence of antioxidant systems, including superoxide dismutase, glutathione peroxidase, glutathione reductase, catalases, retinol, tocopherols, ascorbic acid, beta-carotene and glutathione, which are responsible for removing reactive species in the biological system (Poljsak, Šuput, & Milisav, 2013). The disruption of this steady state in favor of reactive species favors cell damage called oxidative stress, a phenomenon responsible for the oxidative damage of biomolecules such as deoxyribonucleic acid, proteins, carbohydrates and lipids in the cell membrane (Birben, Sahiner, Sackesen, Erzurum, & Kalayci, 2012).
Oxidation of biomolecules is an important risk factor in the pathophysiology of different chronic diseases (Mahdi-Pour, Jothy, Latha, Chen, & Sasidharan, 2012) . The contribution of free radicals and other reactive species in the pathophysiology of diseases such as diabetes, cancers, asthma and inflammatory arthropathies has been well studied and established (Maritim, Sanders, & Watkins, 2003; Matough, Hamid, Alwahaibi, & Mohamed, 2012). Thus, it is assumed that the ingestion of products containing in their composition, antioxidant substances can reverse the harmful effect of free radicals. Therefore, several products of vegetable origin, natural or synthetic compounds with such properties have been widely studied in recent years, due to their possible protective effects against oxidative stress. Among them we can mention phenolic compounds (flavonoids, phenolic acids and tannins), vitamins (Asc and α-tocopherol) and carotenoids (β-carotene) (Augusto et al., 2014; Banjarnahor & Artanti, 2005; Cendrowski, Królak, & Kalisz, 2021). Most of these have also been studied from a clinical point of view, for the treatment of diseases associated with oxidative stress (Gao, Yang, & X, 2019; Packer, Weber, & Rimbach, 2001; Padayatty et al., 2003).
Plant foods, medicinal plants and seaweed have also been and continue to be the subject of many studies due to their ability to produce and store secondary metabolites with antioxidant capacity (Cumbane et al., 2020; Cumbane, Mathusse, & Madivate, 2021), including phenolic acids and polyphenols. The antioxidant mechanism of these compounds contributes significantly to the reduction of oxidative processes in plants and animals, a process responsible for several cellular complications (Minatel et al., 2017). Compounds such as GA (1), nPG (2), PyG (3) and other derivatives have shown numerous applications in the pharmaceutical and food industry. When used as an additive, GA can inhibit the deterioration of fats and oils in many edible products (Gao et al., 2019), and contribute in a certain way to preserve food quality and to reduce the development of diseases associated with oxidative stress. Tannins, including TA (4), are potent antioxidant, anticancer, antimicrobial and immunomodulatory agents. The anticancer and antimutagenic properties of tannins seem to be linked to their antioxidant properties, which are important in protecting cells against oxidative stress (Bele, Jadhav, & Kadam, 2010; Chung, Wong, Wei, Huang, & Lin, 1998). Qtn (5) and its glycosylated analogue, Rut (6), have numerous biological properties, including anti-cancer, anti-inflammatory, antiviral and antioxidant (Li et al., 2016).
Asc (7), a metabolite of vegetable origin best known for its vitamin, antioxidant, anti-inflammatory, anti-cancer, antibacterial and antiviral properties (Yussif, 2018). BHT (8), a synthetic antioxidant widely used in the food and cosmetics industry (Babich, 1982; Yehye et al., 2015). However, there are few reports on the effects of BHT on biological systems. Some reports of animal studies point to beneficial and toxic effects, including reducing the toxicity of some chemical and physical carcinogens and increasing others. Negative effects on lungs, kidneys and myocardial cells have also been described (Babich, 1982). Trolox (9), a potent synthetic antioxidant, water-soluble derivative of α-tocopherol. It has been widely used as a standard antioxidant in studies of plant extracts from food and medicinal plants (Frangu et al., 2020; Litescu, Eremia, Tache, Vasilescu, & Radu, 2014).
Gladiolus dalenii (family Iridaceae), is a plant native to the region of sub-Saharan Africa, better known as Halaiungwa in southern Mozambique, have been indicated in traditional medicine for the treatment of various diseases, including diarrheal, dysenteric, gonorrhea, dysmenorrhea, diabetes, ear and eye infections, paralysis, muscle spasms, to regularize the menstrual cycle, among other ailments (Munyemana, Mondego, & Cumbane, 2013). Many species of this genus have been or are being studied with regard to their chemical constitution and biological activity (Adediwura & Kio, 2008; Odhiambo, Siboe, Lukhoba, & Dossaji, 2009). Thus, some chemical classes and some substances of medicinal interest have been isolated and reported in recent years, but very little is known about the pharmacological potential of these substances (Abdessemed, Fontanay, Duval, Laurain-Mattar, & Dibi, 2011) . Several works on antioxidant activity of foods and plant extracts have been developed and published in different scientific literatures. In these works, the antioxidant activity of a complex matrix is measured and compared with the activity of any of the pure compounds whose antioxidant effect is known. However, it seems that there are still no clear criteria to classify the antioxidant efficacy into strong, moderate or weak, so the knowledge of the effectiveness of the antioxidants commonly used in these tests can help to select the standard for predicting the antioxidant efficacy of medicinal plants or food.
MATERIALS AND METHODS
Collection and identification of herbal materials
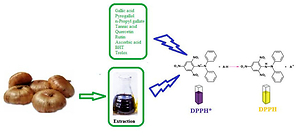
The bulbs of Gladiolus dalenii (Figure 1) were collected in Bilene district (Gaza, Mozambique) and the botanical confirmation of the species was done at the Instituto de Investigação Agrária de Moçambique (IIAM) (specimen number 48529).

Chemicals and equipment
Ethyl acetate (99.8%), Methanol (99.8%) were provided by Ubuntu Chemical and Lab Supplies (Alberton, South Africa). Gallic acid (≥ 98%), Sodium nitrite (≥97%), Ascorbic acid (99.5%), Rutin (≥94%), Pyrogallol (≥98%), (±)-6-Hydroxy-2,5,7,8-tetramethyl-chroman-2-carboxylic acid (97%), 2,2-diphenyl-1-picrylhydrazyl (85%), were provided by Sigma-Aldrich (Pty) Limited (Kempton Park, South Africa). Quercetin hydrate (95%) was provided by Acros Organics (New Jersey, USA). Folin-Ciocalteu (stock solution) was provided by Pehedi Medical & Lab Suppliers (Johannesburg, South Africa). Aluminum chloride (99%), Sodium carbonate (99.9%), were provided by Merck (Darmstadt, Germany). Tannic acid (88%) was provided by Sisco Research Laboratories Pvt. Ltd. (India, Maharashtra), Propyl gallate (99.5%), Sodium hydroxide (≥99%) were provided by Panreac Química SA (Spain, Barcelona). Butylated hydroxytoluene (99.5%), was provided by Roig Farma, SA (Spain, Barcelona). Spectrophotometric determinations were made using a spectrophotometer UV-VIS (Thermo Scientific Orion AquaMate 8000, USA).
Sample preparation and extraction
The samples were peeled, washed, sectioned and dried in a hot air oven (The Scientific Group®, Series 9000) at 45o C for 7 days. The crude extract was prepared by percolation in methanol - distilled water (90:10) of the powder, followed by filtration on filter paper (Whatman 1). The ethyl acetate fraction was obtained by liquid-liquid partition of a portion of the crude extract (dissolved in methanol: water 3/7). The crud extract and ethyl acetate fraction were concentrated using a rotary evaporator (BUCHA®, Germany) at 50o C.
Estimation of total phenolic content (TPC)
The TPC was measured spectrophotometrically using the Folin-Ciocalteu (FC) method described by Ismael, Dessalegn, and Fereja (2021), with some modifications, In brief, 500 µL of extract (1 mg/mL) (dissolved in methanol) was mixed with 500 µL of FC reagent (diluted 10 times). After 5 minutes, 1 mL of a 7.5% sodium carbonate and 3 mL of distilled water were added and mixed thoroughly. The mixture was kept at room temperature for two hours, followed by reading the absorbance at 760 nm. The TPC was determined from the extrapolation of the samples' absorbance on the gallic acid calibration curve (y = 0.0113x + 0.1463; R² = 0.9993) prepared by the method described above and expressed as milligrams of GA equivalents (mg GAE) per gram of dry extract (g DE). All tests were performed in three repetitions and the result calculated as mean ± standard deviation.
Estimation of total flavonoids content (TFC)
TFC was measured following a method described by Ismael et al. (2021), with some modifications, briefly, 500 µL of extract (1mg/mL), 2.5 mL of distilled water, 250 µL (5%) of NaNO2 were mixed. After 6 min, 250 µL of 2% AlCl3 reagent (methanol solution) was added. The mixture was incubated for 5 minutes at room temperature, followed by the addition of 1 mL of NaOH (1 M). The TFC was determined from the extrapolation of the samples' absorbance on the quercetin calibration curve ((y = 0.0058x + 1.425; R2 = 0.998) prepared by the method described above and expressed as milligrams of Qtn equivalents (mg Qtn) per gram of dry extract (g DE). All tests were performed in three repetitions and the result calculated as mean ± standard deviation.
DPPH radical scavenging assay
The antioxidant efficiency of GA, PyG, nPG, TA, Qtn, Rut, Asc, BHT, Trolox, crude methanol extract (MCE) and ethyl acetate fraction (EAF) of the Gladiolus dalenii species was measured by the DPPH free radical scavenging method. Sample and DPPH (100 µM) free radical solutions were prepared in methanol. Antioxidant activity was determined by mixing 500 µL of each sample at different concentrations with 3.5 mL of DPPH. The reference DPPH solution (A0) was prepared by mixing 3.5 mL of DPPH with 500 µL of methanol. The absorbance of the remaining DPPH (As) and the reference DPPH (A0) were read at 517 nm after 30 minutes of incubation in the dark. The percentage of DPPH inhibition (DPPH inhibition) was calculated using formula (1) and the values used to plot the calibration curve used in the calculation of the efficient concentration value (EC50, the concentration of antioxidants necessary to decrease the initial DPPH absorbance by 50%). The effective concentration equivalent (EEC50) was determined using equation (2) and expressed as micro mol equivalent of GA per gram of dry sample (µmol GAE/g DE).
Statistical Analysis
All assays were performed in three independent experiments and results were calculated as mean ± standard deviation. Statistical difference between samples was tested by one-way analysis of variance (ANOVA) and Tukey's Test using GraphPad Software 9.0 (San Diego, USA). The difference in mean values was considered significant for p < 0.05.
RESULTS AND DISCUSSION
The antioxidant activity of foods and medicinal plant extracts can be monitored by a variety of assays with different mechanisms, including hydrogen or electron transfer for the reduction of radical (ABTS radical cation decolorization assay and DPPH scavenging activity) or ionic species (Ferric Reducing Antioxidant Power Assay, Phosphomolybdenum method, Cupric ion reducing antioxidant capacity method) and compared with the activity of one or more compounds (natural or synthetic) whose antioxidant activity has been proven. In the present study, the antioxidant activity of nine substances commonly used as standards in antioxidant capacity assays of plant extracts was evaluated using the DPPH free radical scavenging method and compared with the activity of MCE and EAF extracts from G. dalenii bulbus. The Figure 3; Figure 2 and Figure 4 shown structures of GA (1), nPG (2), PyG (3), TA (4), Qtn (5), Rut (6), Asc (7), BHT (8) and Trolox (9). The Figure 5 shows the dose–response curves of GA, PyG, TA (a), nPG, Qtn, Asc, Rut, Trolox (b), BHT (c), MCE and EAF (d). Table 1 shows the half maximal effective concentration (EC50) and effective equivalent concentration (EEC50) values for all samples, TPC and TFC for the Gladiolus dalenii extracts.


Figure 5
Dose–response curves of GA, PyG, TA (a), nPG, Qtn, Asc, Rut, Trolox (b), BHT (c), MCE and EAF (d)
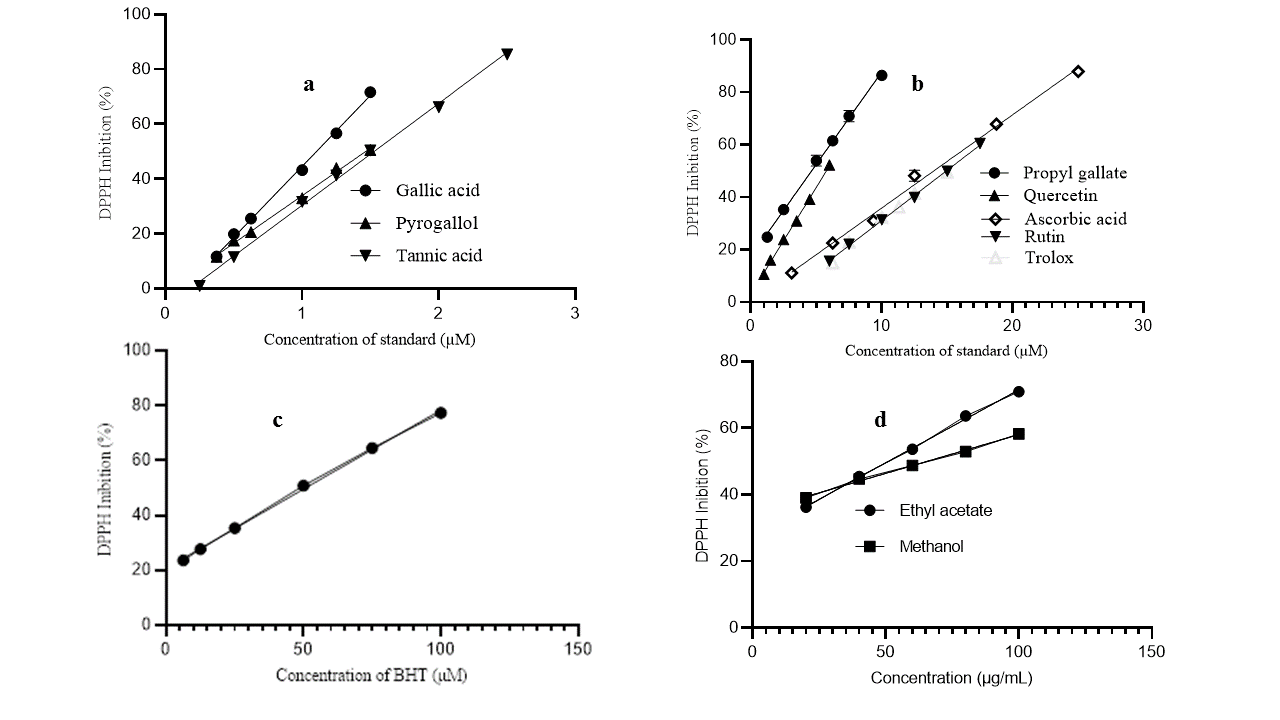
Table 1
TPC, TFC, Half maximal effective concentration and Effective equivalent concentration
[i] *The mean difference is not significant at level 0.5. EEC50 (µmol GAE/gDE) is the effective equivalent concentration in µmol of GA equivalent per gram of dry sample. EC50 is the Half maximal effective concentration in µg/mL. TPC is Total phenolic content in mg of GA equivalent per g of dry extract and TFC is total flavonoid content in mg of Qtn equivalent per g of dry extract.
Total phenolic and flavonoid content
Phenolic compounds (flavonoids, phenolic acids and tannins), ascorbic acid, tocopherols and carotenoids are the main active agents active by the antioxidant effect of medicinal plants or vegetable foods (Tungmunnithum, Thongboonyou, Pholboon, & Yangsabai, 2018). Thus, the quantification of these compounds is an indispensable parameter in predicting the antioxidant capacity of plant extracts. Although the quantification of phenolic compounds by the Folin-Ciocalteu method may suffer interference in the present of ascorbic acid and other reducing agents, the total phenolic content of MCE and its EAF fraction determined by this method, while the total flavonoids were quantified by the method of complexation with aluminum chloride. GA and Qtn were used as standards and results expressed as mg gallic acid equivalents (mg GAE) per gram dry extract (g/DE) or mg quercetin equivalents (mg Qtn) per gram of dry extract (g / DE). The TFC does not have general variations in both extracts, while the TPC value for the MCE (395.350 ± 0.860) and an EAF (427.290 ± 0.470) presents relevant variations for the p value ˂ 0.05. This increase in phenolic content observed for an EAF, there must be greater affinity of the antioxidants present in the MCE for the ethyl acetate solvent. The extraction techniques aim not only to extract the active compounds from the plant matrix, but also provide a certain selectivity and sensitivity of the analytical methodology used for the identification, quantification and bioactivity tests, due to the increase in the concentration of the compounds of interest in the solution extractive (Pisoschi, Pop, Cimpeanu, & Predoi, 2016). The extractive efficiency of phenolic compounds can be affected by solvent polarity, as cases of TPC variations in the same plant material using solvents with different polarity are exhaustively reported in different literatures (Cumbane & Munyemana, 2017; Ghazzawi et al., 2021; Pisoschi et al., 2016). In our study, liquid-liquid extraction done on the crude extract with an intermediate polarity solvent (ethyl acetate) revealed an increase in TPC. These results corroborate the studies carried out by (Nakamura, Ra, Jee, & Kim, 2017) and Cumbane et al. (2017). However, some authors have reported an increase in phenolic compounds in solutions extracted from the same plant drug, associated with the use of highly polar solvents (Ammar et al., 2018). These variations can be explained by the fact that some phenolic compounds are present in conjugation with one or more sugar units, forming what is called heteroside, compounds that are very soluble in a high polarity solvent, including water.
DPPH radical scavenging activity
The DPPH free radical scavenging capacity, described by the EC50 values (Table 1) for the pure compounds, varies according to the order: GA (1.110 ± 0.00 µM)> PyG (1.470 ± 0.00 µM)> TA (1.530 ± 0.01 µM)> nPG (4.640 ± 0.07 µM) > Qtn (5.770 ± 0.10 µM) > Asc (13.97 ± 0.16 µM) = Trolox (14.86 ± 0 .09 µM) > Rut (14.92 ± 0.07 µM) > BHT (50.72 ± 0.11 µM). The lower EC50 value indicates greater DPPH free radical scavenging capability. GA and its derivatives take a prominent place when compared to the other compounds studied. The antioxidant capacities of GA and PyG against the DPPH free radical were measured at concentrations of 0.375, 0.500, 0.625, 1.000, 1.250 and 1.500 µM, and a significant linear correlation was found in the inhibition percentages, which ranged from 11.718 ± 0.313 – 71.656 ± 0.001% and 11.584 ± 0.146 - 50.553 ± 0.068%, respectively.
The antioxidant capacity of TA was measured at concentrations of 0.500, 1.000, 1.250, 1.500, 2.000 and 2.500 µM, with significantly linear inhibition values in the range of 11.447 ± 0.669 - 85.402 ± 0.055%. While the antioxidant efficacy of nPG was measured at concentrations of 1.250, 2.500, 5.000, 6.250, 7.500 and 10.000 µM, with inhibition values ranging from 24.784 ± 1.081 – 86.497 ± 2.08%.
Although all GA derivatives proved to be effective in relation to the other samples studied, they showed a significant decrease in their activity when compared to the effectiveness of GA. GA is a trihydroxybenzoic acid in which the hydroxyl groups are at positions 3, 4 and 5. PyG is a benzenetriol containing hydroxyl groups at positions 1, 2 and 3, it can be considered as a decarboxylation product of the carboxyl grouping of GA. nPG is a derivative of GA, formed by the esterification of the carboxyl group of GA with n-propyl alcohol. While TA is a polyphenol belonging to the class of gallic tannins, it consists of an isomeric mixture of glucose linked to eight or nine molecules of gallic acid. The three derivatives do not have the free carboxyl grouping, which leads us to conclude that the reduction in the antioxidant activity of these compounds against the DPPH free radical may be associated with this fact. These findings corroborate the data described byRafiee, Farhoosh, and Sharif (2018) in their studies comparing the antioxidant activity of GA with PyG. These authors observed a significant contribution of the carboxyl group of GA in the scavenging of DPPH free radicals. Furthermore,Lu, Nie, Belton, Tang, and Zha (2006) studied the structure-activity relationship of GA and its esters, and concluded that esters with the same number of free hydroxyl groups showed a decline in antioxidant activity with an increase in acyl chain length, indicating that steric freedom is also important for antioxidant activity.
The antioxidant effectiveness of Qtn and its glycoside (Rut) also showed significant variations in their ability to scavenge DPPH free radicals. The inhibition percentages of each of the compounds were measured in the concentration range of 1.00 - 6.00 µM and 6.00 - 17.50 µM, respectively. The observed inhibitions showed a linear trend and ranged from 10.639 ± 0.725 – 52.288 ± 0.943% and 15.630 ± 0.240 – 60.470 ± 0.645%, respectively. A wealth of evidence indicates that heteroside flavonoids are less effective antioxidants than their respective aglycones (Yang et al., 2019). The data from the present study also show a greater activity of the aglycone quercetin in relation to its glycoside rutin. Sterile factors created by the presence of sugar, together with a decrease in hydroxyl in the molecule are pointed out as the main causes of the decline in the antioxidant activity of glycosides (Nguyena et al., 2013; Yang et al., 2021; Yang et al., 2019).
The antioxidants BHT, Asc and Trolox are antioxidants that have no structural relationship to each other. They are widely used as references to compare the antioxidant activity of plant or food extracts. In the present assay, the antioxidant efficacy of the three standards, together with the MCE extract and EAF fraction was also measured, in the concentration range between 3.125 - 25.00 µM (BHT), 6.25 - 100.00 µM (Asc), 6.25 - 15.00 µM (Trolox), 20 - 100 µg/ mL (MCE and EAF), with inhibitions ranging from 11.140 ± 0.573 – 87.944 ± 0.031% (BHT), 23.629 ± 0.406 – 77.387 ± 0.434% (Asc), 14.963 ± 0.149 - 49.529 ± 0.648 (Trolox), 39.012 ± 0.750 – 58.203 ± 0.032% (MCE) and 39.012 ± 0.547 - 70.901 ± 0.952% (EAF). The DPPH free radical scavenging capacity of the crude extract (MCE) and its fraction showed significant variations between them. The EAF fraction had the lowest EC50 value (5.960 ± 0.61 μg/ mL) followed by the crude MCE extract (6.550 ± 0.310 μg/ mL), demonstrating that the MCE extract and the EAF fraction have a higher DPPH free radical scavenging activity than the antioxidants Rut (9.110 ± 0.04 μg / mL) and BHT (11.18 ± 0.03 μg/ mL), respectively.
The variation in the antioxidant efficacy observed between the two extracts seems to depend on the variations found in the phenolic content (TPC), which is related to the solvent's capacity (solvent polarity) to concentrate the greatest possible number of antioxidant compounds.
High levels of phenolic compounds have been closely related to high antioxidant capacity (Minatel et al., 2017). The ethyl acetate fraction has higher levels of TPC (427.290 ± 0.470 mg GAE / gDE) and, therefore, greater antioxidant activity when compared to TPC (395.350 ± 0.860 mg GAE / g DE) present in the crude extract, which proves the strong contribution of TPC in increasing the antioxidant activity of plant extracts, since no significant variations were observed in the total levels of TFC in the two extracts. The higher activity found for EAF is not surprising, asNakamura et al. (2017) measured the impact of liquid-liquid partition of different solvents (n-hexane fraction, chloroform fraction, ethyl acetate fraction, n-butanol fraction and aqueous fraction) on the TPC variation and on the DPPH free radical scavenging efficiency of the leaves of Sasa quelpaertensis. These authors found a higher TPC value and higher antioxidant activity for the ethyl acetate fraction. Furthermore, Cumbane et al. (2017) reported in their study an increase in the phenolic content and DPPH free radical scavenging capacity of the ethyl acetate fraction resulting from the liquid-liquid extraction of hydroethanol extract (80%) from Bridelia cathartica leaves. The findings of our work, supported by data provided by Nakamura et al. (2017) and Cumbane et al. (2017), corroborate the idea that the solvent polarity plays an important role in the variation of the solubility of polyphenolic compounds and, consequently, variations in the antioxidant activity. Some species of the genus Gladiolus have been scientifically studied, and some biological activities have been proven, including the antimutagenic activity obtained for Gladiolus illyricus (Basgedika, Ugurb, & Sarac, 2014), antioxidant found for the Gladiolus illyricus, Gladiolus hybridus and Gladiolusx grandifloras (Basgedika et al., 2014; Souza, Jung, Benedicto, & Bosco, 2021), antifungal activity found for G. dalenii, G. newii, G. goetzenii and Gladiolus watsonoides (Odhiambo, 2015; Odhiambo, Saffudin, Catherine, & Abiy, 2014; Odhiambo, Siboe, Lukhoba, & Dossaji, 2010) and cytotoxic activity found for G. watsonoides (Odhiambo et al., 2014). However, the antioxidant activity found in the present study seems to provide one of the first evidences of the rich anti-radical potential of Gladiolus dalenii, being necessary to further deepen this study using other methods of measuring the antioxidant capacity.
CONCLUSIONS
The results found in the present study showed high antioxidant efficacy of GA and its derivatives (TA, PyG and nPG), therefore, these may be the primary choice for comparing the antioxidant activity of foods and medicinal plants. The strong antioxidant activity found for G. dalenii extracts is strongly associated with the high phenolic content (TPC), thus, this plant can be used as a source of antioxidant substances in pharmaceutical or food formulations.