

Introduction
Camellia sinensis (L.) O. Kuntze (tea) has been cultivated in over 50 countries worldwide and serves as an essential cash crop for several developing countries. An estimated 70% of the global human population has consumed tea, with green tea accounting for 20% of world tea consumption (Zhou et al., 2019). Tea is rich in polyphenols, which make up between 18 and 36% of the leaf dry weight. The most abundant catechin in green tea is epigallocatechin gallate (EGCg), which makes up approximately 50 to 75% of the total catechins. In recent years, “omics” have grown in popularity to decipher the complex biological processes in organisms, with the rapid development of bioinformatics (Jiang, Ma, Apostolides, & Chen, 2019). Metabolomics studies the micro-molecular intermediates and metabolic products derived from specific cellular biological processes/pathways. Metabolomics explores the relationship between the genome and metabolic pathways through comprehensively investigating, e.g. plant metabolites (Jiang et al., 2019). Metabolomics has increasingly been employed in metabolite identification and quantification, metabolic pathway elucidation and regulation. The data obtained from metabolomics is then used for the genetic improvement of tea cultivars through the improved breeding, screening and selection of elite cultivars possessing higher quality, yield, and drought tolerance. Metabolomics reveals the association between genes, phenotype, and the environment much better than any of the other omics because metabolites are the final stage that determines the phenotype post genomics, transcriptomics, and proteomics (Taylor, King, Altmann, & Fiehn, 2002). Intense research has been conducted on several tea compounds such as alkaloids, flavonoids, theanine, and terpenes for genetic improvement of the tea plant because they constitute the bulk of the specific metabolites found in tea (Jin, Ma, Yao, Ma, & Chen, 2017). Plant metabolomics focuses predominantly on mechanisms that underlie resistance to disease and abiotic stress, i.e. drought, and secondary metabolites from biosynthetic pathways (Vasilev et al., 2016). Tea is one of Kenya’s key cash crops, providing revenue for up to 5 million households (Oerke, Dehne, Schönbeck, & Weber, 2012). According to Kenya’s development policy, which aims to realise an annual GDP growth of 10%, as of 2012, tea is expected to contribute significantly to the achievement of “Vision 2030” (www.ethicalteapartnership.org). Kenya, like the rest of the globe, is experiencing changes in weather patterns. These include substantial temperatures increases, rainfall decreases and an increase in the occurrence of droughts, frosts and hailstorms. Tea farming depends on a good distribution of rainfall; as such, the climate as mentioned above changes pose a significant threat to its global supply chains. Through the efforts of the International Centre for Tropical Agriculture (CIAT), predictions of future climate changes in the tea growing regions of Kenya’s between now and 2050 have been generated to develop models to identify key tea-growing regions that will remain ideal for tea farming (Herrero et al., 2010). The areas that will become unsuitable for tea cultivation will then be identified and adapted to switch from tea to other appropriate crops ahead of time. The CIAT generated these predictions by integrating the 21 global circulation models with Kenyan climate data and the Intergovernmental Panel on Climate Change’s A2 emissions scenario to predict Kenya’s probable future temperature and rainfall patterns. These were mapped against crop data based on the current crop climate requirements to estimate the future suitability of the tea farming regions in Kenya, as shown in Figure 1.
Figure 1
(A) shows the current suitability of tea growing regions in Kenya. (B) shows the future suitability of tea production areas in the year 2050 (www.ethicalteapartnership.org).
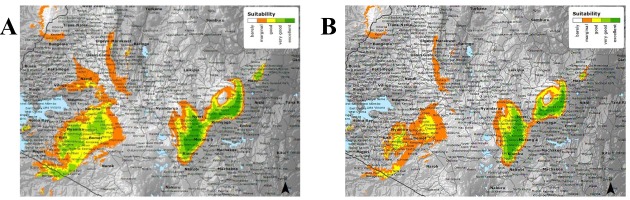
The models generated predict that there will be an average annual rainfall increase of 4%. However, the predicted increase in evapotranspiration is thwarted due to the annual temperature increase of 10% by the year 2050. Furthermore, annual maximum temperature increases from 26.6 ºC to 29 ºC and minimum temperature increases from 8.9ºC to 11.1ºC are predicted. These changes will result in altitude changes where tea cultivation is most suitable, i.e. from current optimal altitudes of between 1500 and 2100 metres above sea level to altitudes of between 2000 and 2300 metres above sea level by 2050. As such, there is a need to develop improved but resilient tea cultivars capable of adapting to these climate changes whilst also maintaining their high-quality tea liquor. The metabolic profile of C. sinensis has been comprehensively studied, but its metabolomic compositions have been poorly explored. The objective of the current study was to re-investigate the metabolomic profile of the Comm and NComm cultivars using non-targeted, high-resolution UPLC-MS to attain a new profound understanding of the metabolomic multiplicity between the Comm and NComm groups and to elucidate their association with tea liquor quality and drought tolerance.
Materials and methods
Tea plant material
All these NComm materials were vegetatively propagated and planted in two sites (Kericho (0.3689° S, 35.2863° E) and Kirinyaga (0.6591° S, 37.3827° E), Kenya, in 15-bush plots at 1.22 m and 0.62 m between and within plots, respectively, and replicated thrice following a complete randomised block design (Koech et al., 2018). The Comm group consists of 60 open-pollinated cultivars that have been hand-picked for their excellent yields and high quality tea liquor since the 1950s. These cultivars were created through the use of stem cuttings, which were taken from the best mother bushes. Approximately 10,000 trees per hectare were used to plant each Comm variety. TRFK 303/577 and GW Ejulu, two heterozygous parental clones, were crossed to produce the 250 cultivars of NComm . The codename given to a variety of clonal materials used in the NComm cultivars as described previously (Koech et al., 2018). A high-quality black tea with low caffeine content and high total catechins is produced by the GW Ejulu clone, however it produces mediocre yields and is vulnerable to drought. On the other hand, the drought-tolerant (DT) tea clone TRFK 303/577 (DT) yields black tea with low amounts of caffeine and total catechins while producing a high yield. Each NComm cultivar was previously tested for yield and quality but was found unworthy of commercialisation. From the 303 cultivars, eight Comm and eight NComm cultivars were selected at random and prepared for UPLC-MS analysis.
Sample collection and processing
Between September 2013 and February 2014, around 500 gm of new shoots, each of which contained two leaves and a bud, were taken from the individual tea bushes. The newly harvested shoots were placed in zip-lock plastic bags that were clearly labelled (Nyarukowa, Koech, Loots, Hageman, & Apostolides, 2018). The samples were placed on ice cubes until they could be processed within 24 hours. The shoots were quickly dried in the microwave for 5 minutes to prepare green tea as described in (Koech et al., 2018), and then grinding them in a coffee grinder, sieving them through a 355 m sieve, sealing them in air tight bags.The prepared samples were stored at 4 °C until further analysis.
Extraction of catechins and caffeine
Metabolites were extracted from samples collected y following Nyarukowa et al. (2020). To summarise, tea samples were processed in accordance with ISO14502-2 (2005) to extract metabolites. In order to extract the green tea samples, we used an MS204TS/00 analytical balance (Microsep, South Africa) to weigh out 0.200 ± 0.001 g using 5 ml of 70:30 MeOH (Merck, South Africa). The extraction mixtures were removed from the water bath and vortex mixed and returned at five-minute intervals, with the extraction mixtures being heated to 70°C for ten minutes. Using a Thermo Scientific Heraeus Labofuge (Sepsci, South Africa) Model 300 centrifuge, the mixture was chilled and centrifuged for 10 minutes at 3,500 g. Extraction was repeated after the supernatants were decanted into ten ml volumetric flasks. Ten ml of 70:30 MeOH: water (v/v) was used to dilute the two extracts and get the volume to ten ml. Using a stabilising solution of 10% (v/v) acetonitrile in water, 500 µg/ml EDTA, and 10 mg/ml ascorbic acid, all acquired from Sigma-Aldrich, South Africa, one ml portions of each extract were diluted to five ml. A Minisart®RC4 Syringe Filter (Sartorius, South Africa) was used to filter 100 µl of each solution through hydrophilic, solvent resistant regenerated cellulose membranes, which were then analysed using UHPLC-MS for each sample.
UPLC-MS analyses
Synapt G2 Quadrupole time of flight (QTOF) MS was used in conjunction with a Waters Acquity UPLC to accomplish high-resolution UPLC-MS investigations (Waters, Milford, MA, USA). With the cone voltage set at 15 V and the desolvation temperature set at 275 °C, electrospray ionisation was used in the negative mode to generate ions. In order to have the maximum possible resolution and sensitivity, the desolvation gas was set to 650 L/h. In both resolution and MSE settings, scans from 150 m/z to 1500 m/z were used to collect the data. Collision energy was ramped up from 4 volts to 40 to 100 volts, enabling for the gathering of fragmentation data in the second MS data channel. We used leucine enkephalin as a "lock mass" to ensure the masses were correct. Sodium formate was used to calibrate the instruments. The chromatographic separation was carried out using a Waters HSS T3 column measuring 2.1 100 mm and 1.7 μm in diameter. A solution containing 0.1% formic acid (solvent A) and a solution containing 0.1% formic acid (solvent B) are the two mobile phases (solvent B). Starting at 0% B for 1 minute, the gradient was gradually increased to 28 percent B over 20 minutes, then 40 percent B in 1 minute, then 100 percent B in 2 minutes, where it was held isocratic for 1.5 minutes and then re-equilibrated for four minutes. There was a flow rate of 0.3 mL/min, an injection volume of 2 μL, and a column temperature of 55°C employed.
Data pre-processing and multivariate statistical analyses
The acquired UPLC-MS data was processed using the MarkerLynxTM version 4.1 software. The processing steps included filtering, peak detection, peak alignment and normalisation. The function one data for all the samples was processed; this is the data collected at low energy and, as such, does not include ion fragmentation data as only the mother ions of each metabolite are detected. Peaks within the retention time range of 0-22 min were processed. Smoothing steps were performed during the feature detection stage to reduce the noise levels within the data further. For this, the Savitzky-Golay smoothing function was employed. Following the processing, a table of detected metabolite markers with their corresponding normalised peak heights across all the samples was generated. This table was then exported to Microsoft Excel, where data pre-processing and statistical analyses were performed as described in Nyarukowa et al., 2020. Last, we calculated the sum of the metabolites, glutamic acid, lysine and theanine; catechin, epicatechin, epicatechin gallate, epigallocatechin and gallocatechin; and glucose, maltose and myoinositol as the total amino acids, total catechins and total sweeteners, respectively.
Metabolite identification
A comparison of mass spectra and retention times with reference standards identified and confirmed the biomarkers as possible UPLC-MS biomarkers. For positive and negative ionisation modalities, a comprehensive library of MS/MS data were collected. MS/MS fragment ion analysis was facilitated by the MassFragmentTM application manager (Waters MassLynx v4.1, Waters Corp., Milford, USA) through chemically intelligent peak matching algorithms. It was then entered into databases, either in-house or utilising the internet MassBank (http://www.massbank.jp/) data source, for further investigation.
Results and Discussion
Table 1 shows the ionisation mode under which they were detected, their m/z value and corresponding retention time (RT/min), while Table 2 lists all 21 and compares their concentrations in each group, expressed in arbitrary units.
Table 1
The list of metabolites identified as Comm/NComm cultivar markers. The table shows the ionisation mode they were detected, their m/z value and corresponding retention time (RT/min), and identifying fragments.
Table 2
The UPLC-MS metabolite list, represented in arbitrary units.
UPLC-MS positive and negative ionisation mode PCA, PLS-DA and S-plots
PCA is an unsupervised projection technique that permits the viewing of large sample datasets by summarising variation through the projection onto fewer dimensions. PCA popularity in metabolomics is because it is a simple non-parametric method, which permits the viewing of large sample datasets by summarising variation through the projection onto fewer dimensions, revealing inherent data trends. PLS-DA is a supervised technique commonly used for classifying and selecting biomarkers in metabolomics research. It consists of a PLS regression, used to identify variables that can distinguish between groups of samples. PLS-DA improves the observed PCA separation between the two sample groups, with the percentage of the overall variation explained by each component, is indicated along each axis. Each point on the graph is a sample projected onto the new lower-dimensional space, and the ellipsoids reflect the 95 percent confidence intervals for each group. Figure 2 shows UPLC-MS PCA, PLS-DA and S-plots under the positive ion mode.
Figure 2
(A) The PCA scores plot; (B) the PLS-DA plot, and (C) the s-plot, showing good separation between the Comm and the NComm cultivars in positive ion mode, and the metabolite markers distinguishing both groups, with the black representing the Comm cultivars and the red the NComm cultivars. A comparison of metabolites in the two groups of cultivars, Comm and NComm, is shown on the x-axis, with the markers above it representing those found in the Comm cultivars and those below it reflecting those found in the NComm cultivars.
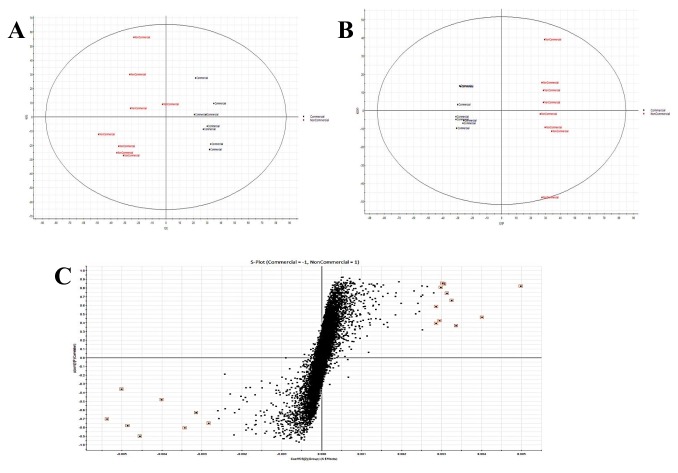
Figure 3
(A) The PCA scores plot; (B) the PLS-DA plot, and (C) the s-plot, showing good separation between the Comm and the NComm cultivars in positive ion mode, and the metabolite markers distinguishing both groups, with the black representing the Comm cultivars and the red the NComm cultivars. A-plot shows that the Comm cultivars have higher markers than the NComm cultivars, and vice versa.
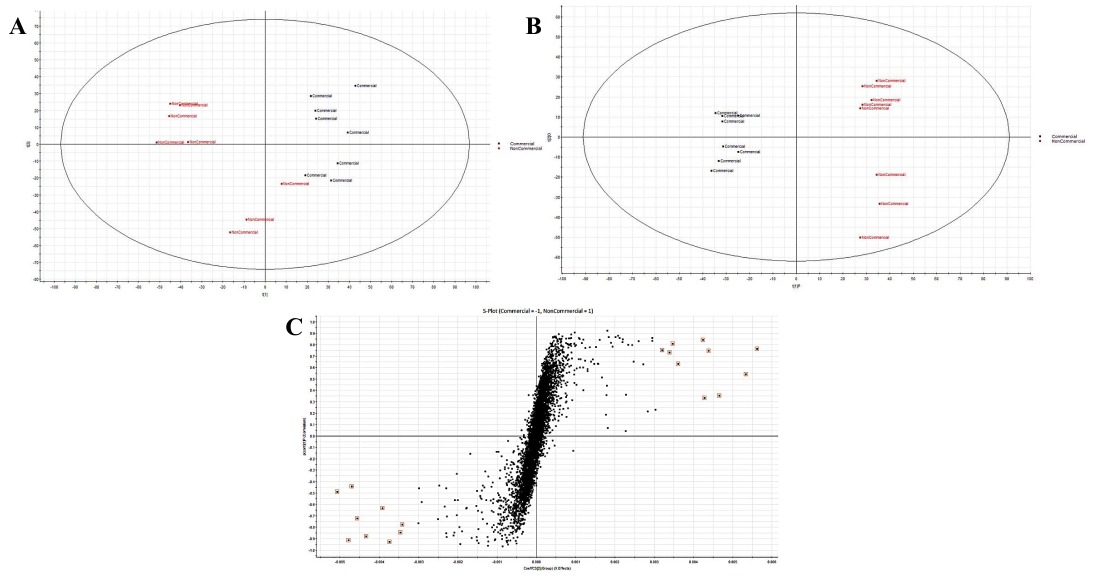
Figure 4
UPLC-MS metabolite separation of Comm and NComm cultivars in violin plots. The y-axis units are arbitrary.
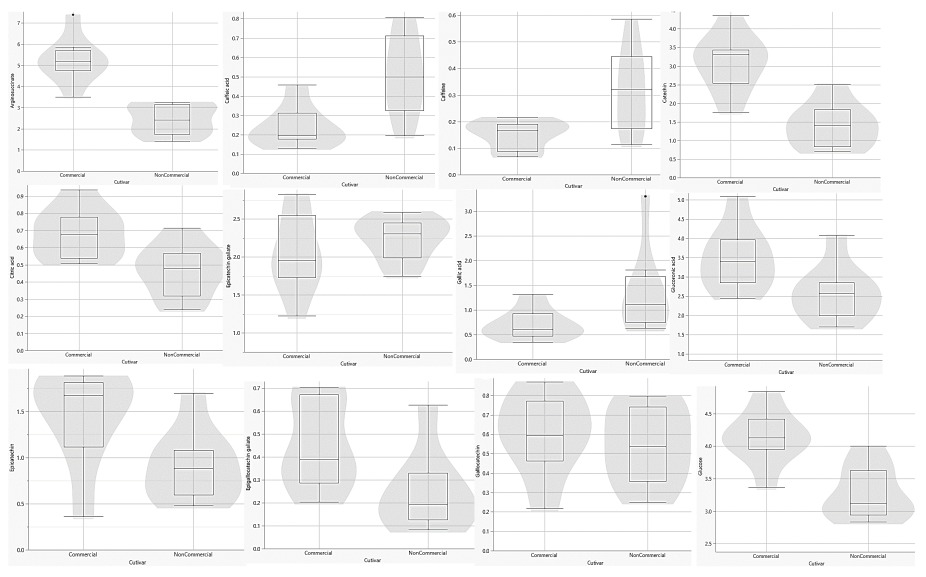
Figure 5
UPLC-MS metabolite-based separation of Comm and NComm cultivars. The y-axis units are arbitrary.
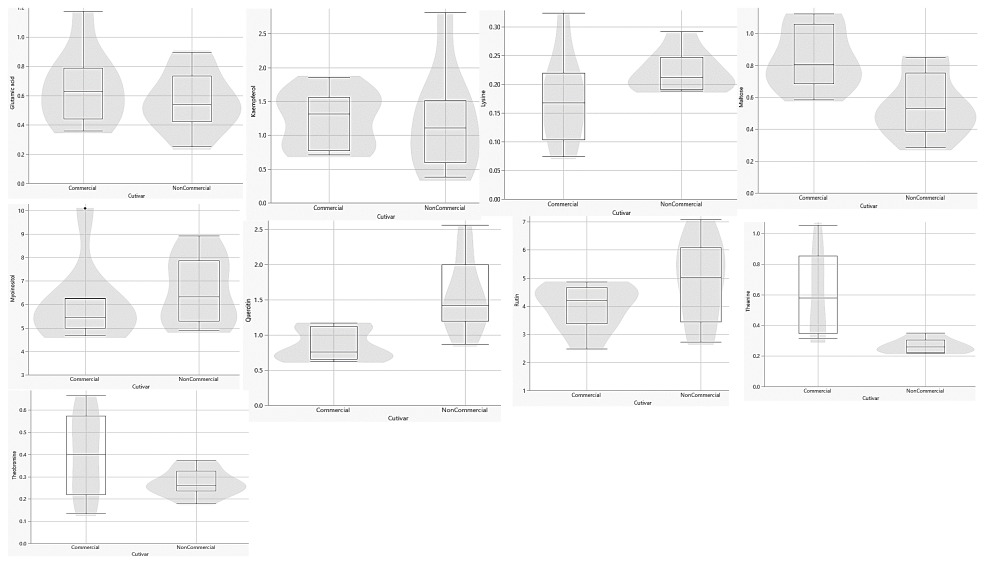
Following the pre-processing of the UPLC-MS metabolomics data, the metabolite profiles of Comm and NComm cultivars were investigated using PCA, and PLS-DA, with Figure 2 showing the positive ionisation mode and Figure 3 showing the negative ionisation mode. From the PCA plots (Figures 2A and 3A), the metabolite patterns observed separate the Comm cultivars from the NComm cultivars. Figures 2B and 3B show the supervised PLS-DA plots for the positive and negative ionisation modes, respectively, showing the clear separation between the eight Comm and NComm cultivars. Violin plots are conspicuous for visualising the differences between groups, carrying crucial statistical information about, e.g. medians and outliers. Argininosuccinate, caffeic acid, CAF, CAT, citric acid, EC, EGCg, gallic acid, gluconic acid, glucose, maltose, quercitin and theanine in Figure 4 and 5 differentiate the Comm cultivars from the NComm, making these ideal predictors to be employed in classifying the 303 genotypes into the two groups. Several detected metabolites, i.e. glucose, maltose and myoinositol, relate to sweetness, resulting in their summation being total sweeteners.To put it another way, the content of total sweeteners in Comm cultivars was higher than in the NComm cultivars.
The tea business is interested in sweet cold brew teas, and sugars play a role in it. It is possible that these cultivars were selected for commercial cultivation in the 1950s because of their sweetness. There have been reports that amino acids, catechins, and caffeine have been linked to the quality of green tea infusions. A glutamic acid, lysine, and theanine-containing amino acid was discovered in this work. Researchers (Solms & Wyler, 1979) investigated the question "Is there a potato flavour and what are the associated compounds?" According to the findings of this study, potatoes have a neutral flavour but yet have a distinctive aroma and taste. The amino acid lysine was discovered to be the culprit in this case. In other words, it's possible that these amino acids have no effect on the flavour of tea fluid at all. There is some evidence, however, that theanine accounts for about 70 percent of the umami flavour in green tea.
There is an interest in sweet cold brew teas within the tea industry, and the sugars are IN PART key to that. Sweetness may have contributed to these cultivars being selected for commercial production since the 1950s. Amino acids, catechins and caffeine have been reported as the three major chemical constituents of green tea highly associated with the quality of green tea infusions. The amino acids glutamic acid, lysine and theanine were detected in the present study. A study bySolms et al. (1979) sought to answer the question, “Is there a potato taste at all, and what are the corresponding compounds?” This study reported that potatoes have a neutral flavour yet possess a typical taste and aroma. It was found that the amino acid lysine was responsible for this. This, therefore, means these amino acids possibly have no significant impact on the taste of tea liquor. Theanine, however, has been reported to be responsible for approximately 70% of the umami taste of green tea.
According to Narukawa, Morita, and Hayashi (2008), theanine has a complex taste, principally encompassing bitter, sweet and umami, with the taste intensity reported to increase with an increase in theanine concentration. Glutamic acid has also been documented to contribute to the umami taste of tea. The amino acid concentrations of proline, an osmoprotectant, have been documented to increase with an increasing temperature, e.g. during drought stress, for prolonged periods (Ye et al., 2018). These findings correlate with those of Nyarukowa, Koech, Loots, and Apostolides (2016), who reported that the amino acid concentration of phenylalanine in the drought tolerant Malawian tea cultivars employed in that study under wet conditions were two times higher than those of proline. Once subjected to water stress/ high temperatures, it was found that the phenylalanine was converted to proline, with the stressed leaves containing proline concentrations that were two to three times higher than that of phenylalanine. This, therefore, indicates that the Comm cultivars rich in amino acids are likely to survive and grow under drought conditions. Glutamic acid also functioned as a precursor for proline biosynthesis during stress conditions. The present study found the Comm cultivars to have a higher glutamic acid concentration than the NComm cultivars. This, therefore, means that during drought stress conditions, the cultivars with high glutamic acid will use it for the biosynthesis of proline, which will then aid in protecting them from desiccation.
Caffeine, a tea alkaloid, contributes to the astringency and bitterness of green tea infusions. In addition, caffeine has been documented to contribute to the briskness of tea, while theobromine is reported to contribute to the mellowness and sweetness of oolong tea (Chaturvedula & Prakash, 2011). Literature has extensively documented the abundance of polyphenols constituents in tea leaves. Catechins contribute to the astringency and bitterness of green tea, and as is the case with theanine, the taste intensity increases with an increase in catechins concentration. A high catechins content makes the resultant green tea infusion significantly astringent and bitter, while low catechins content results in losing its characteristic, acquired taste (Liang, Lu, & Shang, 1996). Ester-catechins (EGCg, ECg, gallocatechin gallate (GCg) and catechin gallate (Cg)) are highly correlated to astringency and bitterness, while the simple catechins (catechin and epicatechin) are associated with bitterness rather than astringency (Chaturvedula et al., 2011).
Furthermore, ester-catechins break down during tea processing, producing simple catechins and gallic acid, which may decrease green tea bitterness and astringency. Gallic acid, an essential phenolic acid found in tea, was found in the present study. It combines with the catechins to form catechin gallates, thus making it apparent that catechins and gallic acid are two major biologically active groups in tea (Lin, Lin, Liang, Lin-Shiau, & Juan, 1998). The total catechins content in the Comm cultivars was statistically significantly higher than in the NComm cultivars. Literature has documented the free radical scavenging abilities of catechins and how this prevents oxidative stress (Gramza et al., 2006), allowing the cultivars such as the Comm cultivars with higher catechins content, to cope during droughts as compared to the NComm cultivars; this may explain why the Comm cultivars were designated as drought tolerant. Cultivars with high concentrations of EGCg and ECg, such as the Comm cultivars, would be drought-tolerant, and with the effects of climate on the tea growing areas mentioned in the introduction, tea breeders would be in search of such cultivars. The present study found caffeic acid (CA) concentration higher in the Comm than the NComm cultivars. These compounds enhance the umami taste of green tea. In a study by K Krishna and Surinder (2003), it was shown that applying CA to soybean increases its yields. This could explain why the Comm cultivars had a reported higher yield as compared to the NComm cultivars. When these pre-treated plants are subjected to drought stress, the antioxidant enzyme activities are enhanced, thus protecting plants from drought (Wan et al., 2014). Citric acid was the other metabolite detected. It has been documented to have a bitter taste (Klaauw & Smith, 1995). Citric acid has been shown to have beneficial effects in the roots of wheat and legumes, as it forms stable molecular complexes with metallic cations, favouring the availability and absorption of water and nutrients, and in so doing, increasing the vigour of the plant (Franco, Ball, & Luttge, 1992). We postulate that citric acid will have a similar role in tea in other crops, i.e. combating drought stress. Glucuronic acid was one of the other metabolites detected. Gluconic acid is an organic acid produced from the oxidation of glucose. As is the case with citric acid, glucuronic acid lowers the pH in the plant cells, thereby enhancing their water take up and hence survive drought stress (Anastassiadis & Morgunov, 2007). This compound may contribute to the Comm cultivars being drought tolerant. Another important finding in this study was the detection of kaempferol 3-O-β-rutinoside. This flavon-3-ol glycoside has been documented as being a vital tastant responsible for the velvety astringent taste noted in tea infusions. It has also been reported as an enhancer of the bitterness of caffeine in tea (Scharbert & Hofmann, 2005). Myoinositol was another metabolite also detected in the study. Myoinositol is involved in several metabolic pathways in plants, serving as a precursor, e.g. inositol phosphates, phosphoinositides, cell wall polysaccharides through the myoinositol oxidation pathway; it is also involved in signal transduction pathways (Rogers, Michaux, Bastin, & Bucheli, 1999). Quercetin and rutin are flavonol glycosides, which were both detected by UPLC-MS. These two compounds have been reported responsible for the bitter taste found in buckwheat plants (Suzuki et al., 2015). These flavonol glycosides will likely similarly influence the taste of tea. The present study successfully identified metabolites expressed differently in the Comm and NComm cultivars and their respective contributions to the quality of the resultant tea liquor and their roles in conferring drought tolerance, which inadvertently results in an increased yield.
Abbreviations
CIAT - International Centre for Tropical Agriculture
Comm - Commercial
GC-MS - Gas chromatography-Mass spectrometry
GDP - Gross domestic product
NComm - NonCommercial
NMR - Nuclear magnetic resonance
PCA - Principal component analysis
PLS-DA - Partial least squares discriminant analysis
QTOF - Quadrupole time-of-flight
TRI - Tea Research Institute
UPLC-MS - Ultra-performance liquid chromatography-Mass spectrometry
Acknowledgment
This research was made possible by financial support from James Finlay (Kenya) Ltd., George Williamson (Kenya) Ltd., Sotik Tea Company (Kenya) Ltd., Mcleod Russell (Uganda) Ltd., the Tropical Research Institute of Kenya, and the Southern African Biochemistry and Informatics for Natural Products (SABINP) consortium (SABINA). It was the TRI of Kenya that contributed the C. sinensis cultivars that were employed in this study. An additional source of funding came from the Technology and Human Resources for Industry Programme (THRIP), which is a joint initiative of the Department of Trade and Industry of South Africa, the National Research Foundation of South Africa, and the University of Pretoria in South Africa.
Author contributions
ZA, RM, and SK were involved in the research's experimental design. RK and CN were in charge of collecting plant material. CN carried out the experiments, analysed the data, and drafted the text, which was revised by RK, RM, SK, and ZA. All authors evaluated and approved the manuscript.