

1. INTRODUCTION
Honey is a naturally occurring substance comprising around 600 distinct components. It primarily consists of carbohydrates and water, along with trace amounts of vitamins, minerals, and fragrant compounds (Rashid et al., 2020; Valverde et al., 2022). Honey also contains enzyme antioxidants such as glucose oxidase and catalase (Ahmed et al., 2018; Osés et al., 2024). Nonenzymatic antioxidants or secondary metabolites in honey include flavonoids (chrysin, pinocembrin, pinobanksin, quercetin, kaempferol, luteolin, galangin, apigenin, hesperetin, and myricetin), phenolic acids (caffeic acid, coumaric acid, ferulic acid, ellagic acid, and chlorogenic acid), organic acids, ascorbic acid, amino acids, proteins, Maillard reaction products α-tocopherol, and carotenoids (Alaerjani et al., 2022; Zawawi et al., 2021).
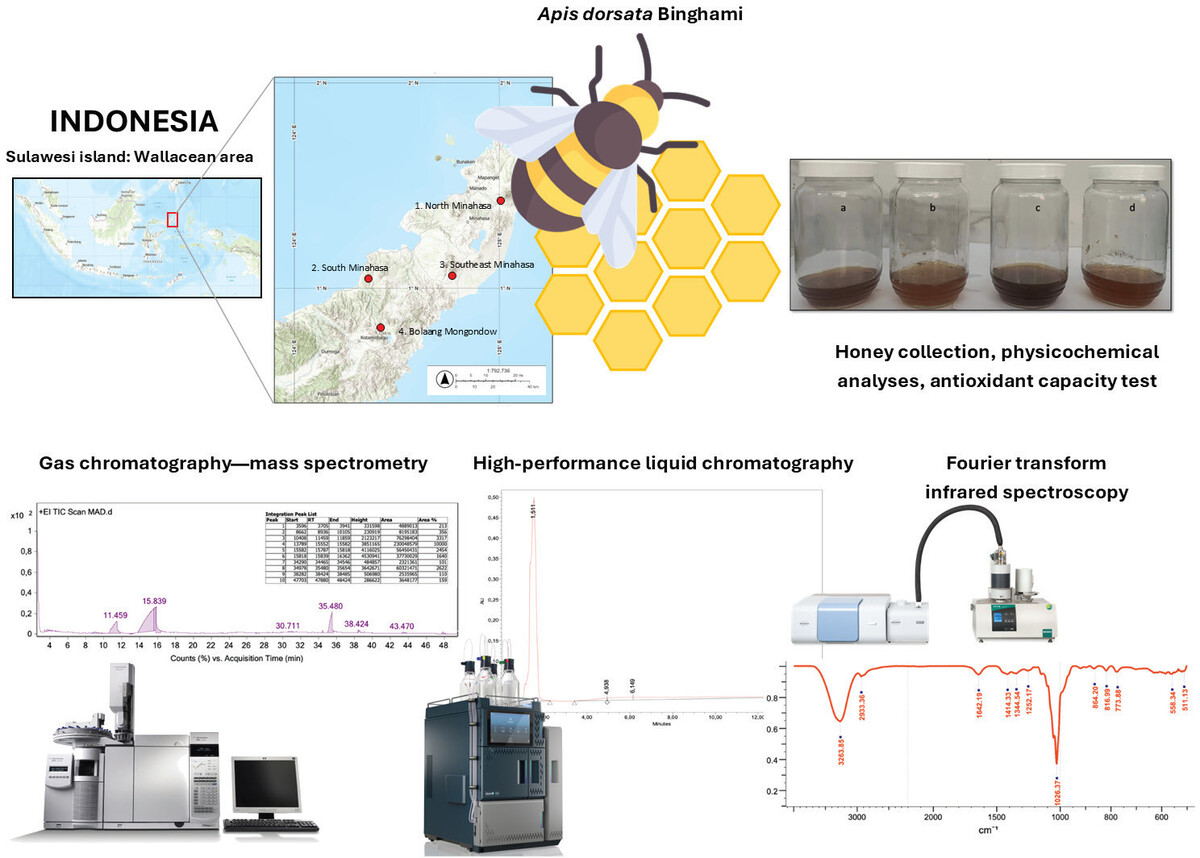
Apis dorsata Binghami is a species of giant honeybee endemic to the Wallacean zone of Sulawesi Island, Indonesia. This species cannot be bred and therefore lives naturally in the forest. It possesses an extensive foraging flight range (Qu et al., 2025). The diversity of nectar source plants it utilizes is greater than that of cavity-nesting honey bee species such as A. mellifera (Ghosh et al., 2020). The physicochemical properties and bioactive constituents determine the potential of a particular honey to serve as a functional food, nutraceutical, or raw material for herbal medicine (Al-Kafaween et al., 2023). Naturally, this also influences the economic value of that specific type of honey. Research on honey produced by A. dorsata Binghami remains scarce to date. Honey is produced from a mixture of nectar and the salivary secretions of bees; nectar itself is derived from flowering plants. The properties of honey are strongly affected by the botanical sources of the nectar collected by bees (Hunter et al., 2021; Vîjan et al., 2023). Previous studies have identified several indigenous plant species as nectar sources for A. dorsata used in honey production (Semuel et al., 2019). The indigenous flora of Sulawesi includes Elmerellia celebica, Ficus minahassae, Lansium sp., Dillenia celebica, Vatica celebica, Myristica minahassae (Minahasa forest nutmeg), Syzygium minahassae, among various other blooming species. Each type of nectar possesses distinct bioactive compositions, resulting in significant variability in the bioactive profiles across different honey varieties worldwide.
To our best knowledge, no previous research has comprehensively examined the physicochemical properties, bioactive composition, or initial assessment of antioxidant potential specifically for A. dorsata Binghami honey. The aim of this study is to comprehensively characterize the physicochemical properties, identify bioactive compounds, and evaluate the antioxidant activity of A. dorsata Binghami honey sourced from North Sulawesi, Indonesia, thereby providing foundational data to support its potential use in integrative medicine and functional food applications.
2. METHODS
2.1 Honey Sample Collection
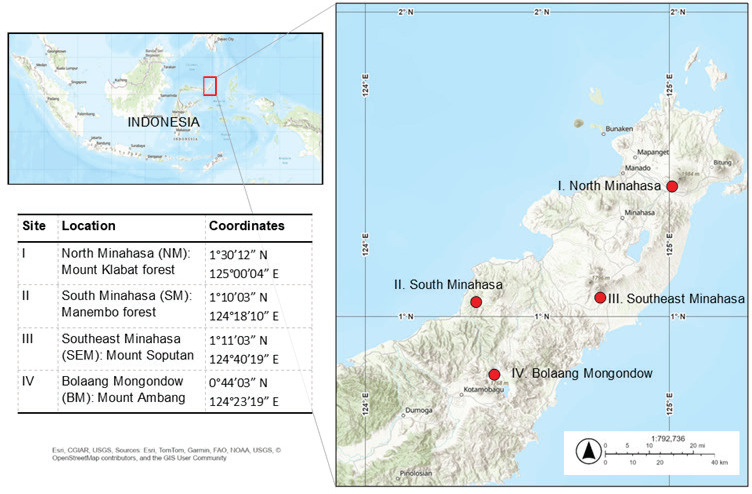
Honey samples were obtained from wild colonies of A. dorsata Binghami collected from four distinct natural forest locations in North Sulawesi, Indonesia, between March and June 2024. The specific collection sites included: Gunung Klabat Forest (1°30′12″ N, 125°00′04″ E), Manembo Forest (1°10′03″ N, 124°18′10″ E), the slopes of Mount Soputan (1°11′03″ N, 124°40′19″ E), and the slopes of Mount Ambang (0°44′03″ N, 124°23′19″ E) (Figure 1). Honeycombs were transported directly from these collection sites to the laboratory without prior extraction. Samples were stored in a temperature-controlled container (18 °C), shielded from light, until analysis. Honey extraction from the combs was performed using traditional indigenous methods, which involved gently repelling the bees with leaves to ensure their nonharmful dispersal and subsequent establishment of new colonies.
2.2 Physicochemical Characterization
The physicochemical properties of the honey samples were determined following the Indonesian National Standard SNI 8664-2018 (Ansyarif, 2023) with minor modifications. Parameters measured included water content (determined by oven drying), ash content (by incineration), hydroxymethylfurfural (HMF) content (spectrophotometrically), pH and acidity (by titration), reducing sugar and sucrose content (by Luff Schoorl method), insoluble solid content (gravimetrically), diastase enzyme activity (spectrophotometrically), and moisture content (using refractive index). Levels of lead (Pb) and mercury (Hg) in honey samples were determined using Atomic Absorption Spectrometry.
2.3 Bioactive Compound Analysis
Total flavonoid content was quantified using a colorimetric method with UV-Vis spectrophotometry, based on a quercetin standard curve (Semuel et al., 2019). Total phenolic content was assessed using the Folin–Ciocalteu colorimetric method, with absorbance measured at 760 nm and quantified using a gallic acid standard curve (Tananaki et al., 2024).
2.4 Gas Chromatography-Mass Spectrometry Analysis
Gas chromatography-mass spectrometry (GC-MS) analysis was conducted using a Shimadzu GC-MS, Model QP-2010 Ultra, equipped with a headspace AOC-5000 auto-injector. The conditions were Column: Rtx-5 MS (30 m length, 0.25 mm ID, 0.25 mm film thickness, Cross bond 5 diphenyl/95 dimethyl polysiloxane); detector: mass spectroscopy; carrier gas: helium; oven temperature program: initial temperature 40 °C (hold time 2 min), ramped at 3 °C/min to a final temperature of 220 °C (hold time 5 min). GC-MS program settings: Ion source temperature: 200 °C; interface temperature: 250 °C. Solvent cut time was 2 minutes, run time 60 minutes, acquisition mode set to scan, event time 0.30 seconds, scan detector gain mode relative, and detector gain 1.08 kV plus 0.00 kV. The speed was 1.666, with a starting m/z of 35.00 and an ending m/z of 500.0 (Montaser et al., 2023).
2.5 High-Performance Liquid Chromatography Analysis
High-performance liquid chromatography (HPLC) analyses were conducted in accordance with previous research. In brief, 2 g of honey sample was combined with 14 mL of 70 acetonitrile and allowed to stand for 24 hours. The mixture was filtered using Whatman No. 41 filter paper and a Millipore PVDF filter and subjected to HPLC (Semuel et al., 2019).
2.6 Fourier Transform Infrared Analysis
Functional groups in honey samples were analyzed using Fourier Transform Infrared (FTIR) spectroscopy with a Perkin Elmer Spectrum One FTIR spectrophotometer. Honey samples were applied dropwise onto potassium bromide (KBr) plates, which were then placed into the sample holder for measurement.
3. RESULTS
3.1 Physicochemical Characteristics and General Bioactive Content Across Forest Locations
Honey samples from wild A. dorsata Binghami colonies, collected from four distinct natural forest locations in North Sulawesi, Indonesia, between March and June 2024, exhibited notable variations in their physicochemical properties and general bioactive content, providing a comprehensive baseline characterization (Table 1).
Table 1
Physicochemical and bioactive analysis of Apis dorsata Binghami honey from multiple locations in North Sulawesi, Indonesia.
The acidity (pH) of the honey samples ranged from 4.00 (North Minahasa) to 4.50 (Bolaang Mongondow). Such variations in pH can reflect differences in the organic acid content derived from the specific floral nectar sources available to the bees in each forest type. Moisture content varied from 12.40 g/100 g (South Minahasa) to 18.20 g/100 g (North Minahasa), potentially influenced by the ambient humidity in the respective forest microclimates and the ripening efficiency of the bee colonies. Ash content, indicative of the mineral composition, ranged from 1.20 g/100 g (South Minahasa) to 1.80 g/100 g (Southeast Minahasa). These differences suggest varying mineral uptake by plants in the distinct geological settings of the bees’ foraging areas. Reducing sugar content showed a range from 65.00 (Southeast Minahasa) to 68.52 (South Minahasa), while sucrose content ranged from 3.07 (North Minahasa) to 4.60 (Southeast Minahasa). These sugar profiles are direct reflections of the types of nectar collected by A. dorsata Binghami from the diverse flora within each forest habitat. Diastase enzyme activity was relatively consistent across samples (4.00–4.10 DN), suggesting a similar level of enzymatic processing by the bees or consistent postharvest handling across locations. Insoluble solids content ranged from 0.12 (North Minahasa) to 0.20 (Southeast Minahasa), which can be related to pollen content or other particulate matter collected by the bees.
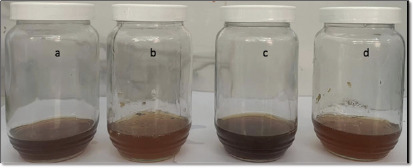
Regarding general bioactive content, total phenolic content varied significantly from 512.69 mg GAE/100 g (Bolaang Mongondow) to 916.75 mg GAE/100 g (North Minahasa), and total flavonoid content ranged from 2.7 mgQE/g (South Minahasa) to 3.6 mgQE/g (North Minahasa). These variations directly indicate differences in the abundance and types of phenolic and flavonoid-rich plants available to A. dorsata Binghami in their respective foraging grounds, reflecting the botanical diversity of each forest ecosystem. The colors of the honey samples also varied from brownish yellow to golden yellow (Figure 2), which can be visually linked to the diverse botanical origins.
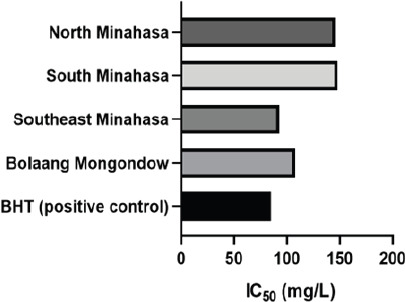
3.2 Antioxidant Activity and Selection for Detailed Chemical Profiling
The antioxidant activity of A. dorsata Binghami honey, assessed by DPPH free radical scavenging, revealed that the highest DPPH radical scavenging activity was observed in the Southeast Minahasa sample (80.27), while the lowest was in the South Minahasa sample (69.94). The IC50 values, indicating the concentration required to scavenge 50% of free radicals, ranged from 92.85 mg/L (Southeast Minahasa) to 147.80 mg/L (Bolaang Mongondow). The Southeast Minahasa sample showed the highest antioxidant potency among the honeys (Figure 3), suggesting a richer array of antioxidant compounds, likely derived from the specific floral resources available in that particular forest ecosystem. The significant antioxidant activity of A. dorsata Binghami honey, primarily attributed to its high total phenolic and flavonoid content, underscores the richness of the floral resources utilized by the bees. The differences in these bioactive compounds across locations directly indicate variations in the abundance and types of phenolic and flavonoid-rich plants available to A. dorsata Binghami in their respective foraging grounds (Hernández-Fuentes et al., 2021; Suleiman et al., 2020). Due to its superior free radical scavenging activity and providing a deeper understanding of the complex chemical makeup of A. dorsata Binghami honey, the Southeast Minahasa sample was selected for more in-depth chemical profiling using GC-MS, HPLC, and FTIR.
3.3 Detailed Chemical Profiling of A. dorsata Binghami Honey (Southeast Minahasa Sample): GC-MS Analysis
GC-MS analysis of the Southeast Minahasa sample identified 10 distinct compound groups (Figure 4), comprising a total of 111 derivative compounds (Table 2). This detailed profile contributes to the unique chemical fingerprint of A. dorsata Binghami honey. Notably, three of these compound groups (1H-Imidazole, 2-ethyl-4,5-dihydro; Furan, 2,5-dimethyl; and 6-Hepten-1-ol, 2-methyl) have not been previously established in honey, indicating potentially unique metabolic pathways of A. dorsata Binghami or novel interactions with specific native flora in the Wallacea zone. Specific research directly linking H-Imidazole, 2-ethyl-4,5dihydro-compound to robust bioactivities within biological systems is limited. Imidazole derivatives, as a broader class, are known for their diverse pharmacological properties, which can include antimicrobial and anti-inflammatory effects (Andrei et al., 2021). Furan, 2,5-dimethyl has been identified as a metabolite in various biological contexts. Research suggests that it possesses antifungal properties, for instance, being linked to volatile compounds from fungi that inhibit the growth of other microorganisms (Saeid et al., 2023). It has also been recognized as a bacterial and plant metabolite (Zhang et al., 2022), indicating its involvement in various metabolic pathways, though its direct therapeutic bioactivity in honey has not been well established. Other identified compounds, such as 4H-Pyran-4-one, 2,3dihydro-3,5-dihydroxy-6-methyl, 5-hydroxymethylfurfural, melezitose, n-Hexadecanoic acid, cirsium aldehyde, and 9,12-octadecadienoic acid, have been previously confirmed in honey (Starowicz et al., 2021; Tafere, 2021).
Figure 4
Results of GC-MS analysis of Apis dorsata Binghami honey displaying ten peaks, corresponding to a specific compound group.
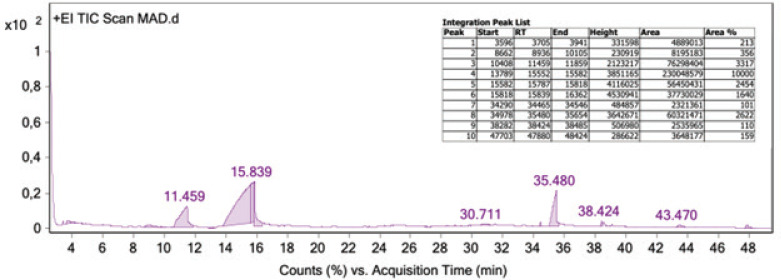
Table 2
Compounds found in Apis dorsata Binghami honey.
3.4 HPLC Analysis
HPLC analysis of the Southeast Minahasa A. dorsata Binghami honey revealed three prominent retention times (RTs) most strikingly at 1.511, followed by small peaks at 4.938 and 6.149 minutes (Figure 5). A major peak was observed at 1.511 minutes, representing the highest concentration undetermined compound, most probably to be the major monosaccharides in honey (fructose and glucose). The compounds at 4.938 minutes and 6.149 minutes were identified as gallic acid and protocatechuic acid, respectively (Table 3). The presence of these specific acids provides further insight into the phenolic composition of the honey and, by extension, the plant sources utilized by the bees in this particular habitat. Both gallic acid and protocatechuic acid exhibit antiviral, antioxidant, anticancer, antiatherogenic, and antibacterial properties (Puscion-Jakubik et al., 2022; Trabelsi et al., 2013). Protocatechuic acid has been widely reported in various types of honey. It was identified in 40 varieties of commercial honey sourced from diverse floral origins and geographical regions in China (Cheung et al., 2019). Greek honey contains high levels of phenolic acids, particularly protocatechuic acid and p-hydroxybenzoic acid—and exhibits considerable antioxidant, anticancer, and antiatherogenic properties that can be partially attributed to its phenolic acid composition (Spilioti et al., 2014). Additionally, abscisic acid, protocatechuic acid, and 4-hydroxybenzoic acid may serve as potential markers for monofloral honey derived from Dendropanax dentiger (Wang et al., 2021).
Figure 5
HPLC chromatogram of Apis dorsata Binghami honey. Three peaks appeared at 1.511, 4.938, and 6.149 minutes, corresponding to compounds described in Table 3.
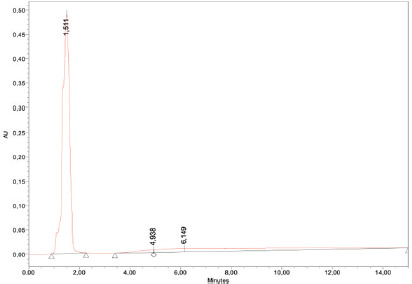
Table 3
HPLC results of Apis dorsata Binghami honey.
| No | Retention time (min) | Area | %Area | Height | Compounds / References |
|---|---|---|---|---|---|
| 1 | 1.511 | 9457750 | 78.88 | 491141 | Not determined; a combination of the major monosaccharides found in honey: fructose and glucose. |
| 2 | 6.149 | 2287143 | 19.07 | 6919 | Protocatechuic acid (Ashitha Ganesh et al., 2024; Trabelsi et al., 2013) |
| 3 | 4.938 | 245579 | 2.05 | 5562 | Gallic acid (Trabelsi et al., 2013) |
3.5 FTIR Analysis
FTIR spectroscopy confirmed the presence of various functional groups in the Southeast Minahasa A. dorsata Binghami honey sample (Figure 6, Table 4). Absorption at 3263.85 cm−1 indicated OH vibrations, while C-H vibrations were observed at approximately 2933.36 cm−1. The analysis also identified peaks corresponding to hydroxyl groups, carbon-oxygen bonds, and other organic and inorganic components. These findings are consistent with the presence of phenolic and flavonoid compounds and provide a comprehensive spectral fingerprint, contributing to the overall chemical characterization of this unique honey. The FTIR spectrum of honey revealed the presence of functional groups indicative of phenolic and flavonoid compounds. FTIR demonstrates high sensitivity in differentiating various types of honey and identifying contaminants within honey (Cárdenas-Escudero et al., 2023). Additionally, the FTIR method can classify nectar plant types for bees according to geographical regions. The presence of – OH, C–O, NH3, and C–O–C groups signifies phenolic compounds and flavonoids in Apis dorsata honey sourced from North Sulawesi (Ganaie et al., 2021).
Figure 6
FTIR chromatogram of Apis dorsata Binghami honey, corresponding to the compounds in Table 4.
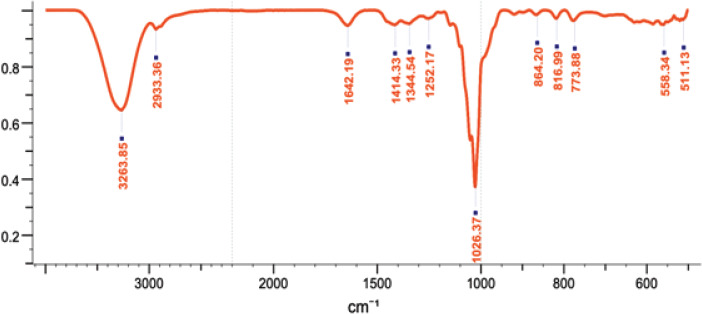
Table 4
FTIR results of Apis dorsata Binghami honey.
3.6 Heavy Metal Content
Heavy metals were detected in all A. dorsata Binghami honey samples, serving as critical environmental signatures for the bees’ habitats as well as providing cautious consequences on food processing (Table 1). Lead (Pb) levels ranged from 0.002 mg/kg (North Minahasa) to 0.448 mg/kg (Southeast Minahasa). Mercury (Hg) levels ranged from 0.014 mg/kg (South Minahasa) to a higher 0.305 mg/kg in the Southeast Minahasa sample. The presence and variability of these heavy metals across the different forest sites highlight potential differences in environmental contamination or natural geological occurrences within the bees’ foraging ranges, providing crucial baseline data on the habitat quality impacting these wild bee populations. As A. dorsata Binghami foragers collect nectar, pollen, and water from their environment, their honey acts as a biomonitor of environmental pollution and geological anomalies within their foraging ranges (Moroń et al., 2012; Zarić et al., 2022). The detection of these heavy metals, even in seemingly natural forest settings, raises important questions about their sources (e.g., natural geological occurrences, atmospheric deposition from distant anthropogenic activities, or localized impacts) and, more importantly, their potential implications for the health, physiological stress, and long-term viability of A. dorsata Binghami colonies. This finding highlights a crucial aspect of habitat quality impacting this wild bee population that needs to be considered during honey processing for human consumption.
4. CONCLUSION AND FUTURE DIRECTIONS
Comprehensive chemical analyses revealed that A. dorsata Binghami honey contains a rich profile of bioactive compounds. GC-MS identified ten groups comprising 111 derivative volatile compounds, indicating a high concentration of volatile substances. HPLC analysis confirmed the presence of key phenolic compounds such as protocatechuic acid and gallic acid. FTIR spectroscopy further supported these findings by detecting significant amounts of phenolic and flavonoid functional groups. Importantly, antioxidant activity assays demonstrated that honey from Southeast Minahasa honey possesses the highest free radical scavenging capacity with an IC50 value of 92.86 mg/L. These results highlight the potential health benefits and quality attributes associated with A. dorsata Binghami honey from this region. Overall, this study underscores how environmental factors shape the composition and biological properties of A. dorsata Binghami honey in North Sulawesi, Indonesia while emphasizing its promising nutraceutical potential.