

Introduction
The cultivation of vanilla, unknown to the outside world, and the natural quality of the fragrance and flavor of Malagasy vanilla offer Madagascar a great opportunity. Madagascar has been the world's leading exporter of this aromatic plant for many years. The big island provides more than 70% of the world’s supply. The United States imports more than 60% of vanilla exports from Madagascar, followed by France with 20% (Raharimanganindriana, 2007). However, Malagasy vanilla is affected by the slump in the international market. In fact, supply has never matched demand, and the price always surprises every year. In addition, the climatic hazards do not really reassure the operators of the sector. Moreover, the world consumption of natural vanilla continues to decrease and the substitute product is gaining ground (Andriamanamamonjy, 2014).
In addition, technical requirements impose on customers to carry out quality control analysis of their products in laboratories that use standardized testing methods (Ducauze, 2003). The duration of this test is a minimum of 48 hours, the extraction operation of vanilla flavor occupies more time in the control procedure in the laboratory (CIRAD, 2018).
In recent years, conventional heating in analytical chemistry and quality control laboratories is beginning to rival microwave heating (Sinquin, Görner, & Dellacherie, 1993). Preparative chemistry, such as the solid-liquid extraction that we are interested in for the extraction of aromatic molecules from vanilla pods, must also reduce its duration while maintaining its efficiency and selectivity (Ghasemzadeh, Jaafar, Rahmat, & Swamy, 2017; Karazhiyan, Razavi, & Phillips, 2011; Meziane, 2014). Microwaves bring a solution of choice thanks to selective heating and fast, without inertia. Moreover, the process of Microwave extraction (MAE) discovered in irradiating by microwaves the plant material, previously ground or not, in the presence of a solvent that strongly absorbs microwaves such as water, methanol and ethanol for the extraction of polar compounds, or in the presence of a solvent which does not absorb microwaves such as hexane for the extraction of apolar compounds. This technique is much more efficient than a conventional method and allows to reduce the extraction time and thus the energy expenditure (Ghasemzadeh et al., 2017; Hiew et al., 2022; Kaufmann & Christen, 2002; Li et al., 2017).
Modeling and optimizing the complex process in extraction conditions where numbers of influence and their interaction affects responses, Response Surface Methodology (RSM) becomes a valuable tool and technique (Hiew et al., 2022; Khatkar, Arun, & Ansari, 2017). RSM subtracts the user to recognize the optimal conditions for the selected response while minimizing the set of responses required. RSM also includes a range of mathematical and statistical methods that can be used to study the relationship between a range of factors (independent variables) and one or more responses (dependent variables) (Bezerraa, Santellia, Oliveiraa, Villara, & Escaleira, 2008; Myers, Montgomery, & Anderson-Cook, 2016).
Extraction time, microwave power, temperature, solvent composition and as well as solvent/material ratio are the factors that can influence extraction efficiency (Dai, 2006; Rguig, 2016; Yang, 2018).
In this study, the microwave-assisted extraction (MAE) method was applied to extract natural flavors from Vanilla planifolia beans. A one-way analysis was performed to examine the influence of parameters on the extraction efficiency, and then RSM was used to look for interactions between the main influencing parameters. In addition, a Soxhlet extraction was performed to compare the efficiency results. Finally, the vanillin rate of the obtained extract was tested by UV-Vis spectrophotometry and HPLC following the standard analytical method (Richard, 1999).
Materials and Methods
Reagents and solvents
The reagents necessary for the realization of the experiments and analyses were reagents of analytical quality ethanol 96°, distilled water, titrisol of sodium hydroxide 1M of Merck brand and pure vanillin 99.9% were used.
Plant materials
Vanilla beans were collected in the SAVA region (Sambava and Antalaha) during the 2020 - 2022 vanilla season. In collaboration with our colleagues working at the conditioning station within the regional directorate of the Ministry of Industrialization, Trade and Consumption. The ripe vanilla beans were packed in sulfur paper, air dried at room temperature, ground into fine particles (0.5 mm particle size), and stored at 20°C in a desiccator until further use.
Microwave modification
The microwave-assisted extractions were performed in a domestic microwave oven. The oven modifications are described in Figure 1, with the following characteristics:
• 6 adjustable power levels (High: 100% power, Medium High: 85% power, Medium: Power 66%, Medium-low: power 40%, Defrost: power 37%, Low: Power 17%.
• Power output 700 W,
• Wave source by magnetron,
• Operating frequency: 2450 MHZ,
• Voltage: 220 - 240 V - 50 Hz,
• The dimension of the cavity microwave is 206 mm (H) x 300 mm (W) x 302 mm (D).
• Extraction at atmospheric pressure.
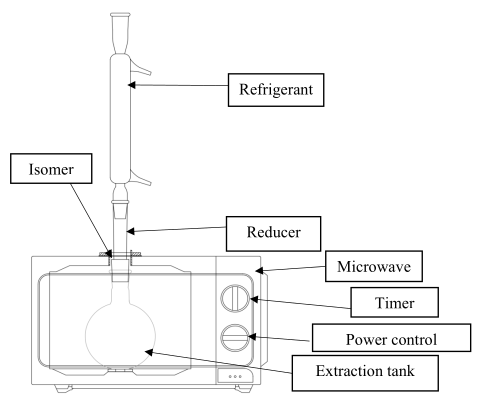
Microwave extraction instrument is equipped with a monitor to control operating parameters, such as operating time and microwave power.
Visible UV spectrophotometry
The visible UV spectrophotometer of Beckmann brand is used for the determination of the vanillin level. The characteristics of the apparatus are as follows: radiation source: hydrogen lamp of wavelength 300 nm to 900 nm; monochromator: prism; sample carrier: quartz tank; detector: photodiode and a digital LED signal processing system.
High Performance Liquid Chromatography (HPLC)
The analysis equipment is an HPLC equipped with: a Perkin Elmer UV/VIS detector; an LC Series 200 pump, a 20 µl injector, a 125Å µBondapak-C18 column, granulometry 10µm, 4.6×150 mm, and an AZUR 6.1 software for data acquisition.
Extraction of vanillin from pods
Microwave-assisted extraction
The ground vanilla beans of mass m were placed in a 150 mL Pyrex extraction flask and mixed with the extraction solvent, whose volume was determined according to the test plan. Then, the flask containing the mixture was placed in the microwave extractor and then irradiated under the given requirements of: temperature, time and microwave power. For loot, allow the mixture to cool before filtering it with wattman filter papers. The extract obtained was collected for the determination of vanillin by either of the methods described in ISO 5565 -2: 1999 rev 2016 (F), High-Performance Liquid Chromatography (HPLC) method and UV/VIS spectrometry method.
Determination of vanillin by HPLC
The vanillin content depends essentially on the conditions of cultivation, harvesting and preparation of the pods, as well as the extraction technique used. High performance liquid chromatography (HPLC) is the standard method for the determination of vanillin.
Operating conditions: The analysis equipment is an HPLC with: Perkin Elmer UV/VIS detector; One LC Series 200 pump; A 20 μl injector; A μBondapak-C18 125Å column, 10μm particle size, 4.6×150 mm; AZUR 6.1 software for data acquisition. The eluents used are: Methanol (Eluent A); Distilled water acidified to 0.1% with sulfuric acid (Eluent B). Analysis parameters: The analyses were performed at room temperature, using an elution gradient of 20% A and 80% B for 1 min; then 40% A and 60% B for 14 min. The analytical parameters were as follows: A flow rate of 1 ml per minute; An injection of the same volume of 20 μl; A detector wavelength set at 254 nm; Three successive injections for each sample to be analyzed.
Determination of vanillin by UV Vis Spectrophotometry
Weigh m grams of previously crushed vanilla pods, and then extract the vanilla flavor with ethanol using different extraction procedures (MAE or Soxhlet). Then filter and transfer the resulting extract to a 100 mL volumetric flask (stock solution). In another 100 mL volumetric flask, pipette 10 mL of this stock solution, then bring the ethanol to the mark and mix well (Test Sample). In a 100 mL volumetric flask, pipette 2 mL of the sample to be tested and add 2 mL of 0.1 M sodium hydroxide solution, then bring distilled water to the mark and shake well (Test) Density measurement spectrophotometer (OD) of the test compared with the control solution at 348 nm, using a spectrophotometer and a spectrophotometer cell.
The content of vanillin, expressed as a percentage by mass of the "tested" sample, is
D.O(348 nm): Maximum absorbance of vanillin at 348 nm,
Experimental design
Single-factor experimental design
Single-factor experimental design helps to evaluate the effects of four (04) factors that affect on the vanillin content in the pods, including ethanol concentration that varies from 0% (water) to 90%, solvent to material ratio varies from10 to 50 mL/g, extraction time from 5 to 90 min, and microwave power from 150 to 700 W. After experimenting with single-factors, the Three resulting factors with a higher effect are then selected for the design of the subsequent response surface procedure.
Analysis of variance (ANOVA and central composite rotational design
Response surface method (RSM) was used to detect the variables of the optimized Microwave extraction method for extracting vanillin compounds using the central composite rotating design or CCRD (XLSTAT 2014 professional version and Minitab 11). Three replicas were used to evaluate the simple error. Design of experiment (DOE, XLSTAT) software was used for regression analysis of experimental data to fit a second-order polynomial equation (quadratic model). According to the following general equation:
where y is the response function (percentage of vanillin), βo is the constant coefficient, βi; βii and βji are the coefficients of the linear, quadratic and interaction terms. And Xi and Xj are types of independent variables. The regression coefficients for the linear, quadratic and interaction terms were obtained using analysis of variance (ANOVA).
To visualize the correlation between the experimental level responses of each factor and to determine the optimal conditions, regression coefficients were created the 3D surface plots and contour plots from the fitted polynomial equation.
Results and Discussion
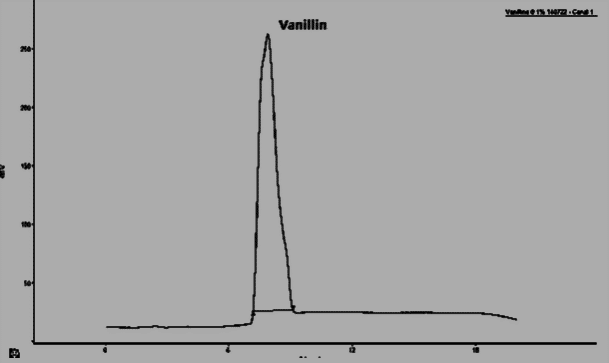
Chromatogram of vanilla extract
In this section, the Figure 4; Figure 3; Figure 2 gives an overview of the HPLC analysis of Vanilla extract obtained by MAE, conventional methods and the reference product.
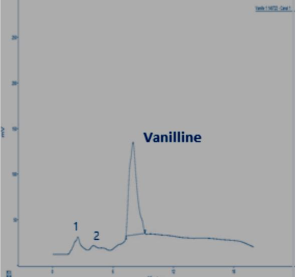
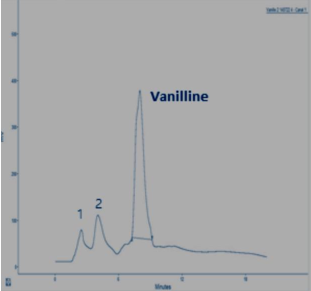
The two other signals, noted 1 and 2 observed on the chromatograms of the extracts can be respectively p-hydroxybenzaldehyde and p-hydroxybenzoic acid. The results of the HPLC analysis of a sample of vanilla pods extracted by the two extraction processes show that the vanillin content is equal to 0.895% for the extraction by MAE (with the optimal conditions). The same sample extracted according to Soxhlet, the vanillin content is 0.635%.
Single-factor experiment
Effect of ethanol concentration
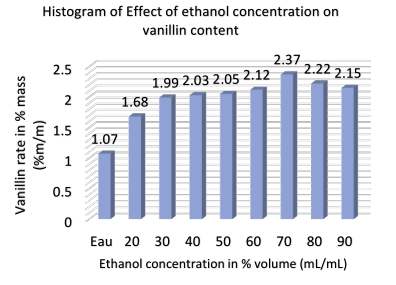
In this study, a water-ethanol mixture was chosen as the extraction solvent because of low toxicity and easy accessibility. The solvent system (Water-ethanol) is widely used in vanilla bean extraction. Changing the percent ethanol concentration from 0 to 90% affected the extraction efficiency, which was examined under the following conditions: solvent-to-material ratio of 20 mL/g, extraction time of 45 min, extraction temperature of 30°C and a power of 400 W.
Figure 5 shows that when the concentration of ethanol increases from 0% to 70%, the mass percentage of vanillin increases from 1.07% to 2.37% in 100 grams of bean. Despite the fact that when the concentration of ethanol increased from 70% to 90%, a slight decrease in the percentage of vanillin was noted. Therefore, an ethanol concentration of 70% was chosen in subsequent experiments.
Effect of the solvent/matter ratio (S/M
The solvent/substance ratio (S/M ratio) can influence the extraction efficiency, since a higher S/M ratio can lead to a higher concentration difference, solvent saturation, within certain limits, which has some advantages for mass transfer and solute solubility. The influence of S/M ratio on extraction efficiency had been studied between 10 and 50 mL/g, while controlling for other factors such as: 70% ethanol concentration, 45 minutes extraction time, 30 °C extraction temperature and 400 W microwave power. Fig. 6 shows that the percentage of vanillin increased significantly when the S/M ratio increased from 10 to 30 mL/g but slowly decreased when the S/M ratio increased from 30 to 50 mL/g. This indicates that the material transfer process reached its maximum level then the S/M ratio reached 30 mL/g. Therefore, a S/M ratio of 30 mL/g was chosen in subsequent (Figure 6).
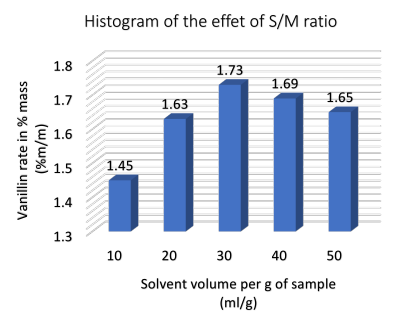
Experiments
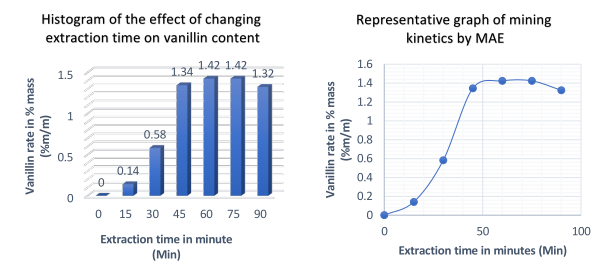
Extraction time effect
The impact for varying extraction time from 0 to 90 min had been studied on the efficiency of Microwave assisted solvent extraction. The following operating conditions are adopted for this experiment: ethanol concentration 70%, S/M ratio 30 mL/g, extraction temperature 30 ◦C and microwave power 400 W.
As shown in Figure 7, the vanillin content increased from 0 to 1.42% vanillin per 100 g of beans over a period of 0 to 60 minutes. If the extraction time is gradually increased, the value of the vanillin rate remains unchanged until 75 min and then if we continue to increase the time, the value of this rate decreased by 1.32%. This means that prolonged microwave exposure of vanilla can lead to spoilage of the natural product. Similar results have been obtained in studies on anthocyanin extraction from Sweet Tea (Lithocarpus polystachyus Rehd) (Khatkar et al., 2017) and tomato seeds (Hamzi & Guenfis, 2015). Therefore, an extraction time of 60 min was chosen in consecutive experiments.
Effect of microwave power
Microwave power could also influence the vanillin yield in pods during the MAE process. Figure 8 shows the effect of different power settings from 100 to 700 W on extraction efficiency.
The following operating conditions are adopted: ethanol concentration of 70%, S/M ratio of 30 mL/g, extraction time of 60 min and extraction temperature of 30°C. According to the results, the percentage of vanillin per 100 grams of bean increased with the microwave power from 100 to 400 W, and reached the peak of 1.432% at 400 W power level. When we continue to gradually increase the microwave power, therefore, the vanillin level tends to decrease. This means that during the MAE process, microwave power has a very important influence on extraction efficiency. An increase in power could accelerate the movement of the solvent, cell disruption and diffusion of extracts or aromatic molecules into the solvent. Thus, a microwave power of 400 W was chosen as the optimal microwave power in the experiments.
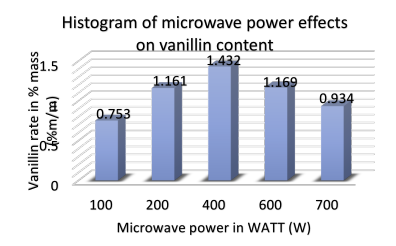
Table 1 summarizes the single-factor effect design of the microwave-assisted solvent extraction method.
Table 1
Single factor effect on vanillin extraction from vanilla beans by microwave-assisted extraction (MAE) method.
The RSM response surface method
Based on the results of the single-factor experimental design, three independent variables (ethanol concentration, S/M ratio, and microwave power) had a greater effect on the extraction efficiency. Thus, they were chosen in the design of the RSM, for further optimization.
A medium quality was adjusted to 70% ethanol, an S/M ratio of 30 ml/g and an extraction power of 400 watts. The temperature and extraction time of the MAE process are 30°C and 60 minutes, respectively.
The experimental design of the 19 essay and the correlated response values and predicted values are shown in Table 2 below. The results present that vanillin levels in vanilla beans ranged from 0.3 to 1.55% vanillin /100 beans.
Table 2
The Centered Composite Design, the experimentalvalue and the predicted value of the Response Surface Method RSM.
Modeling and Model Fitting Using RSM
In this study, multiple regression fitting was used to analyze the data in Table 2 and a quadratic (polynomial) model equation fit (equation (1)) was generated (Carbon, 2015; Dai, 2006; Rakotomalala, 2018) describing the relationship between the 3 variables (
Optimization of the extraction conditions by MAE
The parameters and regression coefficients related to the segmental, linear, quadratic and interaction terms of the optimization model for microwave extraction of vanilla beans were calculated by least squares method (Dai, 2006; Yang, 2018) and are presented in Table 4.
The two linear parameters, ethanol concentration (
An analysis of variance (ANOVA) was performed to assess the validity of the quadratic model equation. Table 3 below shows the ANOVA results.
Table 3
Results of the analysis of variance ANOVA
The results of the ANOVA experiment are presented in Table 3 above, showing that an F value of 9.9941 means that the model is clearly significant. There is an exceptional probability of 0.001% that such a high model F value could occur due to noise. The coefficient of determination R2 is 0.909 which implies that the sample variations of 90.9% for the efficiency of MAE extraction of vanillin from pods. MAE extraction of vanilla beans is attributed to independent variables with only 9.1% of the total variations not explained by the model. According to studies conducted by Karazhiyan et al. in 2011, an R2 value does not always indicate that the regression model is valid.
In a good statistical model, the adjusted R2 should be close to R2, as shown in Table 3, the values of R2 and adjusted R2 are 0.909 and 0.8181 respectively. The value of F at lack of fit is 139.5749 means that the lack of fit of model are significant compared to the pure error (Pr˃0.0001). In general, the results indicated that the model could work well for predicting the level of vanillin extracted from vanilla beans.
Table 4
Model parameters.
Response surface analysis
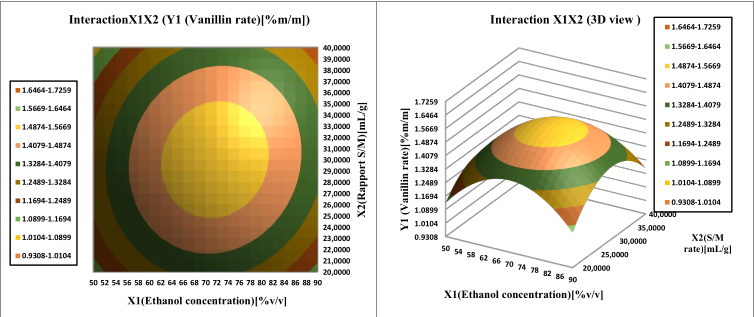
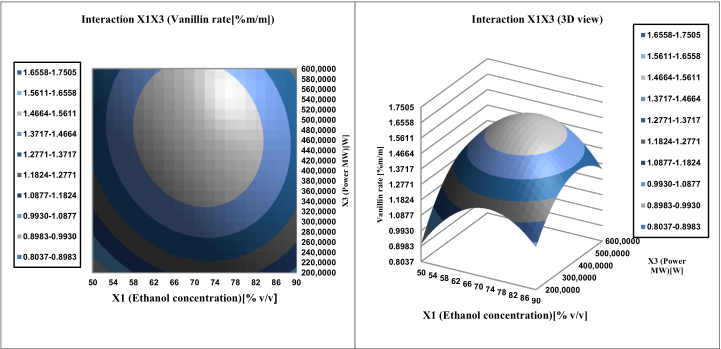
Investigate the interaction effect of the independent variables and their mutual interaction on vanillin extraction recovery in pods, 3D Profile of response surface of multiple nonlinear regression models was plotted.
Surface plots were created by plotting the z-axis response facing two independent variables, ethanol concentration (
Figure 10; Figure 9 illustrate Affinity between the ethanol concentration and each of the other two factors (W power and S/M ratio) on vanillin content determination. The vanillin percentage of the bean extract by the MAE extraction process increased from 1.487 to 1.566% vanillin per 100g vanilla bean. If we increase the ethanol concentration (from 50 to 90%) and the S/M extraction ratio (from 20 to 40 mL/g), then the vanillin content reaches a maximum at 72% ethanol. In addition, this proportion between the concentration of ethanol and the ratio of S / M is the best balance, the extraction of which should be achieved in order to obtain the maximum content of vanillin. From Table 4 shows that the vanillin content in the pods mainly depends on the concentration of the solvent, such as its quadratic and linear effects are highly significant (P <0.05), resulting in a curvilinear increase in vanillin yield for all S/M ratios and ethanol concentration.
The increasing vanillin content confirmed that the maximal amount of vanillin was dissolved in 70% ethanol. The results confirm the single-factor experiments. Ethanol can facilitate the extraction yield percentage, and water can improve the swelling of the cellular material, increasing the contact area between the plant substrate and the solvent., resulting in an increase in extraction yield (Huang, Xue, Niu, Jia, & Wang, 2009). Figure 6 shows the gradual increase in the vanillin content of pods. Therefore, if we initially increase the solvent concentration and the S/M ratio, the vanillin content in the pods will be reduced to average values. The data suggest that the Solvent/Material ratio affects the quadratic and linear effect (p < 0.05) on the vanillin yield of the extract.
The ratio of the independent variable (S/M ratio) from which we obtained the maximum vanillin-rich extract yield was:30.5 mL/g over a range of other operational factors (microwave power and extraction time).
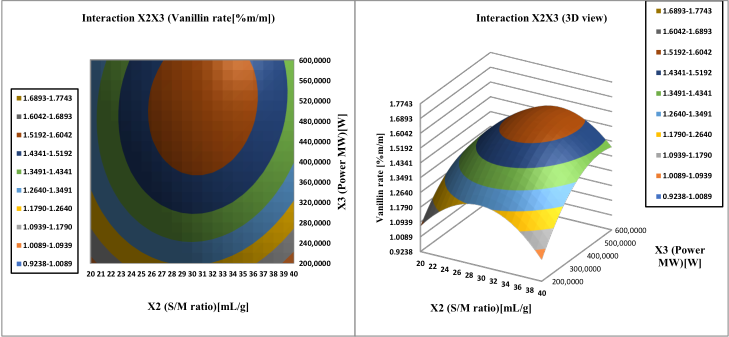
In process MAE, Microwave power was a variable key affecting the release of phytochemicals and aromatic compounds from different matrices through cell wall disruption. and also had the ability to alter the equilibrium and mass transfer conditions during extraction. The extraction of vanillin from the pods accelerated with increasing microwave power (Dai, 2006; Hamzi & Guenfis, 2015; Khatkar et al., 2017).
As can be seen from Figure 10, increasing the Microwave power from 200 to 600 W manifested itself as a gradual increase in vanillin extraction yield. Hence, we obtained a slight decrease with a larger increase in S/M ratio (above 30 ml/g). This vanillin trend can be used to accelerate mass transfer and reduce the S/M ratio., due to the lower heating efficiency under microwave operating conditions and the solubility of vanillin. Figure 8 shows that a 3D surface map was created for vanillin recovery. with varying power and S/M ratio, the best vanillin recovery was obtained using Microwave power at 480 W and an S/M ratio of 30.5mL/g.
The interaction effect of the S/M ratio (
Figure 9
Response surface analysis for vanilla content of vanilla beans, Interaction Solvent/material ratio and ethanol concentration
Validation of the predicted model
The fixed point that gives the maximum extraction capacity of the vanilla bean with microwaves was obtained from the experiment with critical values: ethanol concentration: 72%; microwave power 480 W; irradiation or extraction time 60 min; and S/M ratio 30 mL /g.
The mathematical model's ability to predict optimal response values was tested using the optimal conditions selected above. The predicted vanillin content of the vanilla sample is 1.5661% vanillin, which is consistent with the experimental vanillin content of 1.524%. The predicted values are in perfect agreement with the experimental values and were found to be non-significantly different (p > 0.05) using a paired t-test. The predicted response values deviate slightly from the experimental data.
Conclusion
The MAE method in combination with the response surface methodology (RSM) was used in the present study to determine the extraction efficiency of vanillin from Madagascar vanilla beans and to optimize the extraction conditions. In Quality control in the laboratory and in industrial production, the application of the microwave extraction method to extract biologically active and aromatic compounds from plant material requires a mathematical model to optimize and predict the process to replace traditional extraction methods. Appropriate and optimized processing conditions, such as extraction, are required for efficient recovery.
A quadratic polynomial regression model is obtained, the optimal conditions for the determination of vanillin levels in vanilla beans are as follows: ethanol concentration: 72%; microwave power 480 W; irradiation or extraction time 60 min; and solvent/material ratio 30 ml/g solvent.
The present study confirmed that the MAE method has some advantages such as: reduction of extraction time, lowering of extraction temperature, reduction of organic solvent use, energy saving and also a green extraction method that converts the environment. Following our work, validation of the microwave extraction method of vanillin in pods by comparative studies with the conventional method Soxhlet will be carried out a proposal of vanillin extraction procedure for application in the laboratory.