

Introduction
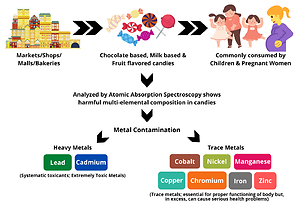
In the last decades, toxic level contamination due to essential trace metals and the presence of extremely harmful heavy metals in food products have emerged as a major threat to public health. The essential metals; also known as trace metals are certainly very important for the proper functioning of human body; however, in excess, they can produce adverse health conditions (Duran, Tuzen, & Soylak, 2008). The human body needs trace metals only in minute quantity amounting mg/day, microgram or less than microgram/gram of body weight while, mere presence of few toxic metals such as Lead (Pb), Cadmium (Cd) can cause severe health problems. The human body can only tolerate an extremely low exposure to these lethal metals. Generally, humans are exposed to metals through ingestion (drinking or eating), inhalation (breathing, air) and absorption (skin). Toxicity due to metals is generally classified as (i) Acute Toxicity; sudden high exposure or exposure of about 14 days or less, (ii) Intermediate Toxicity; due to the exposure of about 15 to 354 days; and (iii) Chronic Toxicity; due to the gradual exposure of more than 365 days (Ferner, 2001). Chronic exposure may happen due to intake of contaminated food, air, water, and by living near a hazardous waste site and through maternal transfer in the womb, etc. Symptoms of chronic toxicity are often similar to many common pathological conditions and the actual cause may not be readily identified. As such, the heavy metals are stable and accumulative in the body tissues as they cannot be metabolized by biochemical processes of the body. If the metals enter and accumulate in body tissues much faster than their disposal through various detoxification pathways, then, a gradual buildup of these toxins will occur (Ferner, 2001). Their early exposure is not necessary to produce a state of toxicity in the body tissue but, in due course, it starts interfering with biochemical mechanisms and in turn, start damaging the body organs (Ekpo, Asia, Amayo, & Jegede, 2008; Hakanson, 1984; Prusty, 1994). It does not matter how good health supplements, one takes, excess of metals in the body will damage the natural functioning of the body. Therefore, the quantitative analysis of these metals in various kinds of food products is chiefly important; especially in those food items which are frequently consumed by children and pregnant women (Duran et al., 2008). Unquestionably, children are the well-known consumers of chocolate and candies. Besides, pregnant women also like to consume chocolate and candies to get relief from nauseated feelings. As children and pregnant women, both are the most vulnerable group to any kind of contamination, thus, consumption of metal contaminated candies can raise serious health risks for them. Thus, there is a high need for determining the content of trace metals and heavy metals in different types of candies. Previously, several researchers have reported the leaching of Pb and Cd in candies from their metallic ink dyed colorful packaging (Dahiya, Karpe, Hegde, & Sharma, 2005; Duran et al., 2008; Kim et al., 2008). (Martinez et al., 2010), have reported a high level of trace metals in candy samples marketed in Mexico City. Despite being a matter of high importance, there are not enough literature and data available online concerning this issue. Therefore, in this study, an attempt has been made to evaluate the contamination due to metals i.e., Lead (Pb), Cadmium (Cd), Cobalt (Co), Copper (Cu), Chromium (Cr), Nickel (Ni), Iron (Fe), Manganese (Mn) and Zinc (Zn) in different variety of candies i.e., Cocoa-chocolate based, milk based and fruit flavored candies. Changes in the composition of nine metals were also studied by using multiple discriminant analysis to reverse-classify the examined samples based on the distribution profiling of these nine metals. In this study, sixty-seven (67 Nos.) candy samples including cocoa-chocolate based (20 Nos.), milk based (17 Nos.) and fruit flavored (30 Nos.) candies which can be commonly availed from the local markets of Lucknow city, were analyzed quantitatively to evaluate their contamination level due to metals. This is the first study that provides data for reverse identification of candy samples based on the inter-comparative profiling due to their multi-elemental composition.
Materials and methods
Sample collection
Sixty-seven candies of three different varieties i.e., cocoa chocolate based, milk based and fruit flavored candies were procured from the local market of Lucknow city, Uttar Pradesh, India. The samples were stored at 4°C until processed. Standard reference material solutions of all nine metals i.e. Cobalt chloride for Cobalt (Co), Copper sulphate for Copper (Cu), Sodium dichromate for Chromium (Cr), Nickel sulphate for Nickel (Ni), Ferrous ammonium sulphate for Iron (Fe), Manganese sulphate for Manganese (Mn), Zinc sulphate for Zinc (Zn), Cadmium nitrate for Cadmium (Cd) and Lead acetate for Lead (Pb) were purchased from Merck India Pvt Ltd. Ultra-pure water was manufactured in-house with a water purification system (Milli–Q synthesis Elix-10, Millipore Corp., Mass., U.S.A.). Each quantitative determination was performed in triplicates by using Atomic Absorption Spectrophotometer (AAS) model GBC (Avanta PM). All the parameters of AAS for the elemental measurement are shown in Table 1.
Sample preparation
Accurately weighed 1.0 gram of candy sample was taken in a conical flask and subjected to acid digestion with HNO3: H2O2 (3:1) on a hot plate at 60°C. The samples were evaporated slowly to dryness and left undisturbed to allow cooling to room temperature. The digested samples were then dissolved in 1% nitric acid and filtered through Whatman filter paper 1 and the final volume was made up to 10 mL in a volumetric flask. Each sample was processed in triplicate. A blank was also processed along with each sample batch.
Result
The mean variations among individual metal content in all candy samples have been tested by one-way analysis of variance (ANOVA) as shown in the Table 2. The individual comparison has been done by Bonferroni's multiple comparisons test. The inter-correlation of metals in each type of candy was also performed. The multiple Discriminant Analysis (MDA) model was also employed to distinguish the candies based on the quantitative composition of these nine metals. On comparing average elemental levels among all candy samples through one-way ANOVA, it was estimated that, out of nine analysed metals, three metals i.e., Chromium (Cr), Lead (Pb) and Copper (Cu) were found to be almost equally distributed (P>0.05) among three different variety of candy samples.
Table 2
Inter-comparison of average level of each metal in candy samples throughOne-way ANOVA
Candy Groups | Cr | Pb | Mn | Fe | Ni | Zn | Cd | Co | Cu |
Choco vs Milk | NS | NS | * | * | NS | NS | ** | * | NS |
Choco vs Fruit | NS | NS | ** | ** | ** | ** | ** | ** | NS |
Milk vs Fruit | NS | NS | NS | ** | ** | ** | NS | NS | NS |
The remaining six metals i.e. Manganese (Mn), Iron (Fe), Nickel (Ni), Zinc (Zn), Cadmium (Cd) and Cobalt (Co) have shown highly significant variation which indicates considerable dissimilarities in distribution of these metals among different variety of candy samples. Further, on comparing each metal content with other metals by using Bonferroni's multiple comparisons test (supplementary information data file), it was observed that Iron (Fe) has shown significantly (P <0.0001) higher least square differences (LS diff.) as presented in the Figure 1, which indicates that, out of nine metals, Iron (Fe) was measured at the highest level whereas Cobalt (Co), Copper (Cu) and Manganese (Mn), were found at the lowest quantity with the least values for LS diff. amid each variety of candy samples. It may be mentioned that iron was found at significantly higher level in cocoa-chocolate based candies as compared to milk-based and fruit flavored candy samples while, Cobalt (Co), Copper (Cu) and Manganese (Mn) were detected at considerably lower level in cocoa-chocolate based candies comparing to milk based and fruit flavoured candies as presented in Figure 2 and Table 3. Likewise, considerably higher LS diff. was observed for Nickel on comparing fruit flavoured candies with cocoa-chocolate based (P≤0.0002) and milk based candies (P≤0.031) which suggests that in cocoa-chocolate based candies, Nickel was present at abnormally higher level than in milk based and fruit flavoured candies. Also, in contrast with other group of candies, fruit flavoured candies have indicated relatively high LS diff. with considerably lower concentration levels for Lead (Pb), Iron (Fe), Nickel (Ni) and Zinc (Zn). The outlier values as presented in the form of plus symbol (+) in the Figure 1, indicates that several samples among each group of candy, were found to be highly contaminated with particular metals e.g. Pb, Cd, Zn, Mn, Ni and Cr. The quantitative composition for individual metal in each candy sample can also be clearly seen in the Figure 2.
Figure 1
representes the least square (LS) differences with 99% confidence interval for individual metal profiling among three variety of candies viz. Cocoa chocolate based, Milk based and Fruit flavoured candies

Further, Cadmium (Cd) was detected in the least quantity in milk based and fruit flavoured candies, while, in cocoa chocolate based candies, it was measured at relatively high level as represented in Figure 1.
Overall, Iron (Fe), Nickel (Ni), Zinc (Zn), Chromium (Cr), Lead (Pb) and Cadmium (Cd) were measured at comparatively the highest mean level in cocoa-chocolate based candies than in milk based and fruit flavoured candies as shown in the Figure 2. Moreover, it can be easily assessed that cocoa-chocolate based candies were found to be more contaminated with metals, comparing to milk based and fruit flavored candies as presented in Figure 1, which raised the concern particularly towards consumption of cocoa-chocolate based candies.
Further, the individual metal concentrations corresponding to each candy sample, were represented in the form of heat map with square colored boxes as shown in the Figure 2, where, the red and dark brown colored boxes were the representative of those candy samples which were found to be highly contaminated with specific metals in the concentration ranges of 4.00 to 7.00 µg/g and 7.00 to 11.00 µg/g respectively. Figure 2 shows that Iron (Fe) was detected at strangely high levels in each variety of candy samples, particularly in cocoa chocolate based candies. Additionally, Lead (Pb) was also detected in high concentrations in a couple of cocoa chocolate based candies. Besides, light blue and purple colored boxes have represented those candy samples in which particular metals were detected at mid-range concentrations from 1.00 to 2.00 µg/g and 2.00 to 4.00 µg/g as depicted in the Figure 2. Again, mostly Iron (Fe) was detected at mid-range levels in milk based and fruit flavoured candies.
Also, Nickel (Ni), Chromium (Cr) and Lead (Pb) were found in the similar ranges in many of the candy samples among each variety of candies. Further, yellow and green colored boxes have presented the candy samples in which the individual metal was detected at the least levels from 0.01 to 0.05 µg/g and 0.05 to 0.50 µg/g correspondingly, where, fortunately, candmium (Cd) was measured in almost negligible quantities in most of the candy samples in each variety, specially, in fruit flavoured and milk based candies. Copper (Cu), Cobalt (Co) and Manganese (Mn) were usually detected at the least levels in almost every candy sample, expect a few candy samples which have shown noticeable metal concentration from 0.50 to 1.00 µg/g, as presented in the pink colored boxes in Figure 2. Additionally, Chromium (Cr) and Lead (Pd) were also detected at noticeable concentrations in the majority of the candy samples in each variety.
Figure 2
Heat map representing the quantitative distribution of individual metal in each candy sample of Cocoa chocolate based, Milk based and Fruit flavoured candies

The mean level (µg/g), standard deviations and concentration range (µg/g) for all analysed metals in each variety of candy samples have been given in Table 3. Additionally, from the pearson’s correlation analysis, it was observed that the pearson’s r values were predominantly near zero, either with non-significant (p>0.05) positive correlation or negative correlation as depicted in the Table 4, which suggests that the presence of individual metals were not inter dependent on each other in the analysed candy samples. Except, in few samples, particularly in cocoa chocolate based candies where extremely significant (p<0.001) high coefficient of variations as highlighted in the Table 4 were measured for few metals among varied candy groups which might be the resultant of unusually high contamination in few candy samples with specific metals. Further, milk based and fruit flavored candies have mainly shown non-significant r values except few less significant r values which again point towards no correlation or negligible correlation amid 09 metals in the analysed candy samples. Moreover, the outcome of pearson’s correlation also represents the heterogeneity among candy samples of different groups as well as of similar group, depending on their unique multi-elemental quantitative profiling.
In order to statistically identify the heterogeneity among unlike group of candies, Multiple Discriminant Analysis (MDA) was applied to reverse classify them, based on the quantitative distribution of all analysed metals. The concentration of individual metal in each candy sample was given in the supplementary information data file. The literature survey shows that the application of MDA model was not yet explored by any researcher for re-identifying the type of candy based on their inter-comparative multi-elemental profiling. By application of MDA, it was found that the group of fruit flavored candy has shown 100% correct classification which specifies that the targeted metals (09 Nos.) were distributed almost uniformly among all samples of fruit flavored candies and thus, they can be easily reverse identified. Likewise, chocolate-based candies have shown 95% correct classification indicating a slight non-uniformity in the distribution of nine metals among all samples of cocoa chocolate based candies.
On the contrary, milk-based candies has shown 64.7% correct classification which specifies that milk-based candies cannot be reverse identified due to considerable non-uniformity in their multi-elemental composition. The candy samples with a high level of non-uniformity for individual metal also indicates more dissimilarities in candy manufacturing processes, type of packaging used, storage facility, transportation methods, type of raw materials used, and country of origin. Therefore, a well-planned research study is required to confirm the reasons behind metal contamination at each step of candy processing.
Table 3
The mean level (µg/g), standard deviations and concentration range (µg/g) for all analysed metals in each variety of candy samples
Table 4
Correlation variations among individual metal content among candy samples of similar variety.
Discussion
Some metals such as Cobalt (Co), Copper (Cu), Chromium (Cr), Nickel (Ni), Iron (Fe), Manganese (Mn) and Zinc (Zn), are considered as critically essential for the proper growth and natural functioning of the human body which acquired less than 0.01% of dry weight of the organism (Taylor, 1996; Yalcin, Aydin, & Elhatip, 2008) On the other hand, heavy metals such as cadmium (Cd) and lead (Pb) are harmful to the human body, even in minute amounts (Goyer, 1991). The gradual accumulation of Cd and Pb in the body may induce severe health problems such as anemia, organ damage, neurotoxicity; brain damage, psychological disorders, loss of memory, reduce IQ level, softening of bones, kidney dysfunction, skeletal damage, reproductive deficiencies and death (Schwartz, 1984) as detailed in the Table 5 also. The effects of Pb on human body have been extensively studied for its antagonistic properties towards the central nervous system (CNS) (Flegal & Smith, 1995; Needleman, Schell, Bellinger, Leviton, & Allred, 1990; Waldron, Jerome, & Nriagu, 1983). Other than occupational, industrial, and environmental sources, humans are mainly exposed to metals through consumption of beverages and food products (Duran et al., 2008). Considering these facts, International Food Safety Authority (IFSA) and World Health Organisation (WHO) have established provisional tolerable weekly intake (PTWI) limits for Pb and Cd at 25µg/kg and 7µg/kg body weight (FAO/WHO, 2001; WHO, 1989). For a child with body weight 20kg, the PTWI for Pb and Cd would be 500 µg/week and 140 µg/week. In addition, the Turkish standards have also set the limits for Pb between 1.0 and 2.0 mg/kg in chewing gum and candies respectively as shown in the Table 6 (Turkish-Standards, 1993; Turkish-Standards, 1996). As per Anonymous, maximum permitted limit for Pb in cocoa candies is 1.0 mg/kg (TurkishFoodCodex, 2002). Also, Polish National Standard, has decided the maximum permitted levels for Pb and Cd at 0.30 mg/kg and 0.05 mg/kg in chocolates (FAO/WHO, 2001). The recommended daily dietary allowance, stipulated permissible limits, previously reported data along with the findings of this study, have been clearly depicted in Table 6.
In the present study, few candy samples were found to be contaminated with Pb and Cd at significantly higher level ranged up to 5.124 µg/g and 1.256 µg/g respectively as shown in Table 3. Earlier studies have also reported Pb and Cd content in different varieties of candies in the range of 0.049–8.04µg/g, 0.031–2.460 µg/g and 0.001–2.730 µg/g, 0.027–0.825µg/g correspondingly as given in the Table 6 (WHO, 2009). (Martinez et al., 2010), have also analysed candy samples marketed in Mexico City and reported a high level of Pb (0.102 to 0.342 μg/g) in few candy samples. Surprisingly, Pb and Cd content were observed more than the permissible level defined for Pb in candies by (Turkish-Standards, 1996) and the maximum limits established for Pb and Cd in chocolates at 0.30 mg/kg and 0.05 mg/kg by (FAO/WHO, 2001).
Essential metals such as Nickel (Ni), helps to produce red blood cells and beneficial as an activator in some enzyme systems (Underwood, 1971) (U.S.NRC, 1975), however, in excess, Nickel can produce extremely toxic effects such as decreased body weight, heart and liver damage, severe skin irritation, bronchial hemorrhage etc. (WHO, 2009). The requirements, advantages and harmful effects on human body from essential and hazardous metals were detailed in Table 5. Chocolate candies are frequently reported to be contaminated with Nickel, because of its use as catalyst during the manufacturing process i.e., hardening of chocolate by hydrogenation of unsaturated fats and during processing, transportation and storage in nickel containers (Mesallam, 1987; Selvapathy & Saraladevi, 1995). Worldwide, many researchers have reported that the daily dietary intake for Nickel is between 200 to 900µg/day per person (Larsen et al., 2002; Nielsen & Flyvholm, 1984; Smart & Sherlock, 1987). But, in Indian food, nickel content is reported much higher, ranged from 240 to 3900 µg/day (CR & P, 1991). As far as Nickel is concerned, its maximum permitted limit in some food samples was decided at 0.2 mg/kg, by Anonymous 2002, whereas in candies, the permitted level for Nickel was not defined by any food safety authority (TurkishFoodCodex, 2002). Previously, several researchers as (Duran et al., 2008) and (Dahiya et al., 2005), have also reported Ni content in the range of 0.041–8.23 μg/g and 0.120–2.588 μg/g in different types of chocolates and candy samples as depicted in the Table 6.
Similarly, in this study, Nickel was detected at the levels of 0.177-4.256 μg/g, 0.065-3.561μg/g and 0.079-1.021μg/g in cocoa-chocolate based, milk based and fruit flavoured candies respectively as shown in Table 6. In addition to ingestion of Nickel through various other food products, the above-mentioned levels of Nickel in candy samples can be considered very harmful for compulsive chocolate consumers. Additionally, Chromium was also found at noticeable concentrations ranged from 0.427 to 3.122µg/g (Cocoa-chocolate based candy), 0.148 to 1.799µg/g (Milk based candy) and 0.213 to 2.512µg/g (Fruit flavored candy) which can be clearly seen in Figure 2. In the previous studies, Chromium (Cr) was also reported at high levels from 0.740 – 6.265 mg/g and 0.088 – 0.39 mg/g in various candy samples (Duran et al., 2008; Martinez et al., 2010). As such, trace amount of Chromium (Cr) is considered as vital component for glucose-tolerance by acting as a co-factor for insulin action via forming a ternary complex with insulin receptor through peripheral activity, which in turn assist the insulin fixing and control the metabolism of carbohydrate, lipids and proteins as given in Table 5 (Duran et al., 2008). However, even a little excess of Chromium can reduce the effectiveness of insulin at controlling blood sugar and can cause stomach irritation, itching, fast and irregular heart rhythms, and liver problems. And the findings of this study indicates significant chromium contamination in few of the candy samples in each candy group as shown in Figure 2.
Table 5
Necessary functions and harmful health effects of metals on human body.
Metals analysed in Candies in this study | Role of metals in trace quantity in proper functioning of human body | Harmful health effects due to excessive quantity |
Nickel (Ni) | Activator in enzyme systems Produces RBCs - (NRC, 1975; Underwood, 1971) . | Body Weight loss Heart & liver damage Severe skin irritation Bronchial haemorrhage (WHO, 2009) . |
Chromium (Cr) | Glucose-tolerance factor Co-factor for insulin action controls the metabolism of carbohydrate, lipids and proteins (Duran et al., 2008) . | Reduces insulin effectiveness Hypoglycaemia, stomach irritation, itching, fast and irregular heart rhythms, liver damage, nerve damage (Duran et al., 2008; Martinez et al., 2010) . |
Copper (Cu) | Essential for enzymatic reactions Control the body pigmentation in addition to Fe Maintain body growth, protect from infections, bone abnormalities and glucose and cholesterol metabolis (Carbonell-Barrachina, García, Soriano, Aracil, & Burló, 2002) . | Kidney failure, Anaemia, Heart Damage, Severely low blood pressure, Wilson’s disease (Carbonell-Barrachina et al., 2002) . |
Manganese (Mn) | Essential cofactor in metabolic processes and fatty acid synthesis. Bone and tissue formation and reproductive functioning (Mohadesi & Falahnejad, 2012) . | Neurotoxic element, can cause impaired motor skills, neuro-degenerative diseases (Manganism, Alzheimer's disease, Parkinson's disease), cognitive and childhood developmental disorders (Proudfoot, 2017) . |
Iron (Fe) | Critically required for Blood Production. Important role as a catalyst for proper metabolism in the human body (Arvan & Spitalnik, 1999) . | Excessive accumulation leads to iron overload disorders, such as hemochromatosis. Accumulation in the hippocampus region of the brain can cause Alzheimer's disease and Parkinson disease (Brar, Henderson, Schenck, & Zimmerman, 2009) . Damage to the cells of heart and liver Metabolic acidosis, shock, liver failure, coagulopathy, adult respiratory distress syndrome, long-term organ damage, DNA damage (Cheney, Gumbiner, Benson, & Tenenbein, 1995). |
Zinc (Zn) | Catalytic agent in various enzymatic reactions Proper functioning of the brain and central nervous system (Bitanihirwe & Cunningham, 2009) Critically required for synaptic plasticity and hence in learning (Nakashima & Dyck, 2009) . | Excess of zinc can cause neurotoxicity, depressed growth, reproductive problems, impaired appetite, renal diseases Excessive absorption of zinc suppresses copper and iron absorption (Candlish, 2000) . |
Cobalt (Co) | Key element of vitamin B12 which is necessary for cell metabolism in human body, fatty acid synthesis, energy production and for the normal functioning of the brain and nervous system (Basketter, Angelini, Ingber, Kern, & Menné, 2003) . | Contact dermatitis, Cardiomyopathy, Deafness Nerve problems, Ringing in the ears (tinnitus) Thickening of the blood, Thyroid problems Vision problems (Basketter et al., 2003) . |
Lead (Pb) | No known beneficial function. Toxic in trace quantity. | Induces chronic health problem i.e., Anaemia, Organ Damage & Neurotoxicity i.e., Brain Damage, Psychological Disorders, Loss of Memory, Reduced IQ Level (Schwartz, 1984) . |
Cadmium (Cd) | No known beneficial function. Toxic in trace quantity. | Bone Softening, Kidney Dysfunction, Skeletal Damage & Reproductive Difficulties (Schwartz, 1984) . |
Table 6
Recommended daily dietary allowance, permissible limits, reported data of previous studies for presence of metals in candies and the concentration of metals detected in candies in the present study.
Metals detected in candies in this study | Recommended daily dietary allowance (mg/day /person) | Defined Permissible Limits for metals in chocolates or candies by few national food safety authorities | Metal contamination in Candies reported by previously conducted studies | Concentrations of metals in candy samples analysed in this study | ||
Cocoa-chocolate based candy | Milk based candy | Fruit flavored candy | ||||
Pb | 0.21 mg/day/person (WHO, 2009) . | 0.30 mg/kg in chocolates (FAO/WHO, 2001) . | 0.049–8.04µg/g, 0.031–2.460 µg/g (Dahiya et al., 2005) . | 0.167-5.124μg/g | 0.241-3.471μg/g | 0.187-2.492μg/g |
Cd | 0.06 mg/day /person (WHO, 2009) . | 0.05 mg/kg in chocolates (FAO/WHO, 2001) . | 0.001–2.730 µg/g, 0.027–0.825 µg/g (Dahiya et al., 2005) 0.102-0.342 μg/g (Martinez et al., 2010) . | 0.000-1.256 μg/g | 0.000-0.095μg/g | 0.000-0.052 μg/g |
Ni | < 1 mg/day /person (Trumbo, Yates, Schlicker, & Poos, 2001). | 0.2 mg/kg in food products (No permissible limit defined in candies) (TurkishFoodCodex, 2002). | 0.120–2.588 μg/g (Dahiya et al., 2005) . | 0.177-4.256 μg/g | 0.0653.561 μg/g | 0.079-1.021μg/g |
Cr | 0.20 mg/day /person (J, 1989). | (No permissible limit defined in candies) | 0.740 – 6.265 µg/g and 0.088 – 0.39 µg/g (Duran et al., 2008; Martinez et al., 2010). | 0.427-3.122 µg/g | 0.148-1.799 µg/g | 0.213-2.512 µg/g |
Cu | 1.5 to 3.0 mg/day/person (J, 1989). | 10 mg/g in candies 5 mg/g in chocolate & cocoa-sugar 5 mg/g and 50 mg/g in chocolate and cocoa-sugar (Carbonell-Barrachina et al., 2002; Turkish-Standards, 1993; TurkishFoodCodex, 2002). | 0.219–2.455 µg/g and 1.07 – 2.74 µg/g (Dahiya et al., 2005; Duran et al., 2008) . | 0.095-0.550 µg/g | 0.148-0.618 µg/g | 0.069-0.580 µg/g |
Mn | 2.0 to 5.0 mg/day/person (J, 1989). | (No permissible limit defined in candies) | No permissible limit defined | 0.046-0.410 µg/g | 0.138-0.875 µg/g | 0.049-1.489 µg/g |
Fe | 10.0 mg/day/person (J, 1989). | 2.0 mg/kg in cocoa fat 0.2 to 25 mg/kg in some foods products. (TurkishFoodCodex, 2002). | 3.963–9.863 µg/g (Duran et al., 2008). | 1.218-10.890 µg/g | 0.982-8.691 µg/g | 0.925-5.168 µg/g |
Zn | 12 to 15 mg/day/person (J, 1989) | (No permissible limit defined in candies) | No permissible limit defined | 0.277-2.263 µg/g | 0.188-1.565 µg/g | 0.033-0.401 µg/g |
Co | Not defined | (No permissible limit defined in candies) | No permissible limit defined | 0.019-0.119 µg/g | 0.008-0.158 µg/g | 0.021-0.360 µg/g |
Further, Copper (Cu) is also critically required by the human body for necessary enzymatic reactions and to control the body pigmentation in addition to Fe and also required for maintaining the body growth, protection from infections, bone abnormalities, glucose and cholesterol metabolism as given in Table 5. However, undue accumulation of Copper in body tissues can produce adverse health effects and Wilson’s disease as depicted in Table 5. Turkish standards have taken initiatives to set up permissible limit for Copper (Cu) in candies at 10 mg/g. Also, the Spain legislation has set up the permissible limit for Copper (Cu) at 5 mg/g in chocolate and cocoa-sugar (Carbonell-Barrachina et al., 2002). As per Anonymous, it is 15 mg/g and 50 mg/g in chocolate and cocoa-sugar respectively (TurkishFoodCodex, 2002). Recommended dietary allowance of Copper, Cu for 7 to 10 years old children are 1.0 to 2.0 mg/day and 0.5 to 1.0 mg/day for infants as per National Research Council, 1989 (Gassmann, 1989). Earlier studies have reported Copper content in the range of 0.219–2.455 µg/g and 1.07 – 2.74 µg/g in various candy samples (Dahiya et al., 2005; Duran et al., 2008).
In contrast to Chromium, Copper (Cu) was found at relatively least levels ranging from0.095 to 0.550 µg/g in Cocoa-chocolate based candies, 0.148 to 0.618 µg/g in Milk based candies and from 0.069 to 0.580 µg/g in Fruit flavored candies as shown in Table 6, and according to the permissible limits and the daily dietary intake limits established by the international standards for Copper, these candies could be considered as safe for consumption providing that the other metals should not be present at harmful level.
Manganese (Mn), is also an essential trace metal which works as a co-factor in vital metabolic processes and fatty acid synthesis,also required for bone and tissue formation (Mohadesi et al., 2012). In excessive amount, Mn is recognised as a neurotoxic metal as it can cause impaired motor skills, neuro-degenerative diseases (Manganism, Alzheimer's disease, Parkinson's disease), cognitive and childhood developmental disorders as given in Table 5 (Proudfoot, 2017). In this study, Manganese was measured at low levels ranging from 0.046 to 0.410 µg/g (Cocoa-chocolate based candy), 0.138 to 0.875 µg/g (Milk based candy) and 0.049 to 1.489 µg/g (Fruit flavored candy) as given in Table 6. Unfortunately, neither any Food Safety Authority nor any International Health Agency has defined the permissible limits for Mn in food products and thus, the detected levels of Mn in candy samples could not be compared with standard values in order to establish the quality of candies.
Iron (Fe) is the most essential metal, present in greater quantity in the human body as compared to other trace metals. Iron plays an important role as a catalyst for proper metabolism in the human body and its level in the body must be controlled by regulating uptake as only a small amount of iron loss occurs daily through mucosal and skin epithelial cell sloughing as depicted in Table 5 (Arvan et al., 1999). A previous study has reported accumulation of iron in the hippocampus region of the brain of those suffering from Alzheimer's disease and Parkinson disease (Brar et al., 2009). Excessive iron consumption can typically damage the cells of heart and liver which can cause major adverse health effects such as metabolic acidosis, shock, liver failure, coagulopathy, adult respiratory distress syndrome, long-term organ damage, DNA damage, coma and even death (Cheney et al., 1995). As per U.S.NRC, 1991,, the recommended dietary allowances of iron for male and female children of about 10-16 years are 10 mg/day and 15 mg/day correspondingly. Three grams of iron can be toxic for a child of age about 2 years (Gassmann, 1989). The maximum level of iron at 2.0 mg/kg in cocoa fat and a range between 0.2 and 25 mg/kg in some foods products have been stipulated in previous reports (TurkishFoodCodex, 2002). Preceding literatures have reported iron content in the range of 3.963–9.863 µg/g in different type of candy samples (Duran et al., 2008). According to present study, the cocoa-chocolate, milk-based and fruit flavored candies were found to be contaminated with significantly higher levels of iron up to10.890 µg/g, 8.691 µg/g and 5.168 µg/g as seen in Table 6respectively and consuming such candies cannot be considered as safe because along with routine dietary intake, they could possibly lead to chronic toxicity.
Further, Zinc (Zn) is also an essential trace metal that works as a catalytic agent in various enzymatic reactions, proper functioning of the brain and central nervous system (Bitanihirwe et al., 2009). Zinc is also critically required for synaptic plasticity and hence, in learning (Nakashima et al., 2009). Recommended dietary intake of zinc for pregnant women and preadolescent children was set at 15 mg/day and 10 mg/day respectively. Even though Zn is essential for good health, but, surplus zinc can cause neurotoxicity, depressed growth, reproductive problems, impaired appetite, renal diseases and malabsorption of other essential metals as given in Table 5 (NRC, 1975). The present study has detected Zn in candy samples at the levels of 0.277-2.263 µg/g (Cocoa-chocolate based candy), 0.188-1.565 µg/g (Milk based candy) and 0.033-0.401 µg/g (Fruit flavored candy) as given in Table 6, where the levels of Zn in fruit flavored candies was relatively negligible to believe them as safe to consume while, higher consumption of cocoa and milk-based candies can affect the absorption of Cu and Fe in the body.
In trace amounts, Cobalt (Co) serves as key metal of vitamin B12 which is necessary for the metabolism in each cell of human body along with synthesis of fatty acids, energy production and normal functioning of nervous system. However, a high amount of cobalt in the body is considered as a major cause of contact dermatitis as given in Table 5. Providentially, in the present study, Cobalt was detected at comparatively insignificant levels in all kinds of candies i.e., 0.019-0.119 µg/g (Cocoa-chocolate based candy), 0.008-0.158 µg/g (Milk based candy) and 0.021-0.360 µg/g (Fruit flavored candy) as shown in Table 6. Unfortunately, like Manganese (Mn) and Zinc (Zn), the permissible limits for Cobalt (Co) was not determined by any public safety authorities for regulating its presence in food products, chocolates or candies and neither other research studies have reported the analysis of Co, Mn and Zn in candy samples.
Despite the paramount importance, the International Food Regulatory Agencies and Public Health Safety Organizations have not yet defined strict quality assurance guidelines for candy manufacturing and specific permissible limits for metals in frequently consumed chocolates and candies. Only Turkish Standards have done a commendable job by determining the permissible limits for few metals specifically in chewing gum and candies (Turkish-Standards, 1993; Turkish-Standards, 1996). Overall, the finding of this study particularly reflects the alarming need of focusing towards defining strict quality policies, rules and regulations for manufacturing and minimizing metal contamination in different variety of chocolates and candies.
Significance of the Study
The presence of toxic metals and the excessive amounts of trace metals in different type of candies have become the reason for worldwide concern. Chocolates and candies are usually consumed by the people of all age group, while their consumption by the most sensitive group of population i.e., children and pregnant women, makes this matter even more serious in order to protect their health. Frequent consumption of metal contaminated candies could cause chronic toxicity and severe health problems. Keeping this concern in mind, the present study has focused on examining the presence of extremely toxic metals i.e., Cadmium (Cd), Lead (Pb) and essential trace metals i.e., Cobalt (Co), Copper (Cu), Chromium (Cr), Iron (Fe), Manganese (Mn), Nickel (Ni), and Zinc (Zn) in different varieties of candies which can be easily available in the local markets of India. This study provides the pioneer data for inter-comparative multi-elemental distribution and contamination profiling in three varieties of candy samples viz. cocoa-chocolate based, milk based and fruit flavored candies. Till now, the specific permissible limits for all metals in the frequently consumed candies have not been set by any international food regulatory agencies. The findings of this study specifically reflects the importance of quality standards in preparations, storage, packaging and transportation of candies. While no standard permitted limits were established for metals in candies, there is an ongoing discussion at Codex for establishing limits for both Cadmium and Lead in different type of candies. It may be worthwhile to highlight this study, being an occurrence data, the findings of this study could be helpful in the process of setting up quality guidelines, standard policies, and permissible limits by the International Food Safety and Public Health Protection Agencies.
Conclusion
The present study has reported the contamination levels of nine metals in three different varieties of candy samples (67 Nos.). Also, a Multiple Discriminant Analysis (MDA) was conducted to classify the contamination pattern of 09 metals among 03 groups of candy samples i.e. cocoa chocolate based, milk based and fruit flavored candies which have suggested significantly non-uniform multi-elemental composition among candy samples of similar variety i.e. milk-based candies. The outcomes of MDA have shown the least uniformity in the contamination pattern of several candy samples which indicates the non-standard practices of manufacturing, processing, storage, packaging and transporting of candies and their raw materials. Moreover, the level of metal contamination in candies suggests that the frequent consumption of candies can silently lead to serious health conditions especially in children and pregnant women. Various metals such as Pb, Cr, Ni and mainly Fe, were detected at higher concentration in all type of candies which proves that frequent candy consumption cannot be considered as safe for health. Overall, the findings of this study reflect the necessity for (i) defining specific permissible limits for commonly found metals in chocolates/candies and (ii) setting up strict quality assurance policies and standard guidelines for candy manufacturing, processing, storage and transporting. Moreover, it is also imperative to conduct such studies to evaluate metal contamination in various food products in order to aid international food safety authorities in defining relevant guidelines and regulations.
Author contributions
The authors have contributed in the present study in diverse ways as designing of work, sample collection, sample analysis, data interpretation, article framework and the proper description of sample data and findings. RKK - Research concept and design; RKK, MSS, SJ, KP - Collection and/or assembly of data; RKK, KP - Data analysis and interpretation; RKK, MSS, SJ - Writing the article; RKK - Critical revision of the article; RKK, VM, DKP - Final approval of the article.