

Introduction
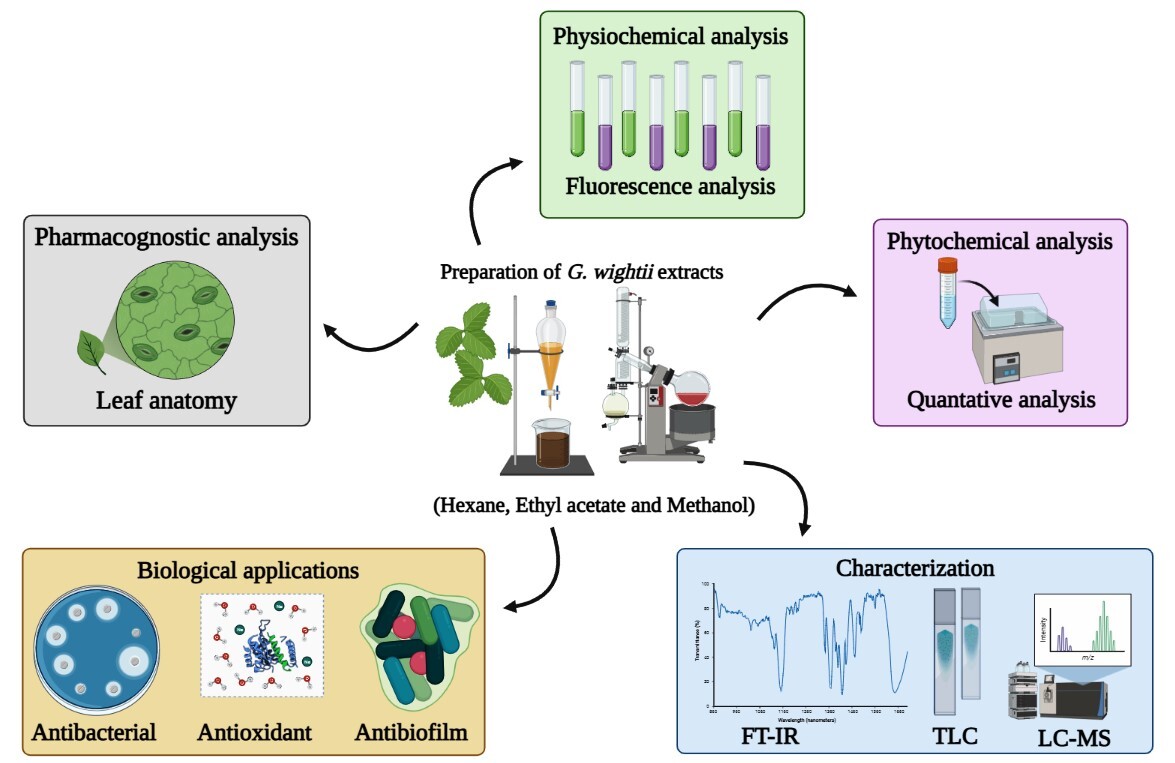
India has a wide range of traditional medicines based on natural sources of plants to cure numerous diseases and disorders (Santhosh et al., 2022). Herbal medicines play a significant role in health-care initiatives, particularly in developed nations (Sreedhar, Prakashkumar, Girija, & Remashree, 2013). Plant-based medicines require extensive documentation and standardization of raw materials in order for this medical system of treatment to gain widespread adoption (Sreedhar, Prakashkumar, Shree, & B, 2012). However, pharmacognostic and physicochemical assessment is needed to detect adulteration and the genuineness of the raw material utilized in the preparation (Pandiyan & Ilango, 2022). The World Health Organization (WHO) supports quality indices of herbal remedies as these drugs are widely available, safe and low cost for people. Plant extraction contains a variety of biochemical compounds that are responsible for different bioactive principles (Selvakumar & Rajasekar, 2017). Phytochemicals help to increase immune responses and give immunity against a variety of diseases (Ahmad et al., 2022). However, flavonoids, phenols, alkaloids, and terpenoids are the most important plant components that act as the biological aspects (Chinnaraj et al., 2023). Oxidative stress or free radicals are highly risky factors caused by aerobic metabolism, cell death and tissue dysfunction. Human body to be endogenous antioxidant ability to compensation of free radicals but it does not always do so (Wahyuni et al., 2021). The plants produce exogenous chemical molecules such as phenolic (polyphenols), proteins and vitamins are blocking the forming of free radicals and production of oxidative stress (Moualek, Aiche, Guechaoui, Lahcene, & Houali, 2016). Plants are natural sources of biologically and non-nutritive molecules and they have a variety of positive traits or disease-defeating properties (Channa et al., 2020). Secondary metabolites are the chemically several classes react as the inhibitory control of all types of microorganisms. Antibiotics compounds either prevent bacteria from multiplying or kill them immediately upon the formation of bactericidal agents (Palani et al., 2022). Bacterial biofilm generates physical and chemical barriers, and so on; antimicrobials are unable to pass through the bacterial cell. Plant based antimicrobials have a wide range of therapeutic characteristics (Gupta, Chhibber, & Harjai, 2016). Goniothalamus is one of the most diverse paleotropical plant genera in the Annonaceae family, with over 130 species found in India. In this genus are attracted and considering as a potential source of drugs that contain specialized metabolites such as acetogenins and styrylactones/pyrones that have effective cytotoxic properties (Palani et al., 2022). Among those, Goniothalamus wightii Hook. f. and Thom’s is small tree, traditionally the leaves and barks are used in the paste and oral form of rheumatism diseases (Palani et al., 2020). The G. wightii leaves and stem isolated the volatile oils compounds (Thang, Dai, & Ogunwande, 2016), 8-epi-9-deoxy goniopyrone was isolated the leaves extract (Sreelekshmi et al., 2015) and five compounds such as aliphatic alcohol, 6-dodecyl pyran-2-one, goniothalamin, 9-deoxygoniopypyrone, 9,8-deoxy-4-hydroxy pypyrone (Jayakumar et al., 2010) , goniothalamin and styryl pyrone isolated in these species determine the nutritional physiology of armyworm (Senthilnathan, Choi, Paik, & Kalaivani, 2008). G. wightii extract by using petroleum ether showed that the inhibitory effect of inflammation assays (Maridass & Raju, 2018). However, there has been no report is available till date on the pharmacognostic evaluation of G. wightii leaves in the world, which can significantly impact on the plant's quality, purity, identity, and therapeutic potential. Hence, the present study, an attempt to provide the organoleptic characters, macro and microscopical standards, fluorescence analysis, proximate analysis and physicochemical parameters of G. wightii leaves and the characterization of the leaves extracts (hexane, ethyl acetate, methanol) by Thin layer chromatography (TLC), Liquid Chromatography-Mass Spectrum (LC-MS), Fourier-transform infrared spectroscopy (FT-IR) and the biological assays such as antioxidant, antibacterial and antibiofilm activities.
Materials and Methods
Sample collection and preparation of extracts
The medicinal plant of G. wightii leaves were collected from Kalakad Mundanthurai Tiger Reserve Forest, Tirunelvelli, Tamil Nadu, India. The plants were identified and authenticated from Department of Botany, Periyar University, India [PU/BOT/HVO.167]. Leaves of G. wightii were washed, separated, and dried in the room. Dried up leaf material was blended into a fine powder for further studies. About 50 gm leaf powder sample extracted with three organic solvents such as hexane, ethyl acetate and methanol by using Soxhlet apparatus. Finally, the extracts were concentrated using a rotary evaporator (BUCHI rotavapor R-215, 75 rpm, 55˚C) to obtain the crude form, which was stored at 4˚C until further use (Odeyemi, Afolayan, & Bradley, 2017).
Pharmacognostic standardization
An organoleptic character was observed by G. wightii powder tested by color, odor, taste and texture parameters. The macroscopic of the plant material was investigated using the (Brain & Turner, 1975) method. The microscopic studies of G. wightii fresh leaves were transverse section and stained. The leaves were washed in 100% isopropyl alcohol and standard in Ehrlihʼs hematoxylin for 8 min in a horizontal staining jar. The hematoxylin stain sections were rinsed in tap water and dipped in acetic alcohol to remove excess stain (8.3% HCL in 70, 80, 90% alcohol). After, the section was placed in tap water for 10 min for bluing (show alkalization) and stained at 1% aqueous eosin (1 g in 100 mL H20) for 1 min and again washed with water to allow drying. The complete dehydration of stain sections was incubation at 600˚C (Khandelwal, 2007).
Physico-chemical analysis
Physico-chemical analysis values were determined by ash and extractive values, including foreign matter, moisture and tannin content, swelling and foaming index, loss on drying parameters followed by standard protocols (Laloo, Hemalatha, & Prasad, 2020) and WHO preferred on quality and purity on the medicinal plant material. The values were triplicate to mention the Mean ± SE.
Fluorescence analysis
The G. wightii leaf powder (2 g) was taken and added 3 to 5 drops of various organic chemical; 5% HCL, methanol, chloroform, acetone, ethyl acetate, 5% H2SO4, FeCl3, sodium hydroxide, aqueous, petroleum ether, acetic acid, hexane, benzene, 5% nitric acid in each test tubes were separately and mixed well. After treating the powder to observe the light of day, a few drops on the slide become visible under UV 254 nm and UV 366 nm (Sreeletha, Lini, Dhanyalekshmi, Sabu, & Chandran, 2017).
Proximate analysis
All the proximate content (proteins, fiber, lipid and energy value) was determined according to the method of Association of Official Analytical Chemists (AOAC, 1990; AOAC, 2006). The sample was dried in an oven at 105°C for 1 h until a constant weight was attained. The analysis was performed in triplicates and the results were expressed.
Qualitative phytochemical analysis
The phytochemical screening of G. wightii different extracts (hexane, ethyl acetate, and methanol) was followed by standard methods (Chandran, 2017). The TLC was carried out on G. wightii extracts to separation of bioactive compounds. The samples placed on the 1 cm TLC plates were developed in the chromatogram tank using the different solvent systems (hexane: chloroform, ethyl acetate, methanol) and allowed to dry at room temperature. After that, the developed dried plates were visualized in day light and ultraviolet light at 254 and 366 nm (Semwal, Kumar, Teotia, & Singh, 2013).
Fourier transforms infrared spectroscopy (FT-IR) analysis
Three different extracts from G. wightii carried out by functional groups atoms from FT-IR spectroscopy. About 8 mg sample powder was loaded in FT-IR spectrum with data collected range of 400-4000 cm-1 and the resolution of 4 cm-1. The samples were encapsulated in KBr pellets. The active biomolecules are responsible for IR spectrum (Haddad et al., 2017).
Characterization of Liquid chromatography-Mass Spectrum (LC-MS)
The LC-MS to detect the bioactive components in the G. wightii leaves extracts (hexane, ethyl acetate and methanol). The sample infusion flow rate was 10 µL/min. The system contains pumps and injector; separation of column type (ACQUITY UPLCr BEH C18, 1.7 µm, average temperature of 40.0, total injector count of 336). Mobile phases are water + 0.1% formic acid, methanol, acetonitrile in water at flow rate of mL/min. The LC conditions were initially 0-3min during 6%, and then increase from 10-40 min →50%, 40-55 min→ 70%, finally reached at 55-63 min→ 70-90% followed by (Vignesh, Selvakumar, & Vasanth, 2022). The XEVO-G2XSQ TOF spectrum was positive and negative ionization mode for the analysis using data dependent automatic switching between MS and MS/MS acquisition modes.
Antioxidant activity assays
2,2-Diphenyl-1-picryl-hydrazyl assay (DPPH)
The DPPH free radical assay scavenged by G. wightii extracts in this method described by (Santhosh et al., 2022) slight modifications. A total 1.98 mg of DPPH dissolved in 25 mL of ethanol and standard also prepared at the same. The plant extracts concentrations were taken 20-100 µg/mL and added 400 µL DPPH solution in each and maintain 30 min placed the tubes in dark room temperature. After the color change is absorbed at 517 nm, the spectrophotometer.
2ʹ-2ʹ azino bis-(3-ethylbenzothiazoline-6-sulphonic acid (ABTS)
The ABTS radical scavenging activity methods were performed by (Sagbo, Afolayan, & Bradley, 2017). About 7 mM of ABTS was mixed with 2.45 mM ammonium per sulphate or potassium per sulphate and this mixture was placed at dark room temperature for 12-16 h before use. ABTS+ solution was diluted to an absorbance of 0.7±0.05 with ethanol at 734 nm. The sample and standard conc. 20-100 µg/mL and mixed 1 mL ABTS solution for each tube placed 30 mins the dark condition. Thereafter, the reaction color change was absorbed at spectrometrically in 734 nm.
The DPPH and ABTS scavenging inhibition was calculated using the formula,
Scavenging ability = Ac-At/Ac×100,
whereas, Ac- absorbance control, At- absorbance test sample.
Ferric reducing power (FRAP) assay
The reducing power assay was to determine the reducing iron abilities of different extracts of G. wightii described by (Nibir, Sumit, Akhand, & Ahsan, 2017). The FRAP solution was prepared by 227 mm acetate buffer pH 3.6 in 20 mL (3.1 g sodium acetate and 16 mL glacial acetic acid dissolve to 1 lit Dis. H20), 10 mm TPTZ (2,4,6- Tripyridyl-s-thiazine) solution in 20 mL, 1.5 mm ferric chloride in 20 mL and centrifuged at 3000 r/ for 10 min. The sample and standard concentrations were 20-100 µg/mL added FRAP solution and deionized water after the blue color formed reducing reaction was absorbed at 700 nm. The assay was triplicate and values are expressed as Mean±SE.
Antibacterial activity assay
The antibacterial activity of hexane, ethyl acetate and methanol extracts was measured by the well diffusion method against the bacterial pathogens (Escherichia coli - MTCC 443 and Enterococcus faecalis - MTCC 439), following the method of (Chinnaraj et al., 2023) with slightly modifications. In briefly, inoculum containing the bacterial culture plate to spread the strains with using of sterile cotton swab and handle the well cutter to cut the 6 mm in the plate. After, the extracts 10-60 mg/mL impregnated and antibiotic (Streptomycin) discs were used. The plates were placed inoculum for 37˚C for 24 h. Thereafter, the zones of inhibition are developed and measured it.
Antibiofilm assay
About 3.5 mL of nutrient broth and 1.5 mL of bacteria culture were added into sterile test tubes. Different concentrations of G. wightii extract (10, 20, 40 µg/mL) additionally added into each tube. The test tubes were in a shaking incubator at 37˚C for 24 h. After incubation, gently remove the mixture and all test tubes were washed with distilled water. All the tubes were breeze dried for few minutes and add 5 mL of crystal violet then incubated 37˚C for 1 h. After, incubation discarded the crystal violet form all the tubes and washed with distilled water. About, 5 mL of 95.0% ethanol was added into all test tubes and take OD at 595 nm by UV- spectrophotometer (Bazargani & Rohloff, 2016). A formula for the calculation of anti-biofilm activity percentage,
Biofilm inhibition (%) ꞊ Control - Sample/Control × 100
Statistical analysis
The plant extract data were analyzed in triplicate and results were expressed by Mean ± SE compared with ANNOVA variance and graphical presentation through the use of Origin Pro 8.0.
Results
The G. wightii is a dicot plant, small tree. The macroscopically studies by leaves are simple, green color, oblong-ovate (13×2 cm) long, glabrous branchlets, looped margin, pedicles (6-11cm), acuminate apex and absence of prominent. The leaf shows dorsiventral exhibits form the mid and lamina portion. It contains adaxial and abaxial surface, lateral vein. At the midrib shows small thin walled cells, 340 µm and vascular bundles sheath (Figure 1A). The midrib vascular bundle enlarged contains metaxylem it facing to outwards and protoxylem it facing to inwards. The xylem called endarch, conjoint, collateral, closed endodermis vascular bundle and absence of cambium (Figure 1B). Transverse section of lamina portion is 300 µm and small unicellular hair, cuticle. The palisade parenchymatous is narrow, compactly arranged cells at 2-3 layers. Spongy parenchymatous are loosely arranged contains chlorophyll or chloroplast, open type of stomata (Figure 1C). Venation patterns are thick and polygonal or rectangular shape (Figure 1D). The organoleptic parameters evaluated the G. wightii leaf powder, revealed the following characteristics is dark green in color, with pleasant aromatic odor and powder taste gives a bitter followed by soft texture.
Table 1
Physico-chemical analysis of Goniothalamus wightii leaf powder
Figure 1
T.S. of leaf through midrib (La- Lamina,AdS- Adaxial surface, Lv- Lateral vein, VS- Vascular strands, AbS- Abaxial surface), B) T.S. midrib vascular strand enlarged (Mx- Metaxylem, Px- Protoylem, Ph- Phloem), C) T.S. of lamina (AdE- Adaxial epidermis, PM- Palisade mesophyll, SM- Spongy mesophyll), D) Vein termination pattern

The physiochemical analysis of G. wightii leaves powder was performed, and various parameters were evaluated. Ash values are followed by total ash 4.9%, water soluble ash 1.05%, acid insoluble 0.74% higher than sulphated ash 0.42%. The presence of moisture content 11.05%, loss on drying 7.0%, tannin content 2.13% followed by foreign matter was 0.49% and the powder did not reveal the swelling and foaming index. Extractive values are primarily useful for the determination of an exhausted or adulterated drug. The values are recorded in alcohol at 2.72%, water soluble at 5.85%, ethanol at 0.89%, chloroform at 0.86%, ethyl acetate 0.75%, methanol 0.72%, benzene 0.26% and hexane 0.65% w/w, respectively, and PH values are 5.6. Table 1 summarized that the physicochemical analysis of leaf powder.
Table 2
Fluorescence analysis of Goniothalamus wightii leaf powder
Table 3
Proximate chemical composition of Goniothalamus wightii leaf powder
Table 4
Quantitative phytochemical constituents of different extracts of Goniothalamus wightii

The characteristics of fluorescent properties or colors emitted by G. wightii leaf powder before and after treating with various reagents such as methanol, HCL, FeCl3, sodium hydroxide, Dis. H2O, petroleum ether, acetic acid, hexane, benzene and nitric acids were recorded. It fluorescence expose green, yellow, brown and orange color of leaf powder examined under visible light, short UV and long UV are given in Table 2. The proximate chemical composition of G. wightii leaf powder exhibited carbohydrate of 50.24%, protein was found to be 23.12%, lipid was 12.12%, fibers was 10.25%, followed by soluble and insoluble fibers of 7.24% and 3.01%. The calorific value of the leaf powder was estimated at 385.69 Kcal/100 g (Figure 2 Table 3 ). The percentage of yield by extract in hot Soxhlet extraction method by the methanol yield is more with 26.0% followed by hexane 17.3%, ethyl acetate has lowest yield with 8.3%. The preliminary phytochemical analysis of three solvents extracts i.e., hexane extraction showed the presence of alkaloids, flavonoids, terpenoids, steroids, carbohydrates, phenols and tannins other than ethyl acetate extraction presence of alkaloids and carbohydrates followed by methanol extraction was terpenoids and steroids (Table 4 ). The TLC was carried out the three different (hexane, ethyl acetate, methanol) solvent crude extracts enumerate the system of non-polar to polar reagents from different ratio i.e., carried out the hexane: ethyl acetate (9:1), hexane: ethyl acetate (8:2), hexane: ethyl acetate(7:3), hexane: ethyl acetate (6:4), hexane: ethyl acetate (5:5), chloroform: methanol (9.5:0.5), chloroform: methanol (9:1), ethyl acetate: methanol (9:1), chloroform: methanol: ethyl acetate (7:2:1) under observed UV- 255 nm light condition after photograph taken. The solvent based moved the components were used to the further identification and isolation of pure compounds (Figure 3).


Table 5
LC-MS analysis of hexane, ethyl acetate & methanol extracts of Goniothalamus wightii leaves
Both positive & negative mode mentioned, * both ethylacetate and methanol presence of compounds
The phytocomponents analysis of the hexane, ethyl acetate and methanol extracts by LC-ESI-TOF/MS system. The positive and negative mode of the chromatogram measured at the retention time and mass spectrum to determine the molecular weight of the detect compounds to predict by using with previous reports and mass spectra database (Figure 6; Figure 5; Figure 4 ; Table 5 ). The LC-MS indicated the chromatogram of retention time and molecular mass of the above three extracts. MS electrospray ionization of positive [M+H]+ and negative mode [M-H]- the extracts were eluted the flavonoids derivatives of five phytocompounds are flavanols, anthocyanins, flavanones, isoflavonoids. The flavanols constituents’ originals in positive mode are based on intensity time of 3.83 min separate 183.06 m/z, 451.13 m/z mass by components are quercetin. 3.86 min identified the molecular mass 555.27 m/z by quercetin 3-O-(6ʹʹ malonyl glucoside). The MS/MS spectrum isolated the 5.8 →3.24 min by presence of compounds are 473.06 m/z → 777.18 m/z compounds were quercetin-3-rhamnoside, quercetin-3-O-arabinoside. The negative mode(-) are 4.06 min and 293.19 min indicated by 289.06 m/z, 293.19m/z are catechin (isomer). Anthocyanin’s identified the compounds by positive mode based on the 3.58→3.61 min retention time to mass separated the 433.12 m/z by isopeonidin-3-O-arabinoside. 3.45→5.06 min identified by 496.29→898.50 m/z are malvidin-3-O-glucoside. Flavanones in positive mode derivation 2.23 min are elicited by tentatively identified by 328.12 m/z are naringenin. 6.63→7.17min characterized by molecular mass of 593.22 m/z, 609.22 m/z eriocitrin, apigenin 6,8 di-c-glucosidase, neodiosmin. ESI [M-S]- mode isolated by 2.03 min indicated by 577.11m/z are rhoifolin. Isoflavonoids are the negative mode [M-S]- intensity 3.83min eluted by 305.15m/z compounds is 3ʹO-methylequol. Then followed by phenolic group derivatives are hydroxyphenylpropanoic acids, hydroxyphenylpentanoic acids, hydroxybenzoic acids, hydroxycinnamic acids. The phenolic derivatives of positive mode hydroxyphenylpropanoic acids intensity of 3.85 min identified by 183.06 m/z mass of bio components 3-hydroxy-3(3-hydroxyphenyl) propionic acid. Hydroxyphenylpentanoic acids the MS ionization electrospray of retention time 8.11min eluted by 535.22m/z are 5,4-dihydroy-3,3ʼdimethoxy-6:7-methylenedioxyflavone 4ʹ-O-glucuronide. Hydroxybenzoic acids the positive mode ions retention time 2.60 mi tentatively identified by 249.07 m/z- vanillic acid 4-suphate. The mass ions of 2.43 and 4.09 min components by 171.06 m/z, 183.06 m/z are gallic acid and ethyl vanillin. Hydroxycinnamic acids of positive mode time intensity of 1.18→4.60 min characterized by 309.18 m/z, 342.13 m/z, 353.23 m/z, 381.04 m/z are cinnamoyl glucose, caffeoyl glucose, chlorogenic acid, caffeoyl dihexoside. 3.24→3.92 min identified 451.13 m/z, 721.34 m/z are isoferulic acid 3-sulphate and 1-sinapoyl-2-feruloylgentiobiose. The other polyphenolic contents are characterized by 3.85 min in mass of 183.06 m/z methylcoumarin. Lipids, steroids and lignans are followed by 2.06 min intensity of 328.12 m/z exhibits cholesterol content. The steroids derivatives sterols are retention time of 2.46 min isolated the 797.40 m/z in stigmastanol. The LC-MS lignin content characterized the time intensity 1.69 isolate the 368.13 m/z arctigenin (Figure 6; Figure 5; Figure 4 Table 5 ).
The FT-IR analysis of G. wightii hexane extracts show peaks at 3425 cm-1 O-H stretch H-bonded, alcohols and phenols, 2920 cm-1 C-H stretch alkanes, 2851 cm-1 CH3, CH2 and CH 2 or CH3 bands alkanes, 1712 cm-1 C=O stretch α,β unsaturated aldehydes, ketones, 1633 cm-1 N-H bend 1 amines, 1380 cm-1 C-H bend alkanes 1243 cm-1 C-N stretch aliphatic amines, 1021 cm-1 C-N stretch, aliphatic amines, 817 cm-1 C-CI stretch alkyl halides, 749 cm-1 –C=C-H:C-H bend alkynes, 619 cm-1 C-Br stretch alkyl halides. Ethyl acetate shows the peaks at 3403 cm-1 N-H stretch 1,2 amines, amides, 2920 cm-1 C-H stretch alkanes, 2850 cm-1 C-H stretch alkanes, 1719 cm-1 C=O stretch α,β unsaturated aldehydes, ketones, 1623 cm-1 N-H bend 1 amines, 1515 cm-1 N-O asymmetric stretch nitro compounds, 1415 cm-1 C-C stretch aromatics, 1256 cm-1 C-N stretch aromatic amines, 1155 cm-1 C-H wag(-CH2X), 1058 cm-1 C-N stretch aliphatic amines, 970 cm-1 C-H stretch alkenes, 816 cm-1 C-H aromatics, 697 cm-1 C-CI stretch alkyl halides, 618 cm-1 –C=C-H: C-H bend alkynes. Methanol extracts shows the peaks at 3385 cm-1 N-H stretch 1,2 amines, amides, 2024 cm-1 C-H stretch alkanes, 2098 cm-1 –C=C-stretch alkanes, 1611 C=O stretch, α,β unsaturated aldehydes, ketones, 1518 cm-1 N-H bend 1 amines, 1416 cm-1 n-O asymmetric stretch nitro compounds, 1283 cm-1 C-N stretch aromatic amines, 1063 cm-1 C-N stretch aliphatic amines, 820 cm-1 C-CI stretch alkyl halides, 728 cm-1 C-H rock alkanes, 633 cm-1 C-Br stretch alkyl halides (Figure 7 ; Table 6 ).
Table 6
FT-IR spectrum of Goniothalamus wightii hexane, ethyl acetate and methanol extracts
Figure 10
FT-IR analysis of Goniothalamus wightii hexane (a), ethyl acetate (b), methanol extract (c)

The G. wightii extracts were evaluated by various in vitro antioxidant assays. The DPPH radical scavenging of hexane extracts IC50 values range from 50.08 µg/mL with standard values were 49.81 µg/mL, followed by ethyl acetate extracts IC50 values range from 51.19 µg/mL with standard values 49.77 µg/mL and methanol extracts IC50 values range from 52.36 µg/mL with standard values 49.82 µg/mL. The hexane and ethyl acetate extracts were similarly against the DPPH free radicals. ABTS free radical scavenging of hexane extracts IC50 values range from 50.17 µg/mL compare standard values 49.98 µg/mL, ethyl acetate extracts IC50 values were 53.90 µg/mL with standard values 45.14 µg/mL and methanol extracts IC50 values range from 55.67 µg/mL compare standard values 47.34 µg/ml. FRAP reducing power assay of hexane extracts IC50 values are 67.60 µg/mL standard values from 52.30 µg/mL followed by ethyl acetate extracts IC50 values are 84.09 µg/mL standard values 64.03 µg/mL and methanol extracts were IC50 values 89.07 µg/mL with standard values 68.80 µg/ml respectively. The sample concentrations were taken the 20-100 ug/mL in all antioxidant assays (Figure 10; Figure 9; Figure 8 ). Above these results hexane extracts are more potent inhibit the free radical scavengers compare the other solvent extracts.
Figure 11
In vitro antioxidant activities of Goniothalamus wightii hexane extract A- DPPH, B- ABTS, C- FRAP

Figure 12
In vitro antioxidant activities of Goniothalamus wightii ethyl acetate extract A- DPPH, B- ABTS, C- FRAP

Figure 13
In vitro antioxidant activities of Goniothalamus wightii methanol extract DPPH, B- ABTS, C- FRAP

Figure 14
Antibacterial activity of hexane (a, b), ethyl acetate (c, d) and methanol (e, f) extracts of Goniothalamus wightii

Table 7
In vitroAntibacterial activities of Goniothalamus wightii extracts
Table 8
Effect of antibiofilm activities of Goniothalamus wightii extracts against pathogens
In vitro antibacterial activities of G. wightii extracts against the E. faecalis gram (+) and E. coli gram (-) organisms with comparison of standard antibiotic (streptomycin). Hexane extract concentrations 10-60 mg/mL to against the E. faecalis pathogen maximum zone of inhibition 10.1 mm with antibiotic maximum zone at 8 mm and E. coli pathogen minimum zone of inhibition 2 mm with antibiotic (streptomycin) 1 mm (Figure 11a, b). Ethyl acetate extracts conc.10-60 mg/mL to against the E. faecalis pathogen maximum zone 9.1 mm with antibiotic inhibition zone at 6mm and E. coli minimum zone 1 mm and no zone formation at antibiotic (Figure 11c, d). Methanol extracts were conc. 10-60 mg/mL to against E. faecalis maximum zone of inhibition 5 mm along with antibiotic zone 8 mm and E. coli minimum zone of inhibition 1 mm with antibiotic did not formed the inhibition zone (Figure 11e,f; Table 7 ). The sample concentrations were 10-40 µg/mL hexane extract strong potential against growth the E. faecalis and E. coli up to 53.6-86.9% when compare the ethyl acetate was against the development of bacterial species 43.4 to 60.6% and methanol extract prevent the biofilm formation of E. coli and low inhibition of E. faecalis. In our results findings that the 20-40 µg/mL hexane extracts were strongly prevented at the E. faecalis at the 86.9%. At the 40 µg/mL the hexane and ethyl acetate were negatively inhibited against the E. faecalis. However, the hexane extracts of G. wightii were more potentially activated by inhibition of growth of bacterial colonizes (Table 8 ).
Discussion
The G. wightii leaves and stem bark paste are used by local tribal treatments for pain relief (Palani et al., 2020). The peoples are not gain the proper identification and standardization of the plant. The WHO indeed supports the quality assurance and proper identification of the medicine. The standardization of drugs based on the analysis of microscopically characters, proximate and physicochemical parameters (Pandey & Tripathi, 2014). There is no chemist and standardization of the G. wightii leaf powder. However, the present study identification and authentication was analyzed by the G. wightii leaf powder observed the dark green in color and bitter taste. Similarly, Myrica esculenta leaves were green color, bitter and astringent taste (Kabra, Sharma, Singla, Kabra, & Baghel, 2019). The microscopic approach is one of the most simple and cost-effective begin determining the correct identification of the source materials (Kumar et al., 2012). From the study of (Majid, Nissar, Raja, Nawchoo, & Bhat, 2021) reported that species of Aralia cachemirica has been evaluated macro and microscopic attributed are the leaves, stem and root parts; also reported that the presence of low foreign matter and highly moisture content and loss on drying (LOD). Similar with our present study, the Pterocarpus marsupium evaluated that the pharmacognosy, physicochemical analysis and LC-MS, GC-MS of hearty wood extracts (Ahmad et al., 2022). In this species, physicochemical analysis is vital function of quality and purity of drugs which involved moisture content was high when compared by LOD and foreign matter, pH was 5.6, swelling and foaming index as nil, ash and extractive values evaluated the from different solvents. The present study results similarly the absence of swelling and foaming index by M. esculanta leaf powder (Kabra et al., 2019). In this study, the ash values parameters of sulphated, total ash, soluble and insoluble ash were determined. The ash values are indicating the impurities of drug and then improve the quality and purity. Extractive values are the estimated in this species leaf powder exhibited different constituents from various reagents. Similarly, the ash and extractive values are performing the leaves of Clerodendrum infortunatum (Verma & Gupta, 2021) and stem of Vitex pinnata (Thenmozhi, Sangeetha, Jayanthi, & Suganthi, 2021). The characteristics of fluorescence properties or colors recorded through this study could be used as standard in the identification and authentication of G. wightii leaves were examined under day light, short and long UV which signifies their color observed for different chemicals are given in Table 2. Fluorescence analysis is one of the pharmacognostic parameters for the detection of chemical constituents in drugs by visible light. Some other compounds are not fluorescent, which require different reagents under UV light conditions to reflect the colored compounds. It resembles the active components useful for the preparation of medicine (Dash, Hashim, Hassan, & Muthukumarasamy, 2021). They are pharmacognostic characteristics that can be used to distinguish between closely related plant species or variants which have similar constituents or pharmacological properties. The plants are natural sources of phytochemicals are given the organoleptic and color of the plant (Tatiya, Surana, Bhavsar, Patil, & Patil, 2012). The TLC was carried out the G. wightii three solvent extracts were used to obtain different solvent from non-polar to polar ratios. The compounds were moved from based on the stationary phase to mobile phase and the Rf values are calculated. After few minutes, to observe the presence of different color bands under UV light condition showed in Figure 4. In this solvent system to useful for the separation of pure compound by plant extract phytochemicals, in general, are natural bioactive molecules present in plants that act in concert with nutrients and fiber to act as a disease defense mechanism (Sreeletha et al., 2017). Above and beyond the phytochemical results obtained from Elipta alba whole plant extracts (hexane, chloroform, ethyl acetate, methanol, and water) presence of alkaloids, flavonoids, carbohydrates, phenols, and tannins (Kumar, Kumar, & Singh, 2020). The FT-IR spectrum is useful tool for the identification of the bioactive components functional groups based on the range of peaks in the spectrum. Presently, the extracts FT-IR results shows peaks at assigned functional groups are C-N bonds, N-H bonds interactions, alkyl amines, alcohols, unsaturated aldehydes, and ketones regions in the IR spectrum scanning range from 400-4000 cm-1. The results, similarly, n-hexane and ethanol extracts IR analysis were Ziziphus oenoplia present at the functional groups based at the peak interrelations (Thenmozhi, Tahir, & Uthirapathy, 2021). The FT-IR analysis of methanolic extract of Curcuma caesia peaks at N-H, O-H, C-C functional groups (Dash et al., 2021). Jasminum azoricum hexane extracts FT-IR analysis to identify the characteristic bioactive components were carboxylic acids and esters, alkyls halides, amines and aromatic compounds. The FT-IR results used for the identify compounds structures for various chemotherapeutic applications (Hari & Nair, 2018). The LC-MS based techniques are likely to be a great importance in plants, due to highly rich biomolecules of plants, which includes various branches of polar compounds and it can be isolate and discovered by mass spectrum approaches (Sayed et al., 2020). The first report and detection compounds by three G. wightii extracts and exposed at good results of high resolution in TOFMS for ES+/ES- modes. The ESI-MS for liquid chromatography electrospray ionization are combination with MS/MS techniques. Both modes are expressed from the presence of bioactive compounds likewise phenolic, flavonoids derivatives. According to (Sayed et al., 2020) reported that Yucca species analyzed LC-MS techniques of based on intensity to identified 43 compounds (phenolic derivatives) these are used of the antimicrobial properties. Sambucus nigra qualitative analysis of the phenolic acids and flavonols are detection by LC-ESIMS from the various extracts. Flavonoids metabolism are distribution in the Zanthoxylum zanthoxyloides extracts it characterized by electrospray ionization techniques (Tine et al., 2017). From the study of (Zhong et al., 2020) explained that the seaweed contains phenolic group characterized by using LC-MS likewise present study results observed the similar bioactive compounds. Similarly, Saraca asoca leaf and callus extracts phytocomponents analysis of LC-MS to derive by the flavonoids (quercetin), alkaloids and fatty acids contents (Vignesh et al., 2022). Likewise, the methanolic extract of Marselia quadrifolia phytoconstituents are identified and developed by LC-MS reports (Vijayalakshmi, Kiruthika, Bharathi, & Ruckmani, 2015). The jelly palm fruit (Butia ordorata) and fishtail fruit (Caryota uren) are containing the polyphenolic contents characterized by LC-MS (Ma, Dunshea, & Suleria, 2019). Based on the present results on LC-MS studies to identify the bioactive components to use for the pharmacological effects i.e., antioxidant, antibacterial and antibiofilm activities. Alkaloids or nitrogen containing compounds and flavonoids are exhibited the potent antioxidant against the oxidative reaction (Kumar et al., 2020). In this antioxidant activities are analyzed the hexane, ethyl acetate and methanol extracts by in vitro assays (DPPH, ABTS, FRAP) when compared to standard Vitamin C. The presence of single-electron DPPH antioxidants are present, the DPPH converts into electron pairs, and absorption reduces. Absorption is related to the number of absorbed electrons, concentration, and the color of the solution. This radical is attributed to the presence of a single-walled electron with a significant absorption at 515 nm, which leads the methanolic solution to appear violet color (Anusmitha et al., 2022). The ABTS+ cation is one of the doses dependent manners. It is the electron transfer mechanism that dark blue ABTS solution as added the sample when react the antioxidant to reduce the colorless or decolorization of sample. Food samples contain biological components that scavenge or lessen the color-causing (ABTS, DPPH) radicals. The ABTS scavenging of Scabiosa maritima chloroform extract was showed that the high IC50 values when compare the acetate fractions (Jalloul, Chaar, Tounsi, & Abderrabba, 2022). The FRAP assay evaluates antioxidant’s ability to decrease the Fe3+ to Fe2- complex and generate a blue iron complex. The capability of a substance to reduce iron (III) to iron (II) is mostly determined by the presence of reducing agents, which have antioxidative properties by quenching free radical bonds and donating a hydrogen atom (Wetchakul, Chonsut, Punsawad, & Sanpinit, 2022). Slightly, the species results, G. velutinus stem and bark methanol extracts of scavenging against the DPPH, ABTS and FRAP radicals the maximum inhibitory was 96% respectively to exhibit the high potential activities (Iqbal, Salim, & Lim, 2015). The antioxidant activities of G. wightii were evaluated as assays comparing the different extracts (hexane, ethyl acetate and methanol). Hexane extracts highly potent antioxidants against free radicals compare the other extracts. The different solvent extracts of G. wightii were more resistant to gram-negative bacteria than positive bacteria. This could be due to the unique property of Gram-negative bacteria's cell walls morphology. Those of Gram-negative bacteria, on the other hand, consist of an outer layer of hydrophilic lipopolysaccharide very resistant to antibacterial agents' penetration as well as the presence of enzymes that break down antibacterial compounds in the periplasmic space (Djihane, Wafa, Elkhamssa, Maria, & Mihoub, 2017). In the present study the hexane extract containing phenolic and tannins components to show the ability of antibacterial activity to compare with other solvent extracts. Polyphenols have the ability to improve a variety of disciplines such as pharmacological actions i.e., antioxidant, antimicrobial and cytotoxic activities. The present study results likewise, six woody species leave plant extracts contains rich polyphenols and tannins against the clinical pathogens or microorganisms (Lorenzo et al., 2020). Microbe killing agents are naturally present in medicinal plants and are used in industrial and pharmaceutical applications today. The bacteria effect on both bactericidal drugs (kill target organisms) and bacteriostatic drugs (inhibit growth and replication of bacteria). Mode of action antibacterial drugs are inhibitors the bacterial cell wall synthesis, membrane function, protein synthesis and nucleic acid synthesis (Li, Zhang, & Xu, 2021). Similarly, (Ansari et al., 2019) reported that Aerva lanata various extracts (hexane, chloroform, ethyl acetate, methanol and ethanol) against different bacterial pathogens. Among the present studies, bacterial activities, the plant extracts against E. faecalis pathogens the maximum zone formation was compare with antibiotics. Bacterial biofilm is a global health problem. The present studies of antibiofilm activities of hexane extracts showed the highest inhibition against the pathogens compare the other extracts. Our results indicated the percentage of inhibition of colonizes formation was 50-85% respectively. Antibacterial drugs capacity to prevent the formation or breakdown of biofilms holds promise for minimizing microbial colonization of surfaces and epithelial mucosa. Famuyide et al. (2019) reported that Eugenia and Syzygium species exhibit good antibacterial activity and against the biofilm formation. Coriander sativum and Pimpinella anisum plant extracts were against the E. coli, Staphyloccoccus aureus and inhibit colonize of bacterial biofilm formation (Bazargani & Rohloff, 2016). This study may lead to the formation of effective products for the treatment of antimicrobial infections using natural therapies.
Conclusion
The study concluded that the G. wightii leaves established the microscopical with physico-chemical, proximate analysis of the scientific validation and development of the quality of the species. The pharmacognostic standardization are the first report in this species. To evaluate the quality control parameters of Goniothalamus wightii leaves, which are used for traditional medicine for rheumatism diseases. The phytochemical screening was isolating the active metabolites in the hexane extracts to useful for the various treatments. The findings of this study highlight the value of traditional medicine, and this plant extract could be a valuable source of antibacterial and antibiofilm activities on Escherichia coli and Enterococcus faecalis as well potential antioxidant (50-80% inhibition) compounds against the free radicals. Furthermore, future investigations will require the separation of active metabolites and structural analysis of this plant in order to define the potent molecule from a pharmacological aspect through in-vivo analysis.
Author contributions
This research article was produced through collaboration between the authors. Conceptualization, M.A., and B.B.; writing original manuscript, V.P., and B.B.; Methodology, data curation, and formal analysis, V.P., S.C., M.S., V.M.; Review and editing, B.B., V.A.A., W.C.L., M.A; Interpretation, and review/revision, V.P., B.B., M.A. All authors have read and agreed to the published version of the manuscript.
Conflicts of interest
Given his role as Associate Editor, Balamuralikrishnan Balasubramanian has not been involved and has no access to information regarding the peer review of this article. Full responsibility for the editorial process for this article was delegated to Editor-in-Chief Carlos L. Cespedes Acuña. The authors hereby declare that they have no conflict of interest and have no known competing financial interests or personal relationships that could have appeared to influence the work reported in this paper.