

INTRODUCTION
Many plants are explored for potential sources with various pharmacological properties. Most of them are still unknown or less explored. One such tree mentioned in the Indian Ayurveda (He et al., 2020) is Neolamarckia cadamba (Pandey and Negi, 2018). Neolamarckia cadamba (Roxb.) Bosser is included in the “Rubiaceae” family; called “kadamb” in Hindi and “wild cinchona” in English. It grows in the humid habitat with high temperature. This miraculous tree is a fast-growing species that grows, both, in fertile, loose and humid soil and in humid sandy soil (Wang et al., 2021). Its wood is commercially important for biomass utilization (Tian et al., 2018), pulp and paper production (Misbahuddin, Biswas, & Roy, 2019), wood board making, furniture, and other construction purposes (Hao et al., 2020). It is recommended in Ayurveda for uterine problems, leprosy, blood disorders, and dysentery (Zhao et al., 2014). In spite of its traditional use for treating diseases like diabetes (George, Meshram, & Patil, 2021; Munira et al., 2020), this tree is still understudied scientifically. Neolamarckia cadamba contain various biologically active phytochemicals (Pandey & Negi, 2016). Leaves contain a variety of phytochemicals, including alkaloids, flavonoids, steroids (Kumar et al., 2015), as well as glycosidic and nonglycosidic alkaloids such as cadambine and iso-cadambine (Zhao et al., 2021).
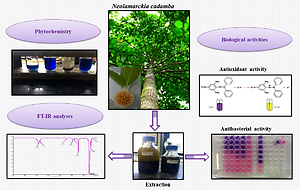
This research study focuses on the enhancement of knowledge of bio-potency of Neolamarckia cadamba leaves. With the view of comparative study, various solvents of different polarity were used to compare extraction efficiency of bioactive phytochemicals. Non polar solvents included petroleum ether and chloroform, mid polar included ethyl acetate whereas polar solvents used were methanol and water. This is the first report of Fourier Transform Infrared Spectroscopy (FT-IR) coupled phytochemical investigation of various extracts of its leaves. Present work also estimates the total phenolic, flavonoid as well as chlorophyll content. Antioxidant property of extracts was compared by performing in vitro DPPH assay (2, 2- Dipheny-l-picrylhydrazyl). Resazurin Microtiter assay was used to measure the antibacterial activity (Kasare et al., 2019).
Phytochemical screening methods that are based mainly on physical observations often fail to provide final conclusions. Under such circumstances, FT-IR scan for functional groups have contributed widely and served as a solution where confusions regarding the presence of phytochemicals existed. This is the first ever report of phytochemical screening of five different extracts of Neolamarckia cadamba leaves coupled with FT-IR spectroscopy. The study contributed significantly to confirm the presence of various functional groups in secondary metabolites, such as hydroxyl (sharp to very broad peaks corresponding to secondary metabolites such as sterols, long chain alcohols, phenolics and saponins), carbonyl (acids, methyl esters of fatty acids, steroids, amides and lactones), -CH groups (aromatic metabolites, steroids, long chain alkanes and alkenes), nitrogen containing compounds (alkaloids, amines and amides), etc. Our findings confirm the importance of FT-IR spectroscopy in identifying secondary metabolites found in plant extracts. So, this paper highlights the potential of Neolamarckia cadamba and identifies the most biopotent leaf extract.
MATERIALS AND METHODS
Chemicals and instruments
Extrapure analytical grade chemicals were purchased from SDF Mumbai. Other chemicals and reagents used include Gallic acid, Quercetin, anhydrous sodium carbonate (Na2CO3), Sulphuric acid (H2SO4, α-Naphthol, Magnesium turnings, Hydrochloric acid (HCl), Lead acetate, Aluminum chloride, Ferric chloride (FeCl3), Dragendorff’s reagent, Mayer’s reagent, Folin-Ciocalteu reagent, Fehling’s A and B, solvents such as Acetone, Ethyl acetate, Petroleum ether, Chloroform, Dimethyl Sulphoxide (DMSO), Methanol, and Sodium hydroxide (NaOH). DPPH used was from Sigma Aldrich. Double distilled water was used. The IR was measured with a Perkin Elmer Spectrometer. Bioactivities were recorded on SHIMADZU (UV-2450) UV-VIS Spectrophotometer.
Collection of plant material, authentication
Fresh kadamb leaves (1 kg) were obtained from University of Mumbai campus. The plant was verified and a voucher specimen was placed in the Blatter Herbarium, St. Xavier’s College, Mumbai (Specimen No. 116 of Y A Merchant). The leaves were washed twice using double distilled water, was air-dried to constant weight (210 grams) and finely powdered using grinder. It was then packed in a sealed container and stored under cold conditions until required.
Microbial strains
The microbial strains used in this study include two Gram-positive bacteria: Bacillus subtilis ATCC 6633, Staphylococcus aureus ATCC 25923; two Gram-negative bacteria: Escherichia coli ATCC 25922, Salmonella typhi ATCC 23564. These strains were obtained from National Chemical Laboratory, Pune.
Extraction process of powdered leaves
Finely powdered leaves (100 grams) were successively macerated for three days, at room temperature (r.t.). Solvents used in rising polarity order included petroleum ether, followed by chloroform, then ethyl acetate, next methanol and finally water. Solvent to sample ratio was 10:1 (v/w) which has been used as an ideal one for extractions. The efficiency of extraction was boosted via ultrasonication, i.e., by exposing the solution to ultrasonic waves for 30 min at regular intervals for eight hours (Frequency: 40 KHz and Power: 100 W). The extracts were decanted, followed by filtration using Whatman Grade 1 filter paper, and evaporated at r.t. until completely dry. This retained the possible thermolabile compounds present in the extract. Their percentage yields were calculated (Table 1), phytochemicals were screened, total phenolics, flavonoids and biological activities were determined.
Phytochemical Screening
Freshly prepared crude extracts of leaves of Neolamarckia cadamba were screened for various active phytoconstituents by employing following standard methods. (Harborne & B, 1998; Prashant, Bimlesh, Mandeep, Gurpreet, & Harleen, 2011; Trease, Evans, W, & C, 1989)
Test for Carbohydrates
Molisch’s test: Few drops of 1% alcoholic α-Naphthol and 3 mL conc. H2SO4 in 1 mL of test solution containing 50 mg of extract in 5 mL double distilled water confirms the presence of carbohydrates by the appearance of a reddish violet or purple ring at the intersection of two liquids.
Fehling’s test: 1 mL of Fehling’s (A+B) solution was added to test solution with 2 mg of extract in 1 mL double distilled water. The solution was shaken briskly and heated on waterbath for 10 minutes. Carbohydrates were confirmed by the appearance of brick red precipitate.
Test for Flavonoids
Shinoda’s test: Magnesium turnings in 5 drops of conc. HCl were added dropwise to 1 mL of test solution. After few minutes, a pink, scarlet or crimson red colour confirms flavonoids.
Alkaline reagent test: 5 drops of 5% NaOH is added to 1 mL of test solution. Intensity of yellow colour increases becoming colourless on adding few drops of 2M HCl. This indicates flavonoids.
Test for Saponins
Foam test: In a test tube, extracts were dissolved in water and shaken vigorously. A stable honey comb like froth persistent for about 10 minutes indicates saponins.
Test for Phytosterols
Salkowski’s test: 2 mg of extract was mixed in chloroform (CHCl3) and filtered. To this, conc. H2SO4 was added slowly along the sides of test tube. Red colouration, when allowed to stand, indicates phytosterols.
Test for terpenoids
Salkowski’s test: 2 mg of extract was shaken with 1 mL of CHCl3 and few drops of conc. H2SO4 was added. Red brown colour formed at the interface shows terpenoids present in the extract.
FT-IR Spectral analysis
The extracts were also characterized by FT-IR technique. Spectra obtained were analysed and presence of functional groups such as carbonyl, hydroxyl, etc. were confirmed.
Quantitative Estimation
Determination of total phenolic content
Folin Ciocalteu’s method was used to estimate total phenolic content. 1 mL of aliquots and gallic acid solutions (10, 20, 40, 60, 80, 100 μg/mL) was taken in each test tubes. 0.5 ml of Folin Ciocalteu’s reagent was added to 5 mL double distilled water. Post 5 minutes, 1.5 mL of 20 % sodium carbonate was added. Solution was diluted to 10 mL with double distilled water, incubated for 2 hours at r.t., developing intense blue colour. Absorbance was measured at 750 nm. The procedure was performed in duplicates. Solvent was used as blank. Standard drug was gallic acid. Total phenolic content was expressed as mg of gallic acid equivalent weight (GAE)/g dry mass (Bhalodia, Nariya, Acharya, & Shukla, 2011; Patel, Patel, Patel, Patel, & M, 2010).
Determination of total flavonoid content
Aluminium chloride colorimetric method (Zhishen, Mengcheng, & Jianming, 1999) was used to measure total flavonoid content. An aliquot (1 mL) of extracts and quercetin solutions (20, 40, 60, 80 and 100 mg/L) was added to 4 mL double distilled water in a10 mL volumetric flask. To the flask was added 0.3 mL of 5% NaNO2. 0.3 mL of 10% AlCl3 was added 5 min later. At 6th min, 2 mL of 1 M NaOH was added. Solution was diluted to 10 mL with double distilled water, mixed well and absorbance was measured against blank at 510 nm. Standard drug was quercetin. Total flavonoid content was calculated from linear equation derived from calibration curve and stated as mg quercetin equivalents (QE)/g fresh mass (Matotoka, Masoko, & P, 2018).
Estimation of total chlorophyll content
The amount of chlorophyll was evaluated by spectrophotometry by Arnon’s method (Kousar, Babu, Lavanya, Abraham, & G, 2007). 200 mg of fresh leaf tissue was homogenized in mortar using pestle in 30 mL 80% acetone. The homogenate was filtered using Whatman Grade 1 filter paper. It was centrifuged for 5 min at 5000 rpm. The supernatant dark red fluid from brief centrifugation was collected. Absorbance was read at 645 nm (A645) and 663 nm (A663) against the blank. The amount of chlorophyll pigment present in the sample was calculated according to Arnon’s formula,
Chlorophyll a (mg/L) = [(12.7 × A663) - (2.6 × A645)] × ml acetone /mg leaf tissue
Chlorophyll b (mg/L) = [(22.9 × A645) - (4.68 × A663)] × ml acetone /mg leaf tissue
Total Chlorophyll (mg/L) = Chlorophyll a + Chlorophyll b
Biological Evaluations
Antioxidant Activity
DPPH Free radical scavenging assay (Brand-Williams, Cuvelier, Berset, & C, 1995)
Briefly, 100 mL of 0.2 mM DPPH solution was prepared in methanol. 2 mL of extracts of various concentrations in methanol was added to 2 mL of above DPPH solution. The mixture was shaken briskly and allowed to stand for 30 min. Absorbance was measured at 517 nm. Samples were analysed in duplicates. Inhibition of DPPH free radical (%I) was calculated as (Kim, Lee, J, & H, 2019),
where control contains all reagents except test compound.
In vitro antibacterial activity
Preparation of microbial culture
All the five extracts of Neolamarckia cadamba leaves were assessed for antibacterial activity. Multidrug resistant (MDR) bacteria may live for lengthy periods of time and spread epidemics. Among the most dangerous and common MDR bacteria are Staphylococcus aureus, Escherichia coli and Bacillus species. Other important MDR pathogens include Salmonella species (WHO, 2012). Hence, these four species were considered for our antibacterial studies (Abreu, Mcbain, Andrew, & Manuel, 2012). Cultures of all four microbial strains were revived, maintained on Nutrient agar slants at 4°C. The procedure was done on 16-hour-old cultures.
Determination of minimum inhibitory concentration (MIC)
Resazurin microtiter assay (Bhuyan et al., 2017), endorsed by the World Health Organization (Katawera, Siedner, & Ii, 2014), was used to estimate MIC of extracts. Resazurin is a redox indicator dye, previously reported for determining the minimum inhibitory concentration of essential oils (Mann & Markham, 1998) from extracts. Faster antibacterial assays such as agar disk-diffusion method, Etest, cross streak method, etc., use expensive equipments, media and skilled microbiologists. Resazurin assay, on the other hand, is a simple, reliable, rapid and inexpensive colorimetric technique to detect MDR isolates, particularly non-water-soluble plant extracts, and can be easily adapted in low-income countries like India (Palomino et al., 2002; Teh, Nazni, Nurulhusna, Norazah, & Lee, 2017). Nutrient agar sub-cultured test organisms were used to prepare microbial suspensions in nutrient broth. They were incubated at 37°C for 16 hours. The turbidity of suspension was adjusted to 0.5 which represents McFarland standard number. Extracts were dissolved in DMSO and diluted with water to get a concentration of 1000 µg/mL. Two-fold dilutions in series gave concentration range 3.90-1000 µg/mL. Micro-titre plates with 96 well were used for this purpose. They were inoculated with 50 µL of microbial strains. Chloramphenicol (standard drug) was positive control and DMSO, negative. The micro-titre plates were and incubated at 37°C for 24 hours post sealing with parafilm. Resazurin (50 mL, 0.2 mg/mL in sterilized double distilled water) was added to wells and plates were reincubated for 30 min. Bio-active microorganisms were detected by resazurin’s colour change from purple to pink. Lowest concentration of extracts with no colour change was the MIC.
RESULTS AND DISCUSSION

Table 1
Percentage yield of Neolamarckia cadamba leaf extracts
Extracts | % yield | Colour | Consistency |
NCLE-A | 5.86 | Yellowish brown | Sticky |
NCLE-B | 2.91 | Yellow | Solid |
NCLE-C | 0.56 | Dark yellow | Sticky |
NCLE-D | 8.64 | Brown | Sticky |
NCLE-E | 12.76 | Dark brown | Solid |
Table 2
Phytochemical screening of Neolamarckia cadamba leaf extracts
Table 3
FT-IR spectral peak values and functional groups obtained for Neolamarckia cadamba leaf extracts
Table 4
Total phenolic and flavonoid contents of Neolamarckia cadamba leaf extracts
Extracts | TPC in GAE (mg gallic acid/g extract) | TFC in QE (mg quercetin/g extract) |
NCLE-B | 39.25 | - |
NCLE-C | 239.622 | - |
NCLE-D | 279.023 | 1067.48 |
NCLE-E | 169.298 | 683.60 |
Percentage yield of Neolamarckia cadamba leaf extracts
Table 1 shows the percentage yield, colour and consistency of each extracts obtained after successive extraction. Aqueous extract (NCLE-E) was obtained in high yield (12.76%) in solid form, followed by sticky methanol (NCLE-D, 8.64%), petroleum ether (NCLE-A, 5.86%) and chloroform (NCLE-B, 2.91%) extracts. All extracts ranged from yellow to brown in colour.
Phytochemical screening
Tannins and phenolics were found in NCLE-B, NCLE-C, NCLE-D and NCLE-E during their preliminary phytochemical screening (Table 2). Sterols and terpenoids were observed in NCLE-B, NCLE-C and NCLE-D. Only NCLE-E showed positive test for saponins. Flavonoids were present in NCLE-D and NCLE-E. NCLE-C, NCLE-D and NCLE-E showed the presence of carbohydrates. Presence of alkaloids was prominent in none of the extracts though they showed colour change non-spontaneously with little intensity.
FT-IR Spectral data interpretation
FTIR is feasibly the most effective tool to distinguish chemical bond forms (functional groups) present in compounds. The wavelength of the absorbed light is typical of chemical bonds. These chemical bonds are elucidated by interpreting the generated spectrum (Ashokkumar and Rangaswamy, 2014). Our study produced the FT-IR spectrum profile for Neolamarckia cadamba (Figures 1S to 5S). Major peak values, corresponding functional groups data and secondary metabolites present in the leaf extracts (NCLE-A, NCLE-B, NCLE-C, NCLE-D and NCLE-E) are presented in Table 3 (Baranska & Schulz, 2009). The studies confirmed the presence of alkaloids in NCLE-B, NCLE-C and NCLE-D which was doubtful in preliminary phytochemical screening. Thus, the first ever report of FT-IR spectroscopic studies coupled phytochemical investigation proves this technique to be very helpful in confirming phytochemicals in Neolamarckia cadamba leaves.
Total phenolic and flavonoid content
Table 4 gives total amount of phenolic and flavonoids content in Neolamarckia cadamba leaves. Total phenolic content (mg GAE/g extract) varied from 39.25 mg/g to 279.023 mg/g, which was obtained with the help of standard curve for Gallic acid (R2= 0.94477, Figure 6S (b)). Total phenolic content was the highest in NCLE-D, followed by NCLE-E and NCLE-C. NCLE-B had the lowest phenolic content. Using the standard curve generated for quercetin (R2= 0.96929, Figure 6S (a)), the highest total flavonoids content (mg QE/g extract) was found to be in NCLE-D with 1067.48 mg/g. NCLE-E was also rich in flavonoid content (683.60 mg/g).
Total Chlorophyll content
Amount of Chlorophyll in leaf tissue of Neolamarckia cadamba is tabulated in Table 5. Chlorophyll b was twice in quantity than chlorophyll a proving the abundance of light harvesting chlorophyll-protein complex (LHCII) than other complexes of Photosystem II (Kitajima, Hogan, & P, 2003); subsequently, a lower Chlorophyll a/b ratio of 0.496.
Table 5
Chlorophyll content (mg/L) present in Neolamarckia cadamba leaves
Sr. No. | Type of Chlorophyll pigment | Amount present (mg/L) |
1. | Chlorophyll a | 1.243 |
2. | Chlorophyll b | 2.507 |
3. | Total Chlorophyll | 3.75 |
Table 6
In vitro antioxidant activity of Neolamarckia cadamba leaf extracts
Table 7
Antibacterial activity of Neolamarckia cadamba leaf extracts, in Ivitro
Biological evaluations
DPPH Free radical scavenging assay
Table 6 shows IC50 values for all the extracts and reference drug ascorbic acid. The study found that ethyl acetate and methanol extracts proved to be excellent antioxidants with good free radical scavenging compared with butylated hydroxytoluene (BHT), a synthetic standard antioxidant.
In vitro antibacterial assay
MIC for potential extracts and standard drug Chloramphenicol is shown in Table 7. It was found that all extracts, except aqueous, possessed comparable antibacterial activity.
CONCLUSION
Percentage yield of extracts produced by successive extraction of Neolamarckia cadamba leaves was in the order: NCLE-E> NCLE-D> NCLE-A> NCLE-B> NCLE-C. Preliminary screening of these extracts confirmed the abundance of secondary plant metabolites such as terpenoids, tannins and phenolics. This matched the FTIR spectrum profiles generated for each extracts. Phenols and flavonoids were quantitatively found to be the highest in NCLE-D. Also, the amount of chlorophyll b was greater than chlorophyll a. We also found that methanol extract being rich in phenols and flavonoids, showed excellent antioxidant activity. Extracts also showed good antibacterial activity. Thus, it can be concluded that Neolamarckia cadamba is a promising tree with all its extracts showing various bioactivities. Bioassay guided isolation strategies and data in accordance with pharmacological and chemical profiles of extracts can yield promising drugs of future use.