

Introduction
Polycystic Ovary Syndrome (PCOS), a prevalent disorder affecting reproductive-aged women, spans from adolescence through post-menopause. The global incidence and prevalence of PCOS in reproductive-aged women, according to the National Institutes of Health (NIH), range from 4-10% (Teede et al., 2023). The condition manifests at various ages, commencing with menarche, with a notable prevalence observed between 20-30 years, impacting approximately 1.55 million women globally and contributing to 0.43 million disability-adjusted life years (DALYs) (Singh et.al., 2023).The pathophysiology of PCOS involves three principal components: the interplay between reproductive dysfunction and metabolic disorders, familial aggregation and heritability, and a significant influence of environmental factors (Harada et al., 2022). PCOS is characterized by key clinical manifestations, including hyperandrogenaemia, oligo/anovulation, and polycystic ovaries visible on ultrasound (Shi et al., 2023). Cytokines, soluble proteins secreted by various cells such as lymphocytes, macrophages, natural killer cells, mast cells, and stromal cells, play a crucial role in immune responses and function as mediators within the immune system communication network (Liu et al., 2021). Adipose tissue, recognized as an active organ, releases adipokines, hormones, and cytokines, influencing endocrine processes that regulate immunity, inflammatory responses, glucose, fatty metabolism, and reproductive capacity (Tosatti et al., 2020). The association between PCOS prevalence and chronic inflammation has heightened the focus on inflammatory factors. The etiology of PCOS may be influenced by an imbalance in pro-inflammatory and anti-inflammatory cytokines (Rudnicka et al., 2021). This inflammatory response, in turn, contributes to the development and exacerbation of PCOS's metabolic characteristics. The connection between PCOS, insulin resistance, obesity, and adipocytes significantly contribute to the synthesis of pro-inflammatory mediators, leading to chronic inflammation (Wu Het.al.,2015; Tilg et.al., 2008). Cytokines, as critical mediators overseeing immune and inflammatory responses, serve as biomarkers for various diseases. Quantifying cytokine levels is valuable for understanding physiological and pathological processes and aids in diagnosis and treatment. This study aims to evaluate cytokine levels in PCOS and control samples using qRTPCR to understand their pro and anti-inflammatory effects in blood fluid.
Hypothesis
In hypothesizing a potential link between inflammatory cytokine levels, genetic predispositions, and the onset of polycystic ovary syndrome (PCOS) based on the Rotterdam Criteria, we propose that variations in the levels of pro-inflammatory and anti-inflammatory cytokines may serve as indicators of PCOS development. It is conceivable that the inflammatory milieu plays a significant role in the pathogenesis of PCOS. Moreover, we postulate that the prevalence of excess adiposity among PCOS-afflicted women may contribute to the inflammatory state, echoing established connections between obesity, inflammation, and PCOS. Additionally, our hypothesis suggests a genetic underpinning for the chronic low-grade inflammation observed in PCOS patients, necessitating further exploration into the genetic determinants of inflammation in this context. Furthermore, we speculate that the hyperandrogenism characteristic of PCOS may precipitate inflammation in adipose tissues, thus potentially linking hormonal imbalances to inflammatory processes in PCOS. While our hypothesis offers plausible connections between inflammation, genetics, hormonal imbalances, and PCOS, comprehensive empirical research is essential to validate these conjectures and elucidate the underlying mechanisms. Consequently, thorough consideration of potential confounders and alternative explanations is imperative in substantiating our hypothesis.
Validation of Hypothesis
Sample Description
Consecutive women (aged 18-55 years) attending the outpatient clinic and In-vitro fertilization center at the Department of Obstetrics and Gynaecology, SDM Medical College and Hospital, Karnataka, were recruited for complaints of Hirsutism, irregular menstrual cycles, and other symptoms of PCOS. The study received approval from the Ethics Committee of SDM Medical College and Hospital, Dharwad (IEC No. SDMIEC/2023/349 dated 07/10/2022). Informed consent was obtained from all subjects before enrolment.
Inclusion Criteria
Females diagnosed according to the 2003 Rotterdam criteria (Azziz et.al., 2006) requiring the presence of two or more of the following features: clinical or biochemical evidence of hyperandrogenism (Hirsutism, Acne, alopecia), oligoanovulation (oligomenorrhea or amenorrhea), and polycystic ovaries upon ultrasonography. Patients with a high level of Anti-Mullerian hormone (AMH) (>4 ng/ml) were included.
Exclusions Criteria
Comprised women aged <18-year, postmenopausal women, those with congenital adrenal hyperplasia, Cushing's syndrome, androgen-secreting tumors or thyroid dysfunction, hyperprolactinemia syndrome, severe insulin resistance (HAIR-AN), pregnant women, women with diabetes, abnormal renal or hepatic function, and those using medications such as hormonal contraceptives, ovulation-inducing agents, glucocorticoids, or anti-androgenic drugs within the past 3 months. Women with primary premature ovarian failure were also excluded.
Control
Healthy women with no history of menstrual cycle problems, PCOS-related endocrine disorders, or hyperandrogenism were considered for the control group.
Blood Sampling
Whole peripheral blood samples were obtained from 30 PCOS females and age and Body Mass Index (BMI) -matched 30 control females.
Clinical Assessment
Personal interviews covered details of menstrual cycle, symptoms of hyperandrogenism, weight, height for BMI calculation, and history of drug intake. Ferriman Gallwey score (8 or above) (Yildiz et.al., 2010) for Hirsutism and definitions for Oligomenorrhea and amenorrhea were applied. Body weight, height, and waist circumference were measured followed by a detailed systemic examination, including blood pressure measurement. Grading of acanthosis nigricans, acne vulgaris, and androgenic alopecia was done by a single observer. PCO morphology was assessed with transabdominal ultrasonography performed during the follicular phase using a specific probe.
Blood Collection
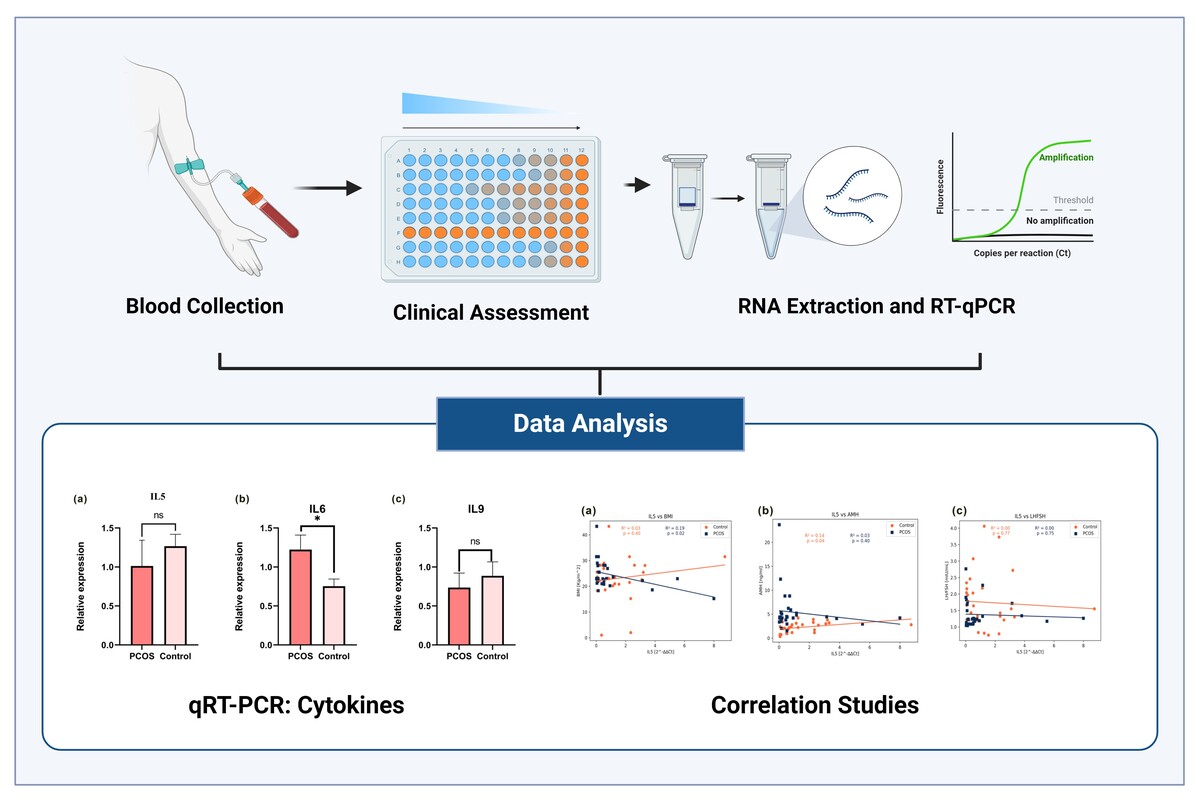
Blood Samples were taken after an eight-hour fast for biochemical and hormonal analysis on day 2 (D2) or day 3 (D3) of the follicular phase. Serum and Plasma were separated, and biochemical analysis was performed for thyroid profile, hemoglobin, serum prolactin, luteinizing hormone (LH), follicle-stimulating hormone (FSH), estradiol (E2), total testosterone (T.T), and fasting insulin (F.I) using approved test kits. RNA was extracted by Trizol method (Rio et al., 2010).
RNA Extraction and RT-qPCR
Total RNA was extracted using the Trizol method, and purity was determined using a Bio-Spectrophotometer (Eppendorf Pvt Ltd) and denatured gel Electrophoresis. Reverse transcription was performed using 500 ng of RNA template with PrimeScript 1st strand cDNA Synthesis Kit (Takara) with mixture of oligo(dT) and random hexamer primers with equal concentration of 50μm. cDNA samples were stored at -20°C until further use. qRTPCR (Rotor-Gene Q6 MDx-Qiagen, Hildon, Germany) was performed with TB Green Mix (Takara) (Maria-Ignacia., 2020) in a total volume of 20 μl. Each experiment was carried out in triplicates. A light cycler melting curve analysis was performed with specific melting temperatures. The sequences of the primers for genes Interleukins (IL) IL5, IL6, IL9, IL17A, Interferon-gamma (IFNγ), and Tumour Necrosis Factor-beta (TNFβ) were obtained from online sources. Data were normalized to the geometric mean of glyceraldehyde-3-phosphate dehydrogenase (GAPDH).
Statistical analysis
The normality of distribution of fold change values was analyzed with the Kolmogorov-Smirnov test. The nonparametric Mann-Whitney test was performed to compare each group when values did not follow a normal distribution, whereas the unpaired t-test was used for normal variables. Statistical analysis and graphical representation were performed with GraphPad Prism version 9.0.0. Results were analysed with a student’s t-test. The data were expressed as mean ± SEM and significance levels were set at *p < 0.005 **p < 0.01 and ***p < 0.0001. Pearson’s correlation coefficient was used to assess a possible linear association between two continuous quantitative variables.
In this study, we utilize hierarchical clustering coupled with correlation analysis to explore relationships within a dataset related to Polycystic Ovary Syndrome (PCOS). The dataset comprises various biomarkers and clinical parameters associated with PCOS, including IL5, IL6, IL9, IL17A IFNγ, and TNFβ, AMH, LH-FSH ratio, BMI, waist-to-hip ratio (WC-HC), fasting insulin levels, 17-hydroxyprogesterone (17-OHP), testosterone levels, and menstrual cycle characteristics. Following data loading and preparation in a pandas Data Frame, where 'Condition' denotes the PCOS condition. Utilizing Seaborn's cluster map function (Waskom et al., 2021), we conduct hierarchical clustering with correlation as the metric and single linkage method. The resultant cluster map offers insights into potential correlations and clusters among the PCOS biomarkers and clinical parameters. The colour palette of heatmap matrix indicates the R2 value distributed in 1 to 0, where 1 is highest.
Results
In this study, we recruited 30 healthy control participants and 30 patients with Polycystic Ovary Syndrome (PCOS). According to the Rotterdam criteria, the 30 cases of PCOS exhibited a notable prevalence, with 16 (53.3%) showing signs of oligomenorrhea, clinical and/or biochemical hyperandrogenism, and polycystic ovaries. Additionally, 7 cases (23.3%) displayed oligomenorrhea and clinical and/or biochemical hyperandrogenism without polycystic ovaries, as depicted in Table 1.
Table 1
Prevalence of PCOS according to Rotterdam Criteria
The prevalence rate of PCOS was observed in different age groups, with 9 cases (30%) each in the age groups of 23-26 and 27-30. The age group of >30 had 10 cases (33.33%), while the age group of 18-22 showed lower prevalence with 2 cases (6.66%), as illustrated in Table 2.
Table 2
Prevalence of PCOS in Different Age Groups
| Age (years) | Frequency (%) |
|---|---|
| 14-18 | Nil |
| 19-22 | 2 (6.66%) |
| 23-26 | 9 (30%) |
| 27-30 | 9 (30%) |
| Above 30 | 10 (33.33%) |
| Total | 30 |
The social demographic profile of PCOS patients revealed significant differences in Age (Years) with a p-value of 0.022 compared to the control group. The mean ages were 28.3 ± 5.93 for PCOS patients and 28.76 ± 6.90 for the control group. Marital status analysis indicated a higher incidence of PCOS in married individuals (23 cases, 76.6%), particularly those with primary education (12 cases, 40%).
Waist circumference for WC/HC (cm) demonstrated a significant difference (p-value < 0.0001) between the control (mean value: 0.82 ± 0.28) and PCOS (mean value: 0.76 ± 0.32) groups. Dietary habits, focusing on vegetarian patterns, showed a prevalence of 60% in PCOS and 63.33% in the control group, as summarized in Table 3. Notably, no correlation was observed between family history and the development of PCOS.
Table 3
Demographic Profile of PCOS patients
*p value < 0.05 ** p value < 0.001
Clinical biochemical assessments were conducted for all 30 PCOS cases and controls. The LH/FSH test revealed a mean value of 1.37 ± 0.85 for PCOS and 1.75 ± 0.49 for the control group (p-value < 0.0251). Testosterone and AMH exhibited highly significant p-values of < 0.0001 and < 0.0004, respectively. Conversely, no significance was found for haemoglobin and fasting insulin (p-value: 0.515). The hormone 17 hydroxyprogesterone showed mean values of 108.9 ± 26.52 for PCOS and 82.43 ± 3.934 for the control group, with a significant p-value of < 0.0001. Additionally, total cholesterol, HDL mg/dL, and LDL mg/dL displayed highly significant p-values of < 0.0001, as detailed in Table 4.
Table 4
Biochemical Characteristics of the PCOS patients
*p value < 0.05; ** p value < 0.001 *** p value < 0.0005
Total RNA extraction was conducted using the Trizol reagent method across a cohort of 60 subjects. Quantification and quality assessment revealed a concentration of 454.56 ng/μL, with an A260/A280 ratio of 1.93 and A260/A230 ratio of 1.98, indicative of high purity. The integrity of the RNA was further confirmed through 1% formaldehyde Agarose Gel Electrophoresis, displaying distinct bands corresponding to 28S and 18S RNA, underscoring the quality of the RNA samples.
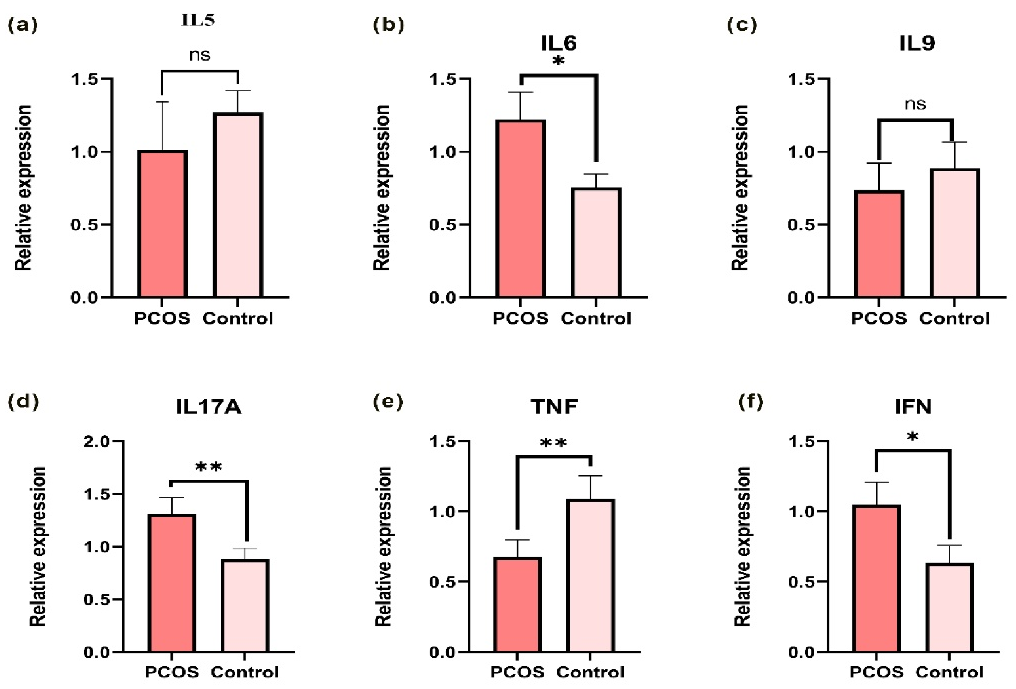
The expression levels of targeted cytokine markers were analyzed using the Rotor-Gene software analysis module. Data were normalized to an endogenous reference gene, and fold changes in target gene expression relative to the calibrator were calculated using the 2-ΔΔCt method. Bar plots were generated to illustrate the mean ± S.E fold changes of IL5, IL6, IL9, IL17A, IFNγ, and TNFβ in both PCOS and control groups (Figure 1(a-f)). The mean ± S.E fold changes of IL5 (1.013 ± 0.3638, p = 0.4885) relative expression were higher in PCOS. IL6 (1.22 ± 0.2016, p < 0.005), IL9 (0.7359 ± 0.25, p = 0.56), IL17A (1.311 ± 0.1852, p < 0.05) IFNγ (1.049 ± 0.2016, p < 0.05), and TNFβ (0.6764 ± 0.2019 p < 0.005) relative to GAPDH endogenous control were significantly higher than control. and the expression level of IL9 and IL5 did not show significance between control and PCOS whereas the cytokines IFNγ, TNFβ, IL6 and IL17A showed significant expression levels with p-value < 0.05.
Figure 1
Quantitative-RT-PCR demonstrates the expression of pro-and anti-inflammatory cytokines. (a) IL5 expression in PCOS and Control samples showed no significant changes. (b) IL6 levels significantly increased in PCOS patients compared to the control samples. (c) IL9 expression did not exhibit any significant changes compared to PCOS patients and controls. (d) IL17A expression significantly increased in PCOS patient compared to control samples. (e) TNF-β significantly expressed in control compared to PCOS (f ) IFN-γ demonstrated comparatively increased expression in patients with PCOS compared to controls. The Mann-Whitney U test was performed using Graph Pad Prism 9.0 (*: p-value < 0.05, **: p-value < 0.001, ***: p-value < 0.001).
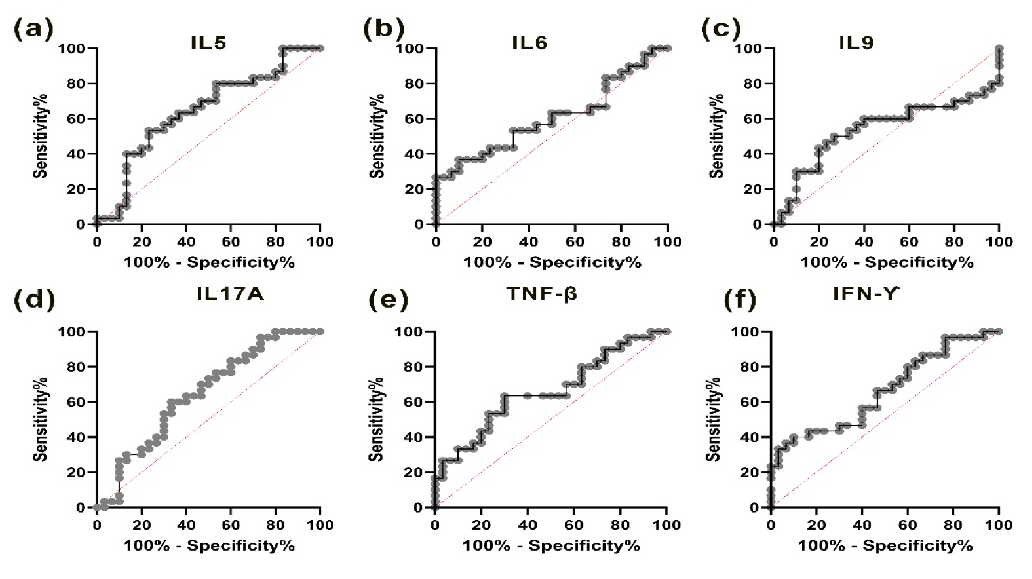
To differentiate between individuals with polycystic ovary syndrome (PCOS) and healthy controls, Receiver Operating Characteristic (ROC) curves were generated. The ROC curve for IL5 demonstrated an Area Under the Curve (AUC) of 0.645 at a threshold of 0.072, effectively distinguishing PCOS cases from control subjects with 100% sensitivity and specificity (Figure 2(a); p-value < 0.05). IL6 yielded an AUC of 0.6056 at a threshold of 0.074 (p = 0.1602) (Figure 2(b)), while IL9 showed an AUC of 0.5378 at a threshold of 0.078 (p = 0.6152) (Figure 2(c)). Notably, IL17A displayed an AUC of 0.6456 at a threshold of 0.071 (p < 0.05) (Figure 2(d)), and IFNγ exhibited an AUC of 0.6611 at a threshold of 0.070 (p < 0.05) (Figure 2(e)). Furthermore, TNFβ demonstrated a remarkable AUC of 0.918 at a threshold of 0.036 (p < 0.0001) (Figure 2(f)).
Figure 2
Receiver operating characteristic Curve showing the specificity & sensitivity for the pro & anti-inflammatory cytokines level in PCOS & Control sample. (a) ROC of IL5 (b) ROC of IL6 (c) ROC of IL9 (d) ROC of IL17A (e) ROC of TNF β (f) ROC of IFN γ.
Exploring the clinical correlations of PCOS for BMI, AMH, and LH/FSH, significance values were determined for IL-5, IL-6, IL-9, IL-17A, IFNγ, and TNFβ (Figure 3-4), enhancing the scientific rigor of the study. To identify the role of cytokines in PCOS we performed simple linear regression analysis in two groups.
Figure 3
The graph represents the BMI and biochemical correlations, as well as the expression levels of Interleukin 5 to 9 (IL5, IL6, IL9), body mass index (BMI), Anti- Müllerian hormone (AMH), and the LH/FSH ratio in both polycystic ovary syndrome (PCOS) and control subjects (n = 30 each). The correlations observed include: (a) a negative correlation between IL5 and BMI (p = 0.02); (b) a negative correlation between IL5 and AMH (p = 0.40); (c) a negative correlation between IL5 and LH/FSH (p = 0.75); (d) a positive correlation between IL6 and BMI (p = 0.02); (e) a negative correlation between IL6 and AMH (p = 0.35); (f) a negative correlation between IL6 and LH/FSH (p = 0.39); (g) a positive correlation between IL6 and BMI (p = 0.33); (h) a negative correlation between IL6 and AMH (p = 0.17); and (i) a negative correlation between IL6 and LH/FSH (p = 0.94).
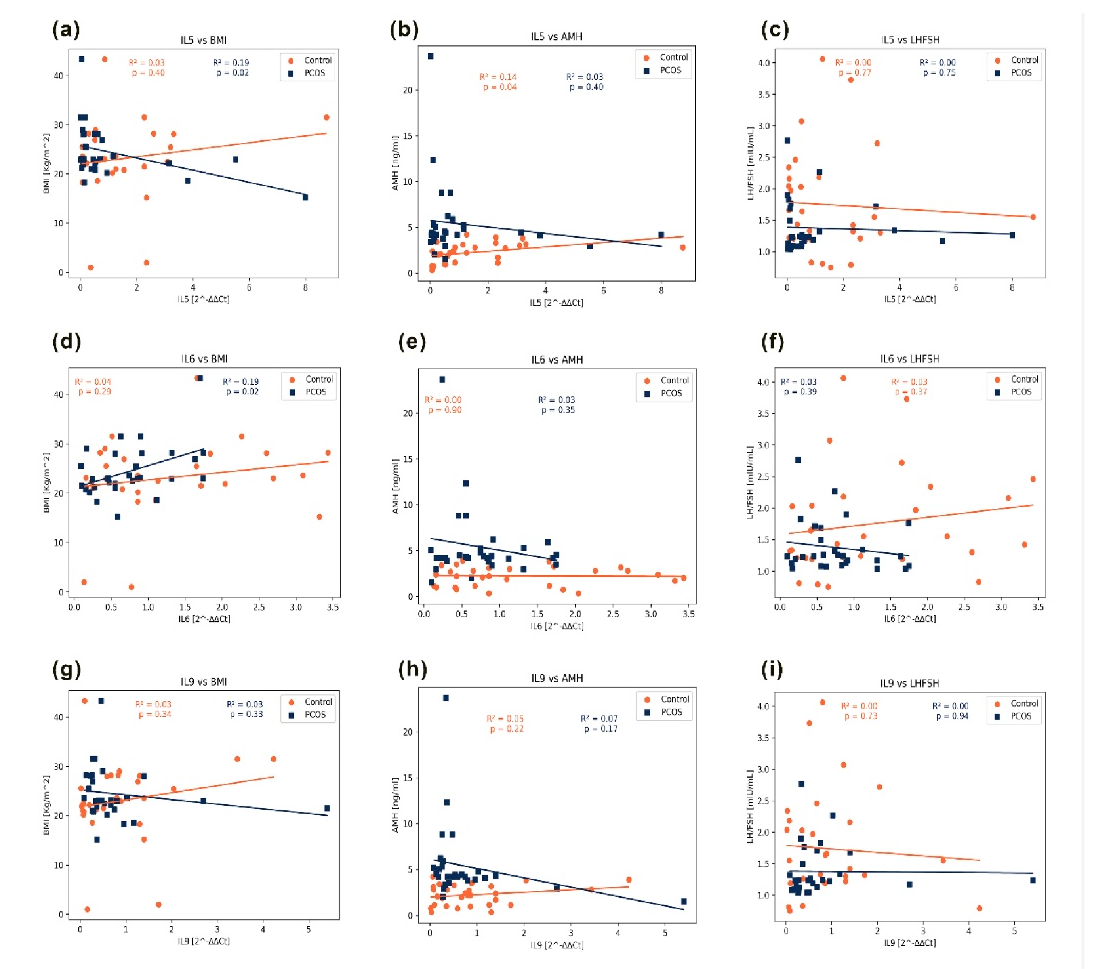
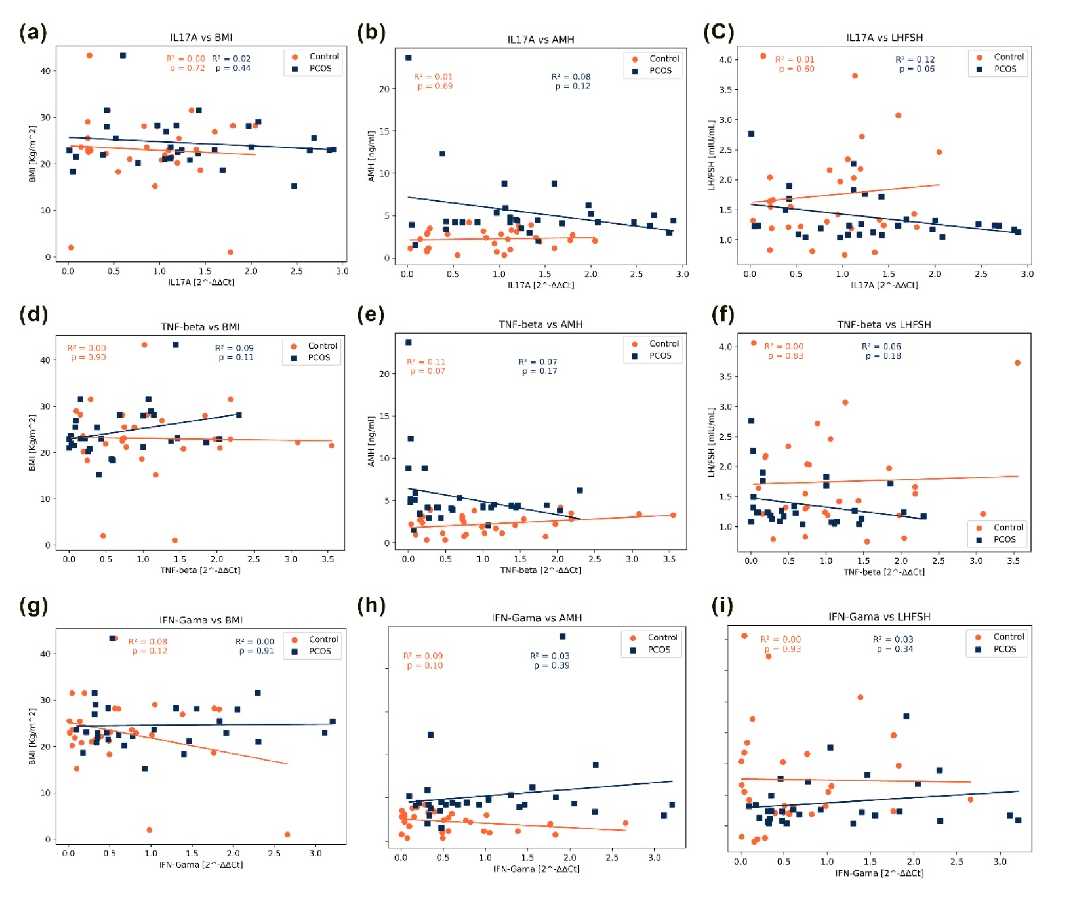
Figure 4
The graph demonstrations BMI and biochemical correlations, alongside expression levels of Interleukin 17A (IL17A), Tumour necrosis factor beta (TNF-beta), Interferon gamma (IFN-γ), body mass index (BMI), Anti-Müllerian hormone (AMH), and the LH/FSH ratio in both polycystic ovary syndrome (PCOS) and control subjects (n = 30 each). Correlations observed are: (a) IL17A negatively correlates with BMI (p = 0.44); (b) IL17A negatively correlates with AMH (p = 0.12); (c) IL17A negatively correlates with LH/FSH (p = 0.06); (d) TNF-β positively correlates with BMI (p = 0.11); (e) TNF-β negatively correlates with AMH (p = 0.17); (f) TNF-β negatively correlates with LH/FSH (p = 0.18); (g) IFN-γ positively correlates with BMI (p = 0.91); (h) IFN-γ negatively correlates with AMH (p = 0.39); and (i) IFN-γ negatively correlates with LH/FSH (p = 0.34).
In Figure 3(a), the IL5 level exhibited a negative correlation with BMI (r2 = 0.19, p = 0.02), while showing no significant correlation with AMH (r2 = 0.03, p = 0.40) and LH/FSH (r2 = 0.00, p = 0.75). Conversely, in Figure 3(d), the IL6 level displayed a positive correlation with BMI (r2 = 0.19, p = 0.02), alongside a negative correlation with AMH (r2 = 0.03, p = 0.35) (Figure 3(e)) and LH/FSH (r2 = 0.00, p = 0.03) (Figure 3(f)). In Figure 3(f), IL9 levels demonstrated an insignificant correlation with BMI (r2 = 0.03, p = 0.33), as well as with AMH (r2 = 0.07, p = 0.17) (Figure 3(h)), while exhibiting a positive correlation with LH/FSH (r2 = 0.00, p = 0.94) (Figure 3(i)).
In Figure 4(a), the correlation between IL17A levels and BMI was found to be negative correlated (r2 = 0.02, p = 0.44), as observed in Figure 4(b) for AMH (r2 = 0.08, p = 0.12), and in Figure 4(c) for LH/FSH (r2 = 0.12, p = 0.06). Conversely, TNFβ levels exhibited a positive correlation with BMI (r2 = 0.09, p = 0.11) in Figure 4(d), while showing a negative correlation with AMH (r2 = 0.07, p = 0.17) in Figure 4(e), and with LH/FSH (r2 = 0.06, p = 0.18) in Figure 4(f). Notably, the correlation between IFNγ levels and BMI was found to be positive correlation (r2 = 0.00, p = 0.91) in Figure 4(g), as well as for AMH (r2 = 0.03, p = 0.39) in Figure 4(h), and LH/FSH (r2 = 0.03, p = 0.34) in Figure 4(i).
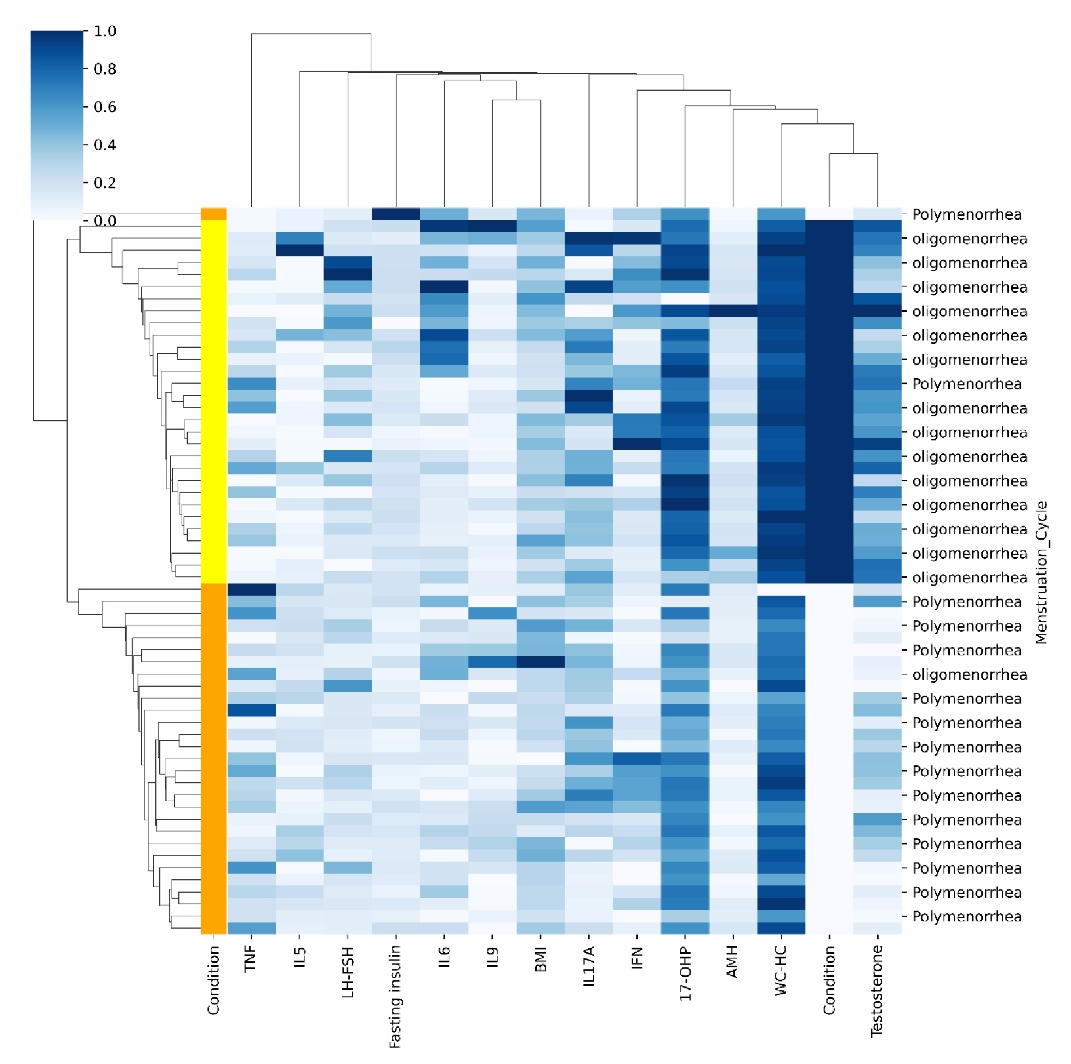
Further, correlation studies on biochemical parameters, demographic factors, and gene expression profiles were conducted. The study inferred that menstrual cycles might be slightly less regular in individuals with PCOS. This inference stemmed from observing a modest correlation (depicted in light blue in Figure 5) between menstrual cycles and factors such as TNFβ, IL5, LH/FSH ratio, fasting insulin, BMI, IL17A, IFNγ, 17-OH progesterone, and waist-to-hip ratio. Similarly, the study examined testosterone levels, revealing a potential association between higher testosterone levels and slightly elevated BMI, waist-to-hip ratio, and 17-OH progesterone, indicative of a possible indication of PCOS. In Cluster 1, it is critical to differentiate between samples from PCOS patients, marked in orange, and those from healthy controls, indicated in yellow.
Figure 5
The Illustration of Correlation and Clustering Heatmap of Clinical Parameters in PCOS Patients and Controls. The heatmap indicates the correlation between clinical parameters and PCOS symptoms, as well as clinical biomarkers. A total of 30 control samples and 30 PCOS patient samples were analyzed. The heatmap clusters primarily based on the source of the samples, distinguishing between those collected from PCOS patients (depicted in orange) and healthy individuals (depicted in yellow). Correlation values are represented in terms of R2 values, with blue indicating the highest correlation (1) and white indicating the lowest (0). The clear clustering by sample source suggests significant differences in clinical parameter profiles between PCOS patients and healthy individuals.
Discussion
The most prevalent endocrine disorder among reproductive-age women is polycystic ovary syndrome. There is no significant geographical difference in prevalence when employing the most inclusive definition, with the widely used 2003 Rotterdam criteria (Harada et al., 2022). Approximately 8% and 20% of women with PCOS pathophysiology conditions are influenced by alterations in steroidogenesis, ovarian folliculogenesis, neuroendocrine function, metabolism, insulin production, insulin sensitivity adipose cell activity, inflammatory factors, and sympathetic nerve functions (Ibanez et al., 2017). The four key contributors to pathophysiological alterations in PCOS include high consumption of carbohydrates, hyperinsulinemia, hyperandrogenaemia, and persistent low-grade inflammation (Barrea et al., 2018). The connection between low-grade chronic inflammation is intricate and not completely elucidated. While few studies proposed an association between PCOS and inflammation, the precise cause and causal nature of this relationship are still subjects of ongoing investigation. Inflammatory markers such as IL6, TNFɑ, IL17, CRP (C-reactive protein), NLR (neutrophil-to-lymphocyte ratio), and PLR (platelet-to-lymphocyte ratio) have been reported in inflammation (Dey et al., 2023).
In our study, a total of 60 patients were recruited, comprising 30 with PCOS and 30 healthy controls. The results revealed that 53.3% and 23.3% met the Rotterdam criteria (RC) for oligomenorrhea, clinical and/or biochemical hyperandrogenism, and polycystic ovaries. Additionally, some exhibited oligomenorrhea and clinical and/or biochemical hyperandrogenism without polycystic ovaries. A higher prevalence was observed in the age group of >30, accounting for 33.33%, followed by the age groups of 23-26 and 27-30, each with 30 samples. A study conducted in India, with city-based participant selection, reported a mean age occurrence of 17-24 according to RC, showing a prevalence of 8.2% (± 2.74) (95% CI) (Gupta et al., 2017).
In a population-based study in the USA period from 2006 to 2019, the incidence was 42.5 per 10, person-years. Although the rates remained similar over time, there was an increase in individuals aged 16 to 20 years, from 31.0 to 51.9 per 10,000 person-years, and a decrease among those aged 26 to 30 years, from 82.8 to 45.0 per 10,000 persons-years (Yu et al., 2023). A report from Kashmir indicated a mean age of 15-40 for PCOS according to RC, NIH (National Institute of Health), and AES (Androgen Excess Society), with a sample size of 964 and a prevalence incidence of 13.59%, 11.11%, and 13.17%, respectively (Ganie et al., 2020).
In another study conducted in Telangana state, the age range was 15-45 according to RC, with an 11.54% prevalence among a sample size of 624 (Bharali et al., 2022). Meanwhile, in Karnataka state, the mean age was 18-30 according to RC, with a prevalence of 4.55 and a sample size of 396 (Nanjaiah et al., 2018).
In our study, marital status was found to be associated with a high incidence of PCOS (23, 76.6%). The WC/HC circumference demonstrated a significant difference (p < 0.001) when compared between the control and PCOS groups. This was followed by LH/FSH, Testosterone, and AMI, each with a p-value of < 0.0251, < 0.001, and < 0.004, respectively. The hormone 17-hydroxyprogesterone showed a p-value of < 0.001, and total cholesterol, HDL, and LDL exhibited significant p-values of < 0.001. Dietary factors also showed an association with PCOS, with 60% following a vegetarian pattern in comparison to 63.33% in the control group. Married status was observed to be married with a percentage of 59,9%. Clinical examination revealed high hyperandrogenism in women with PCOS (63.9%) compared to the control group (22.8%), and it was statistically significant. Both BMI and waist circumference ± 0.80 were observed in a higher proportion of women with PCOS than in the control and showed a high-level significance (p-value < 0.001) (Kazemi et al., 2020). Additionally, BMI, Waist/hip ratio showed a significant p-value of < 0.001 in another study (Gupta et al., 2017). A cross-sectional study has determined dietary plan influence on ovarian morphology (Kazemi et al., 2020).
In our present study, the gene expression profile of inflammatory markers was compared between PCOS and healthy control samples with six inflammatory markers with endogenous control. Significance in expression was demonstrated by the upregulation of IL6 ((1.22 ± 0.2016, p < 0.005), IL17A (1.311 ± 0.1852, p < 0.05), IFNγ (1.049 ± 0.2016, p < 0.05), and TNFβ (0.6764 ± 0.2019 p < 0.005. No correlated expression was observed for IL5 (1.013 ± 0.3638, p = 0.4885) and IL9 (0.7359 ± 0.25, p = 0.56). ROC analysis revealed 100% sensitivity and specificity for IL5 (p < 0.05), IL17A (p < 0.025), and IFNγ (p < 0.05), and significant results were obtained for TNFβ(p < 0.0001), whereas IL5 did not show any significance.
Spearman’s correlation analysis between groups indicated a positive correlation for IL5 with AMH, BMI, and similarly, IL6 showed a positive correlation with BMI, LH/FSH. IL9 exhibited correlations with BMI, LH/FSH, while IFNγ demonstrated a negative impact on AMH and LH/FSH. TNFβ showed correlations with AMH and LH/FSH.
The levels of tumor necrosis factor (TNF), transforming growth factor-beta (TGFβ), and interleukins (IL-10, IL6, IL-12, IL-4, and interferon-gamma (IFNγ)) exhibited statistically significant differences in both the PCOS and control groups. Lower TNF/IL6 ratios were observed in women with PCOS compared to the control group (Tosatti et al., 2020). However, TGFβ and IFNγ did not demonstrate a significant difference between the PCOS and control groups, although our study revealed significance for IL-6, TGFβ, and IFNγ, respectively.
In another study, cytokines such as IL-1, RA, IL-2, IL-17E, IL-17A, IL-18, and MIP-1a were found to be higher in women with PCOS, irrespective of their weight status (p < 0.05). Our study indicated a positive association of IL-17A with PCOS. Subgroup analysis of lean women with PCOS showed higher levels of IL-1a, IL-3, IL-4, IL-18, IL-9, IL-12, IL-13, IL-15, TNFɑ and β, SCD40L, FKN, Exotaxin, MCP-3, and MIP-1b compared to the control group (p < 0.005). Notably, our study did not find any significance with cytokines such as IL-5 and IL-9 (Tosatti et al., 2020).
Menstruation cycle irregularities, a hallmark of PCOS (Harris et al., 2017) are assessed through parameters such as menstrual cycle regularity, with oligomenorrhea and polymenorrhea indicating irregularities. Cluster 2 delves into various biomarkers associated with PCOS pathology. TNF-alpha and IL5, both cytokines, suggest potential involvement in immune system dysregulation and inflammation linked to insulin resistance, a common PCOS trait (Shabbir et al., 2023) Additionally, the elevated LH-FSH ratio, fasting insulin levels, and BMI are indicative of metabolic dysfunctions characteristic of PCOS (Rashid et al., 2022). The presence of cytokines IL17A and IFN-gamma further underscores immune system involvement, potentially affecting ovulatory function and insulin sensitivity. Furthermore, elevated 17-OH progesterone levels contribute to hyperandrogenism, while the WC-HC ratio highlights the significance of body fat distribution in metabolic complications, including those associated with PCOS. The limitation of the study is the insulin resistance and lifestyle factors like diet, physical activity and stress levels may influence inflammatory markers although BMI matches minimize the metabolic differences to some extent, the cross-sectional analysis approach of the study provide initial investigation, longitudinal study would provide deeper insights about cytokines and PCOS relationship. Future research should incorporate larger multicentric studies and mechanistic investigations to clarify the findings.
Conclusion
The study highlights on the inflammatory mediators, especially IL6, IL9, IFNγ and TNFβ are higher in PCOS patients. The continuous release of inflammatory markers leads to long-term metabolic complications. Although exact mechanisms are not fully understood further studies are needed to establish for correlation between hormonal imbalance and other clinical features and genes which paly that significant roles in the pathophysiologic mechanism implicated in the inflammatory process in PCOS
Author contributions
AJ: Sample Collection, Sample Analysis, Methodology, Data Analysis, Formal Validation, writing-review and editing, JP: Data Analysis, Formal validation, writing-review and editing, AN: Collected Patient information & Sample, SKS: Collected Patient information & Sample, AKO:Conceptualization, Methodology, writing-review and editing, project administration, supervision, and editing manuscript, All authors contributed to the article and approved the submitted version.
Ethical approval & Informed consent
The study with human subjects underwent evaluation and endorsement by the Ethics Committee of SDM College of Medical Sciences and Hospital, affiliated with Shri Dharmasthala Manjunatheshwara University, Dharwad, Karnataka, India. Written informed consent was obtained from all patients/participants prior to their involvement in the study.