

1. INTRODUCTION
Marine sponges, among the oldest known metazoans, host diverse and complex microbial communities that play an integral role in their biology, supporting key functions such as nutrient cycling, chemical defense, and structural stability (Hardoim et al., 2021). These microbial consortia—comprising bacteria, archaea, and fungi—have coevolved with their sponge hosts, leading to the biosynthesis of an extensive array of structurally unique secondary metabolites (Pita et al., 2018). Notably, many of these sponge-associated microbial metabolites exhibit potent bioactivity, making them promising candidates for pharmaceutical applications, including antibiotics, antivirals, and anticancer agents (Schorn et al., 2016).
Secondary metabolites are typically categorized based on their biosynthetic origins and chemical structures into major classes, such as polyketides, nonribosomal peptides, terpenoids, alkaloids, and phenylpropanoids. Each class encompasses structurally diverse compounds with distinct biological activities. For instance, polyketides, such as the antibiotic erythromycin and the anticancer agent doxorubicin, are synthesized by polyketide synthases and display broad-spectrum bioactivity (Staunton & Weissman, 2001). Similarly, nonribosomal peptides like vancomycin, produced by nonribosomal peptide synthetases, exhibit potent antibacterial, antifungal, and immunosuppressive properties (Süssmuth & Mainz, 2017).
Investigating the biosynthetic pathways of marine-derived microorganisms not only enhances our understanding of the ecological and evolutionary dynamics of symbiotic relationships but also provides insight into how bioactive
secondary metabolites contribute to survival strategies. This is particularly evident in meroterpenoids, a class of hybrid natural products that integrate polyketide and terpenoid moieties, resulting in structurally complex molecules with significant biological activities (Davies & Davies, 2010). These metabolites often serve ecological roles, such as chemical defense against predators and microbial competition. Interestingly, elucidating these interactions is essential for guiding conservation strategies and ensuring the sustainable utilization of marine biodiversity (Busch et al., 2023).
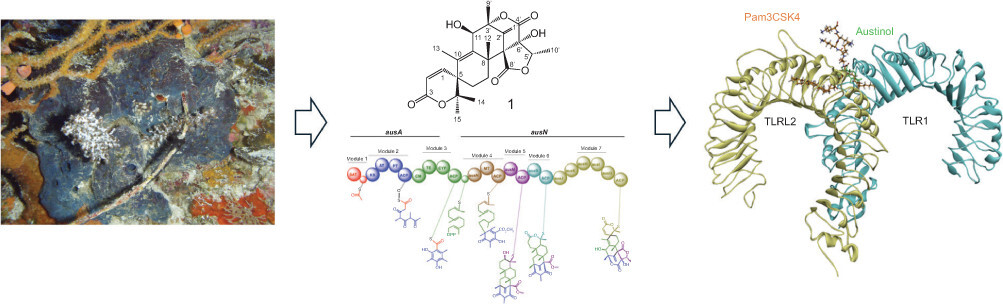
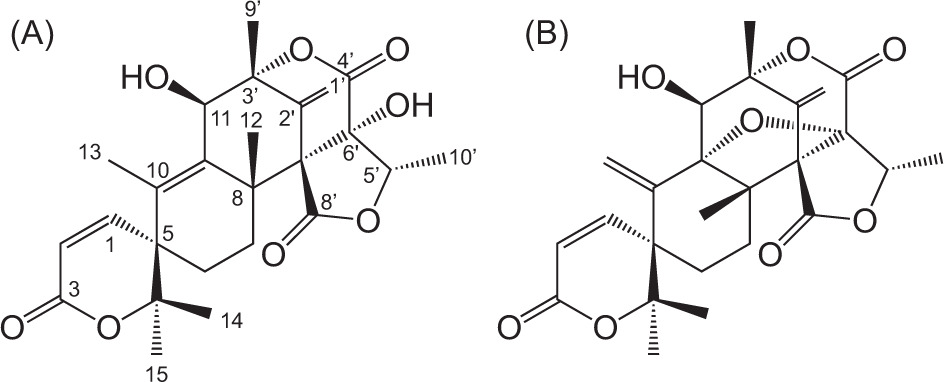
Meroterpenoids, in particular, have attracted significant attention due to their pharmacological potential. Notable examples include austinol (1) and its derivative, dehydroaustinol (2) (Figure 1), meroterpenoids isolated from the marine-derived fungus Aspergillus nidulans. These compounds exhibit diverse bioactivities, including cytotoxicity against cancer cell lines and antimicrobial properties. The biosynthetic pathways governing their production are of particular interest due to their potential applications in drug discovery. As part of our chemical investigation of marine invertebrates from the Indian Ocean littoral zone (2020–2022), we identified several deep-sea sponge species, including Plakortis simplex, in Lhok Mata Ie, an isolated region in Aceh Besar, Indonesia (Kurnianda & Musman, 2021). This study aims to elucidate the structure of P. simplex–derived metabolites and evaluate their biological activities using spectroscopic and in silico approaches. Additionally, we analyzed the biosynthetic gene clusters (BGCs) responsible for producing austinol (1), a meroterpenoid compound, in the endosymbiotic fungus A. nidulans associated with Indonesian marine sponges.
2. EXPERIMENTAL SECTION
2.1. Experimental
A Bruker Avance III-500 spectrometer was used to record the 1H and 13C NMR spectra in CDCl3. Chemical shifts were shown as parts per million (ppm), and an internal standard was a tetramethylsilane (TMS) signal. A Jeol JMS-T100LP spectrometer was used to measure the HRESIMS data. A Jasco P-1010 polarimeter was used to detect optical rotation. A Jasco FTIR 300 spectrophotometer was used to obtain FTIR spectra. An HPLC system with a Shodex RI-101 detector, an SPD-20A UV detector, a Shimadzu LC20A pump, and a Nacalai Cosmosil column (5C18-AR-II, 10 × 250 mm) were used to carry out the isolation steps. For chromatography, Merck precoated TLC silica gel 60F254 plates and silica gel 60 were utilized. All solvents used for experiments were reagent grade.
2.2. Biomaterial
The fungal strain, A. nidulans strain was isolated from the Indonesian marine sponge P. simplex around Lhok Mata Ie in 2022. Furthermore, the fungus (strain LMI2022) was identified as A. nidulans NRRL 8112 based on the 18S rDNA fragment. In addition, a standard of the A. nidulans strain NRRL 187 from Fisher Thermo Scientific was used in this study. Additionally, A. nidulans was grown at 30 °C in DPY medium (consisting of 2% dextrin, 1% polypeptone, 0.5% yeast extract (Difco), 0.5% KH2PO4, and 0.05% MgSO47H2O) for 3 days to serve as the source for cloning each gene in the Aus cluster. Following a 3-week fermentation period, the medium was extracted using EtOAc.
Standard DNA engineering procedures were carried out with Escherichia coli DH5α obtained from Clontech (Mountain View, CA). E. coli transformants containing each plasmid were cultured in Luria–Bertani medium and selected using the appropriate antibiotics. E. coli Rosetta™ (DE3) pLysS (Novagen) was employed for the expression of AusE.
2.3. Extraction and isolation
The induced culture of the transformant expressing AusG medium (5 L) was extracted using acetone (2 L) thrice. Then, the residue was partitioned between EtOAc and water. The EtOAc portion (65.28 mg) was subjected to open column chromatography on silica gel. Fractions eluted with n-Heksane-EtOAc-MeOH were combined and further separated on a reverse phase HPLC (80% aqueous MeOH) to yield austinol (1, 12.63 mg) and dehydroaustinol (2, 5.28 mg) from EtOAc extract as a white amorphous solid. Furthermore, compounds 1 and 2 were confirmed by comparing the previously reported 1H and 13C NMR data.
Compound 1: White amorphous solid; C25H30O8, [α]D20+44 (c 0.1, CHCl3); IR (thin film) νmax: 3510, 2939, 1750 cm−1; 1H and 13C NMR (see Table 1; HRESIMS m/z 458.19404 [M+H]+ (calculated for C25H31O8, 458.19406).
Table 1
NMR data of 1 and 2.
Compound 2: White amorphous solid; C25H28O8, [α]D20+66 (c 0.1, CHCl3); IR (thin film) νmax: 3510, 2939, 1750 cm−1; 1H and 13C NMR (see Table 1); HRESIMS m/z 456.17843 [M+H]+ (calculated for C25H29O8, 456.17840).
2.4. In silico experiment
2.4.1. Preparing the target protein and compounds 1 and 2
The three-dimensional structure of the TLR1/TLR2 heterodimer, with the accession ID 2Z7X and a resolution of 2.10 Å, was obtained from the Protein Data Bank (PDB) (https://www.rcsb.org). The protein was then prepared for analysis using Chimera 1.15 by removing the standard ligand (Pam3CSK4) and water molecules. Additionally, polar hydrogen atoms and Gasteiger charges were added to the protein structure to facilitate molecular docking analysis. Meanwhile, the three-dimensional structure of compounds 1 and 2 was designed and optimized using the semiempirical PM6 method with Gaussian 09W software.
2.4.2. Molecular docking method
The prepared ligand was docked into the central binding pocket of TLR1/TLR2 using AutoDock Tools 1.5.6. For both ligands 1 and 2, a grid box was generated with dimensions centered at x = −9.410; y = −12.998; and z = 6.073, and a size of x = 58; y = 96; and z = 48, with a spacing of 0.375 Å. To validate the docking process, the standard ligand was also redocked into the active site of TLR1/TLR2. The conformation with the lowest binding energy was selected as the most suitable. The docking results were then visualized using a Discovery Studio Visualizer.
2.4.3. Molecular dynamics simulation
Molecular dynamics simulations were performed using AMBER25 software with the pmemd.cuda module to utilize GPU acceleration (Case et al., 2023; Salomon-Ferrer et al., 2013). System preparation begins with initial protein structure processing using the LEaP program, for which the topology and initial coordinates are prepared using the ff19SB force field for the protein representation and the TIP3P solvent model for water (Tian et al., 2020). Ionization was performed to balance the charge of the system, and the system was solvated in an orthorhombic box of water with a boundary of at least 10 Å from the protein edge. The minimization protocol consists of three stages: The first stage minimizes water molecules and ions for 15,000 steps (5000 steepest descent steps followed by 10,000 conjugate gradient). The second stage minimizes the entire system for 15,000 steps, with protein binding of 10 kcal/mol-Å2. The third stage is a restraint-free minimization for 15,000 steps, which allows the system to reach a more stable minimum energy state.
After minimization, the system is gradually heated, where the temperature is increased from 0 K to 300 K for 30 ps using Langevin temperature control (collision frequency 2.0 ps−1) in the NVT ensemble. The pressure has not been controlled at this stage, and bonding involving hydrogen atoms is restricted using the SHAKE algorithm. Next, the system was equilibrated in five NPT stages. The first stage simulated for 100 ps at 300 K and 1 atm pressure with 10 kcal/mol-Å2 binding to the protein. Subsequent stages gradually decreased the binding strength to the protein (1, 0.1, and 0 kcal/mol-Å2, respectively) and extended the simulation duration to ensure thermodynamic stability of the system. All stages used a Berendsen barostat to maintain a pressure of 1 atm and a cutoff of 10 Å for noncovalent interactions.
Production simulations were performed using the md.mdin file by running simulations for 100 ns in the NPT ensemble. Temperature was kept constant at 300 K with a Langevin thermostat (collision frequency 2.0 ps−1), while pressure was controlled at 1 atm using the Berendsen isotropic method. A time step of 2 fs was used with bond freezing to hydrogen using SHAKE. Coordinate data is stored every 10,000 steps, and energy and temperature information are stored every 10,000 steps. This simulation allows observation of the structural dynamics of the system under physiological conditions in a realistic manner.
2.4.4. ADMET Studies
The SMILES notations of the compounds 1 and 2 were submitted to SwissADME (http://www.swissadme.ch/) and pkCSM (https://biosig.lab.uq.edu.au/pkcsm/) online servers to predict their physicochemical, drug-likeness properties, pharmacokinetics, and toxicities.
3. RESULTS AND DISCUSSION
3.1. Result
3.1.1. Purification of austinol (1) and dehydroaustinol (2)
The molecular formula of compound 1 was established as C25H30O8 by positive HRESIMS data. A broad absorption (3510 cm−1) and strong absorption (1750 cm−1) indicated the presence of a hydroxyl and ester moiety in compound 1. The NMR spectra showed six methyls (δH 1.27, 1.63 s, 1.44 s, 1.39 s, 1.57 s, 1.13 d; δC 23.6, 13.9, 22.7, 25.8, 20.7, 11.7), an oxymethine (δH 4.58, δC 73.5), an exomethylene (δH 5.60, 5.16, δC 115.8), two sp2 methine (δH 6.75, 5.98, δC 147.8, 118.2), three quaternary sp2 carbons (δC 135.5, 138.3, 137.7), five quaternary sp3 carbons (δC 85.6, 45.8, 85.2, 80.5, 62.8), one sp3 methines, two sp3 methylenes, and two carbonyl groups (Table 1). After a reference search, the compound 1 was found to have the exact structure as reported for austinol (Bai et al., 2021; He et al., 2024; Park et al., 2018).
Compound 2 was found to have a molecular formula of C25H28O8 by positive HRESIMS data. The presence of hydroxyl and ester groups was confirmed by characteristic broad (3510 cm−1) and strong (1750 cm−1) absorptions in the FTIR spectra, respectively. The NMR data of compound 2 (Table 1) closely resembled those of compound 1 except for the lack of one methyl at δH 1.63 (Me-13), likely due to the double bond migration to Me-13 in compound 1, suggesting compound 2 as dehydroaustinol, an oxidation product of 1.
4.1 Discussion
4.1.1. Construction of the expression system
To facilitate the expression of all aus genes, they were cloned into fungal expression vectors: pTAex3 for AusA and pUSA for AusN. The complete AusA gene was amplified using the EcoRI-AusA-F and EcoRI-AusA-R primers under the following PCR conditions: an initial denaturation at 98 °C for 30 s, followed by 30 cycles of 98 °C for 10 s, 63 °C for 15 s, and 72 °C for 1 min, concluding with a final extension at 72 °C for 5 min. The amplified PCR product was purified, digested with EcoRI, and subcloned into the EcoRI-digested and dephosphorylated pTAex3 vector, yielding pTA-AusA.
Similarly, the full-length AusN gene, along with segments of AusM, AusB, AusJ, AusK, AusH, AusI, and AusG, was amplified using their respective primer sets under identical PCR conditions. The resulting PCR product was purified, digested with KpnI, and subcloned into the KpnI-digested and dephosphorylated pUSA vector, generating pUSA-AusN.
4.1.2. Biosynthesis gene clusters of 1-2
In this study, we investigated the biosynthetic potential of the A. nidulans strain LMI2022 (Moser & Pichler, 2019). Expression of the AusA gene in this strain resulted in the production of compound 1. To test the hypothesis that AusN functions as an oxygenase, we introduced AusN into the A. nidulans strain already expressing AusA. This coexpression led to the production of compound 2 in addition to 1, strongly suggesting that AusN encodes an enzyme responsible for catalyzing an oxidation reaction (Medema et al., 2015).
Further analysis of the putative biosynthetic pathway for compounds 1 and 2 suggests that multiple enzymes work in concert to facilitate their biosynthesis. The pathway is initiated by polyketide synthase (AusA), which catalyzes the formation of the polyketide scaffold. A suite of specialized enzymes mediates subsequent modifications. Farnesyltransferase (AusN) catalyzes the addition of farnesyl groups, while methyltransferase (AusD) introduces methyl groups. Flavin-dependent monooxygenase (AusM) facilitates oxidation reactions, and terpene cyclase (AusL) mediates terpene cyclization (Lo et al., 2012; Matsuda et al., 2013). Two hypothetical proteins (AusJ and AusH) are proposed to play essential roles in the pathway, although their precise functions remain to be elucidated. Additionally, ketoreductase (AusK) reduces ketone groups, and two P450 monooxygenases (AusI and AusG) introduce oxygen atoms into organic substrates (Figure 2).
Figure 2
(A) Schematic representation of the polyketide synthase gene cluster involved in austinol/dehydroaustinol biosynthesis in Aspergillus nidulans. Each arrow denotes the relative size and transcriptional orientation of the ORFs, inferred from nucleotide sequence analysis. (B) The putative biosynthesis gene clusters of compounds 1 and 2. (C) HPLC profile of strain extracts from the gene cluster, detected by UV absorption at 254 nm. (D) Evidence of double bond migration in the production of compound 2, attributed to the presence of AusB as a cytochrome P450 monooxygenase.
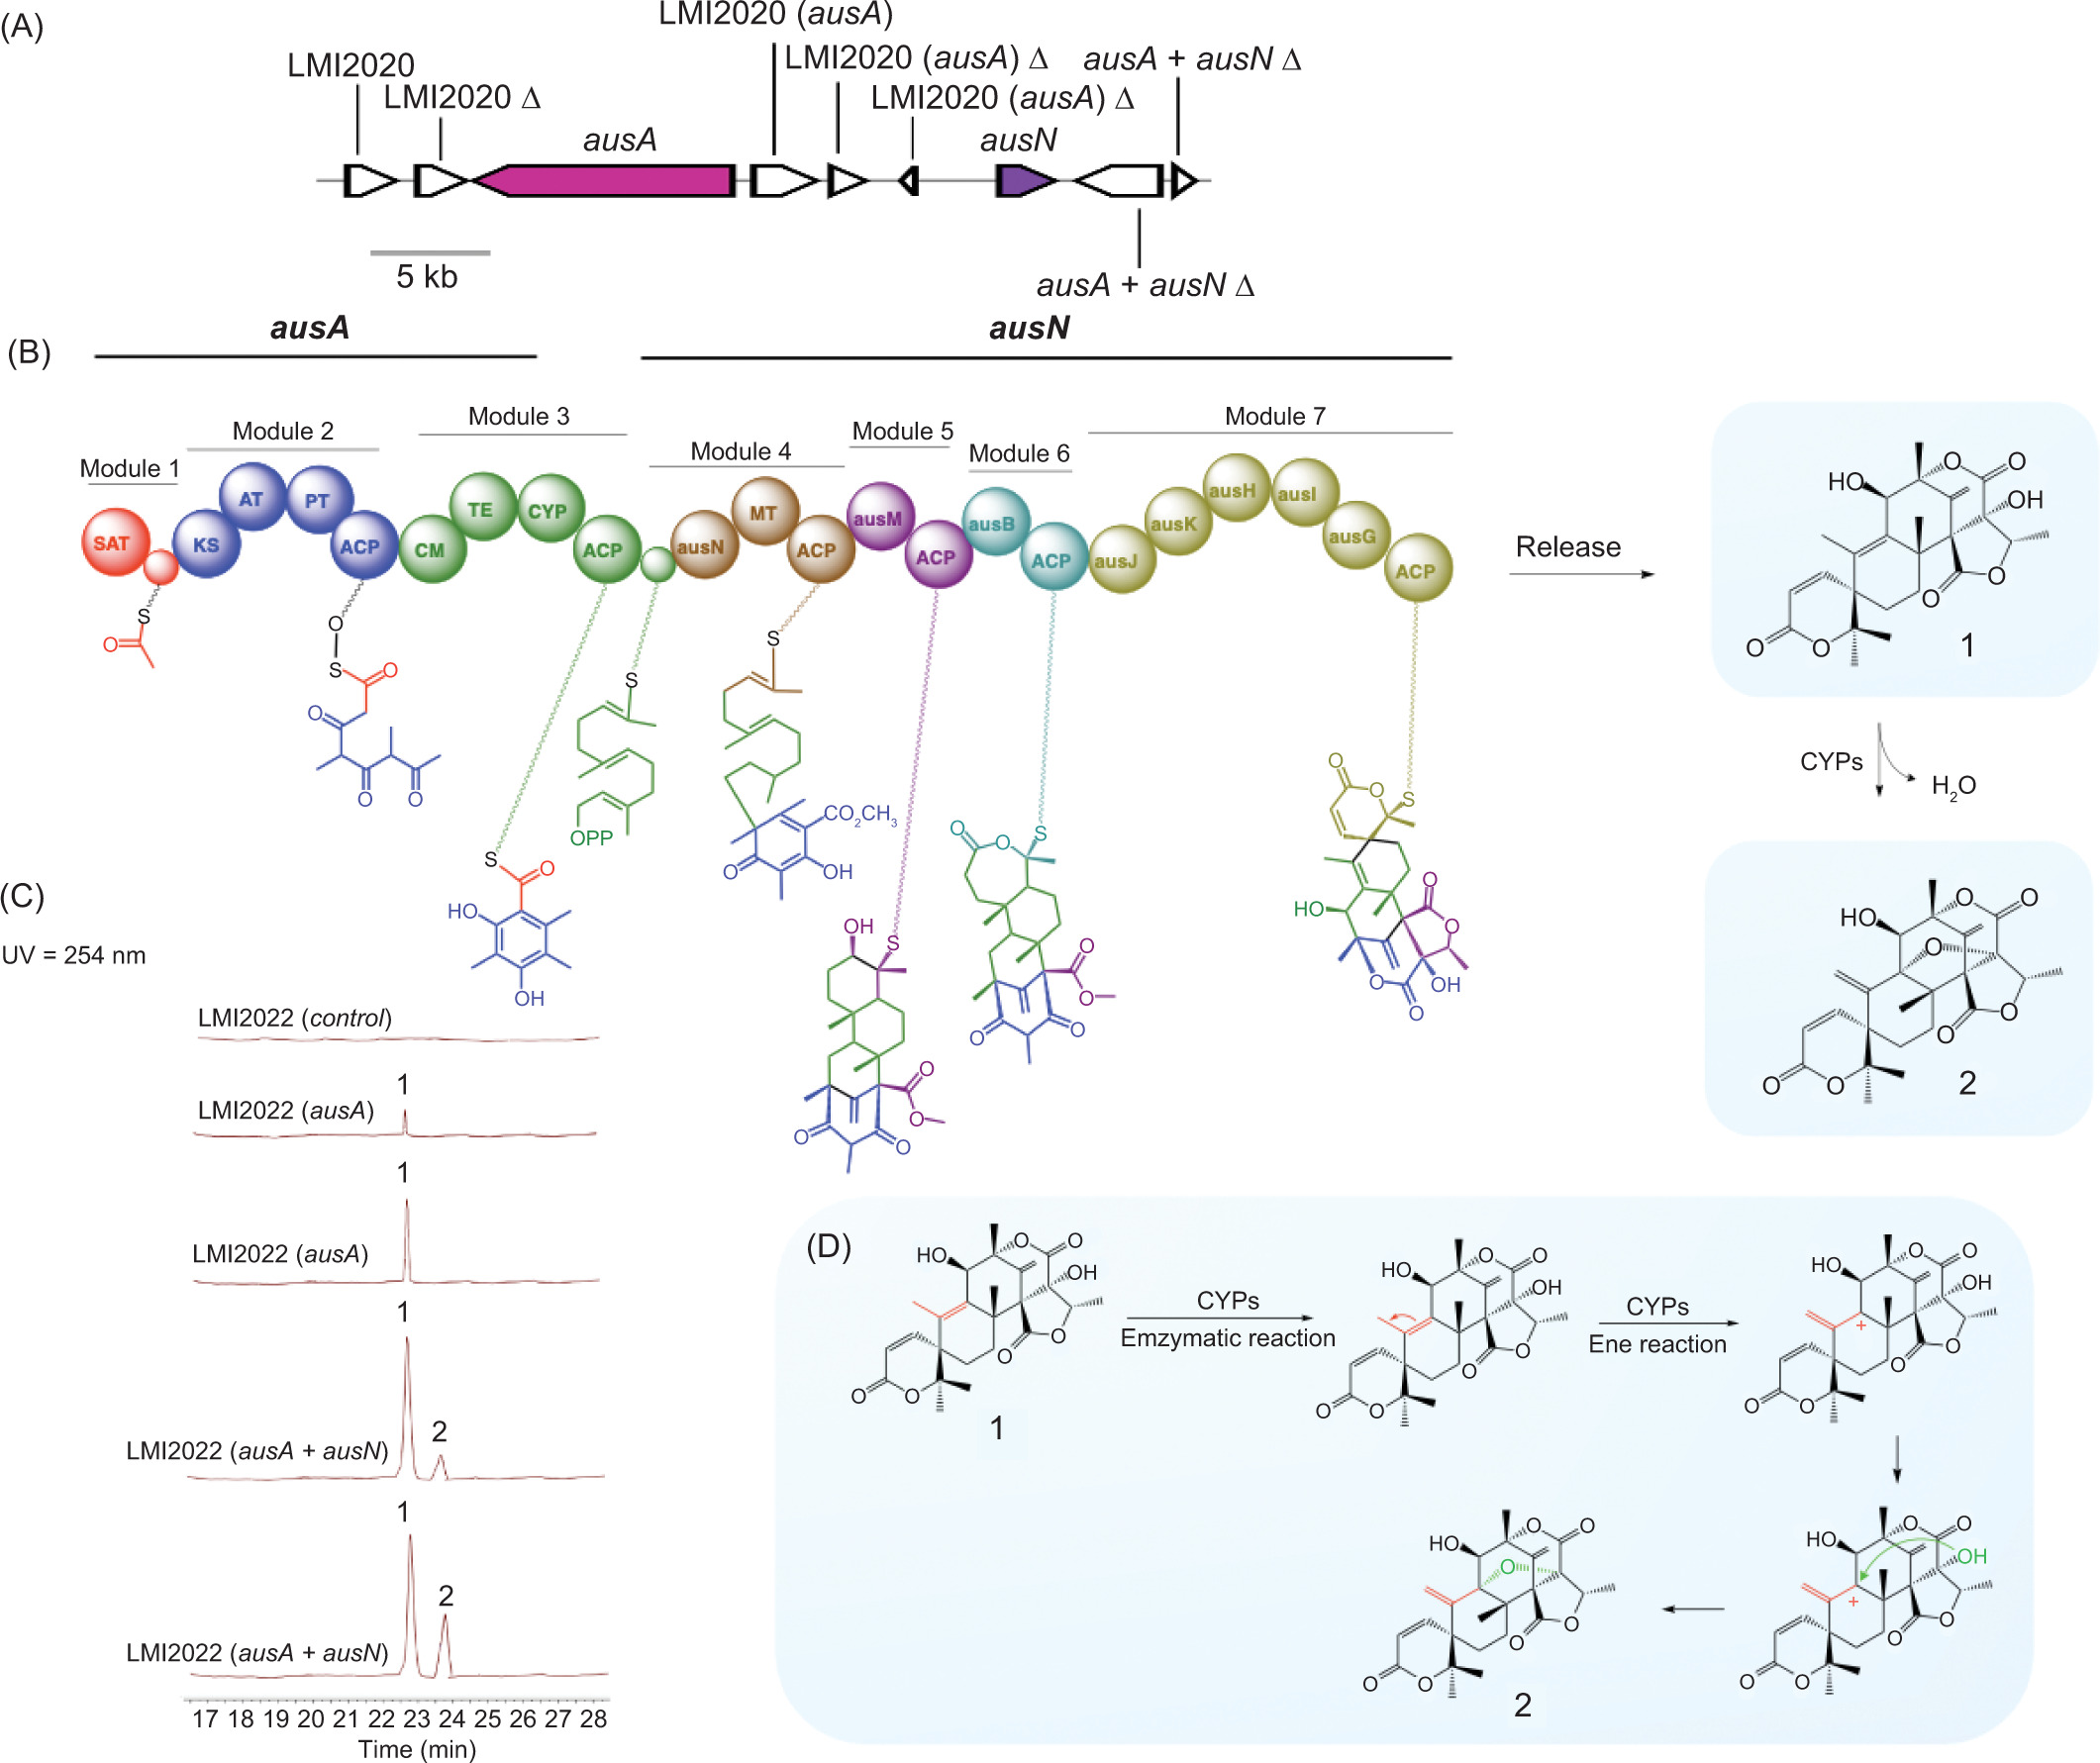
A critical transformation in this pathway is the Baeyer−Villiger oxidation, catalyzed by the P450 monooxygenase AusB. This enzyme facilitates the insertion of an oxygen atom—likely derived from molecular oxygen—into a ketone-containing intermediate, ultimately yielding an ester or lactone structure in 2. This oxidation step is particularly significant, as it introduces a key oxygenated functional group that is essential for downstream modifications, leading to the final biosynthetic product (Busch et al., 2023).
In the proposed biosynthetic pathway, AusA encodes a polyketide synthase (PKS) responsible for synthesizing 3,5-dimethylorsellinic acid, the core polyketide precursor. The domain architecture of AusA includes SAT, KS, AT, PT, ACP, CM, and TE domains, while the absence of ER, DH, and KR domains classifies it as a nonreducing polyketide synthase (NRPKS). This NRPKS likely utilizes one acetyl-CoA, three malonyl-CoA, and two S-adenosyl methionine (SAM) molecules to generate 2.
To validate these findings, we conducted comprehensive structural analyses of the biosynthetic products, with a particular focus on 1H and 13C NMR spectroscopy. The NMR spectra of 2 exhibited distinct chemical shifts and splitting patterns compared to 1, consistent with the incorporation of an additional oxygen atom. These spectral data allowed us to definitively identify 2 as dehydroaustinol, an oxidized derivative of 1. The identification of dehydroaustinol as the oxidation product not only highlights the enzymatic function of AusB as an oxygenase but also provides mechanistic insights into the biochemical transformations involved in this pathway.
This study exemplifies the intricate enzyme-mediated cooperation underlying fungal secondary metabolite biosynthesis. Furthermore, our findings contribute to a broader understanding of fungal metabolic pathways, shedding light on the complex enzymatic networks that drive the structural diversification of natural products. The potential to genetically engineer these pathways holds significant promise for the discovery and production of novel bioactive compounds with pharmaceutical and biotechnological applications (Mei et al., 2022).
An intriguing aspect of the austinol/dehydroaustinol biosynthetic pathway in A. nidulans is the organization of the relevant genes into two distinct biosynthetic gene clusters (BGCs). In fungi, genes encoding enzymes involved in the biosynthesis of a specific secondary metabolite are often physically clustered, a genomic arrangement reminiscent of operon-like structures in prokaryotes (Marcet-Houben & Gabaldón, 2010). While it has been widely accepted that secondary metabolite biosynthetic genes in plants are typically scattered throughout the genome, emerging evidence suggests that, in certain plant species, these genes may also be organized into clusters (Galagan et al., 2005).
4.1.3. Molecular docking
Toll-like receptor 2 (TLR2) is a key component of the innate immune system, playing a pivotal role in recognizing pathogen-associated molecular patterns (PAMPs) from a diverse range of microorganisms, including bacteria, fungi, and viruses. TLR2 is a membrane-bound receptor that forms heterodimers with either TLR1 or TLR6 to recognize distinct microbial ligands, such as lipoproteins, peptidoglycan, and lipoteichoic acids. TLR2 dimerization with TLR1 is necessary to initiate and mediate intracellular signaling during different innate immune responses in mammals (Septiana et al., 2021; Mansouri et al., 2024). Upon ligand binding, TLR2 triggers a signaling cascade mediated by adaptor proteins such as MyD88 and TIRAP, leading to the activation of transcription factors NF-κB and AP-1. This activation induces the production of pro-inflammatory cytokines, chemokines, and type I interferons, orchestrating a robust immune response. Given its central role in pathogen recognition and inflammation, TLR2 has been identified as a significant therapeutic target in infectious diseases, autoimmune disorders, and inflammatory conditions. Recent studies have highlighted TLR2 as a potential target for the treatment of diseases such as mycobacterial infections, cancer, diabetes, kidney inflammation, tissue injuries, and COVID-19 (Yuan et al., 2023; Hu & Spaink, 2022; Su et al., 2019).
To gain deeper insights into the interaction between TLR2 and the investigated compounds (1 and 2), a molecular docking simulation was conducted. Before this, the validity of the docking procedure was assessed by evaluating the Root Mean Square Deviation (RMSD) obtained from redocking. The RMSD value was 1.16 Å, confirming the reliability of the docking results. The docking analysis revealed significant binding affinities of –7.26 and −7.70 kcal/mol for 1 and 2, respectively, within the TLR1/2 binding pocket.
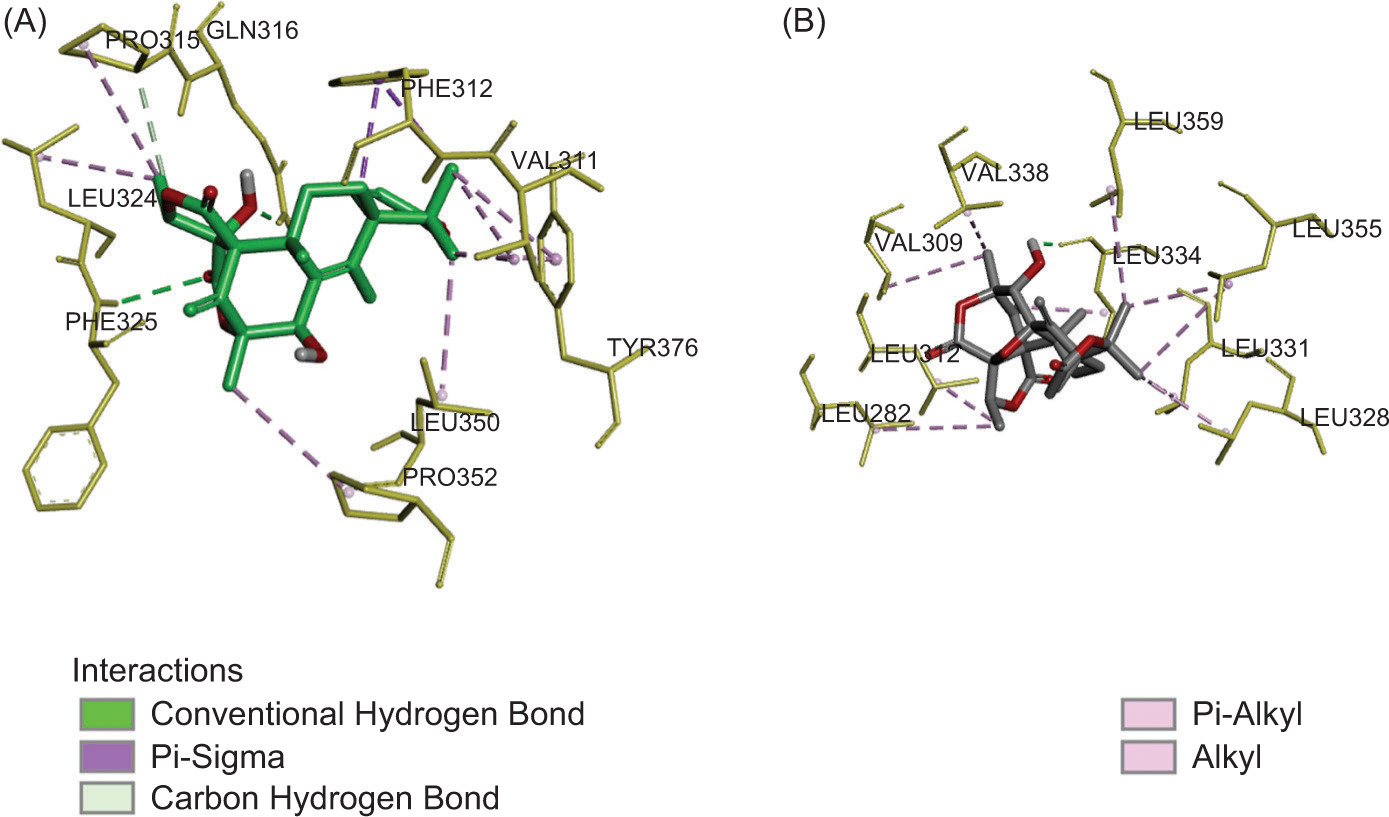
Compound 1 formed two conventional hydrogen bonds between the carbonyl and oxygen atom on the hydroxyl group of austinol with Phe325 and Gln316 residues. Those hydrogen bonds were considered crucial because interaction with this residue was observed in the Pam3CSK4-TLR2/1 complex. The Gln316 substitution was shown to abrogate ligand stimulation, while the Phe325 residue was required for mediating cellular responses and strong nuclear factor-κB activation in TLR signaling (Balasubramanian et al., 2019; Durai et al., 2013). Additionally, Pro315 is involved in carbon-hydrogen bond. It also established one π−sigma with Phe312 and one π-alkyl interaction with Tyr376. Alkyl interactions were also observed with several residues, including Pro352, Leu324, Pro315, Leu350, and Val311, located at the active site of the TLR1/2 receptor (Figure 3A).
On the other hand, compound 2 established one conventional hydrogen bond between the hydroxyl group and Leu334 residue in the TLR2 (Kaur et al., 2020). Several residues, including Val338, Val309, Leu312, Leu282, Leu328, Leu331, Leu355, Leu359, and Leu334, contribute to alkyl interaction (Figure 3B). A previous study reported that hydrophobic interactions play a crucial role in the binding of lipopeptides to TLR1/2 for the stability of the receptor–ligand complex, as indicated by its lower binding affinity (Manavalan et al., 2011). Based on the results of the docking simulation, we can infer that meroterpenoids have a good affinity and interaction for the TLR1/2 receptors, showing good potential in the development of novel immunomodulatory agents.
4.1.4. Molecular dynamics simulation analysis
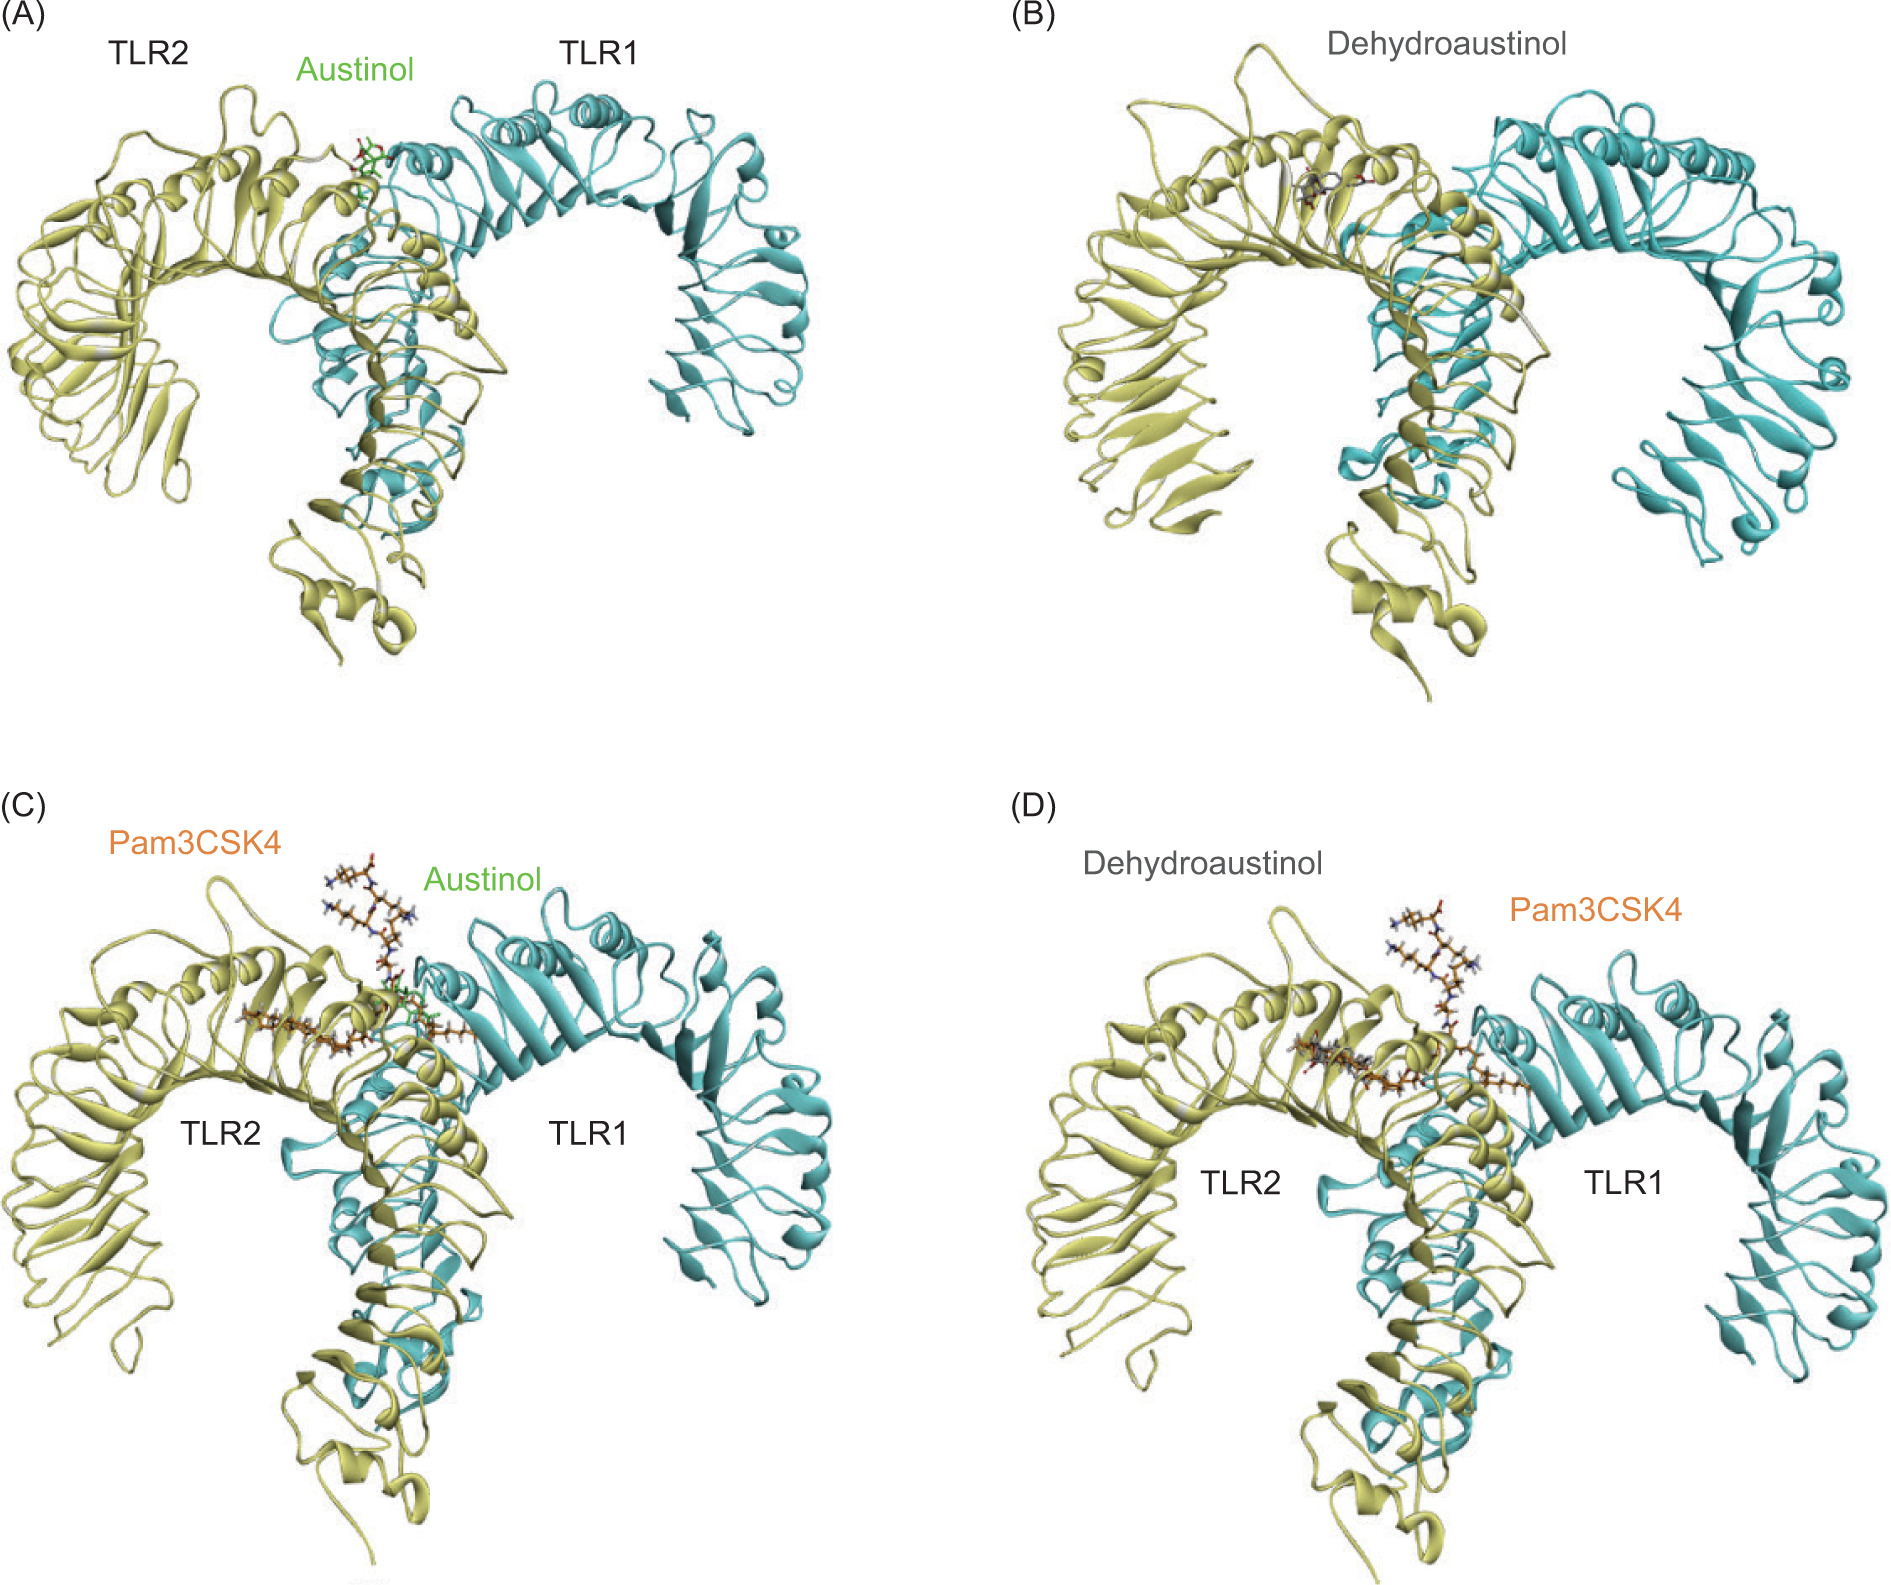
Root Mean Square Deviation (RMSD) analysis was used to evaluate the structural stability and dynamics of the protein–ligand complex during molecular dynamics simulations. In this study, simulations were performed for 100 ns using AMBER25 software (Case et al., 2023). The simulated system consists of two ligands, namely austinol and dehydroaustinol, which interact with the TLR2-TLR1 heterodimer protein with PDB ID 2Z7X (Figure 4). This protein is known to play an important role in pathogen recognition through the innate immune system pathway.
Figure 4
Structure of TLR1/2 heterodimer with (A) austinol and (B) dehydroaustinol; Comparison of (C) austinol, (D) dehydroaustinol, and Pam3CSK4 (orange) binding modes in TLR1/2.
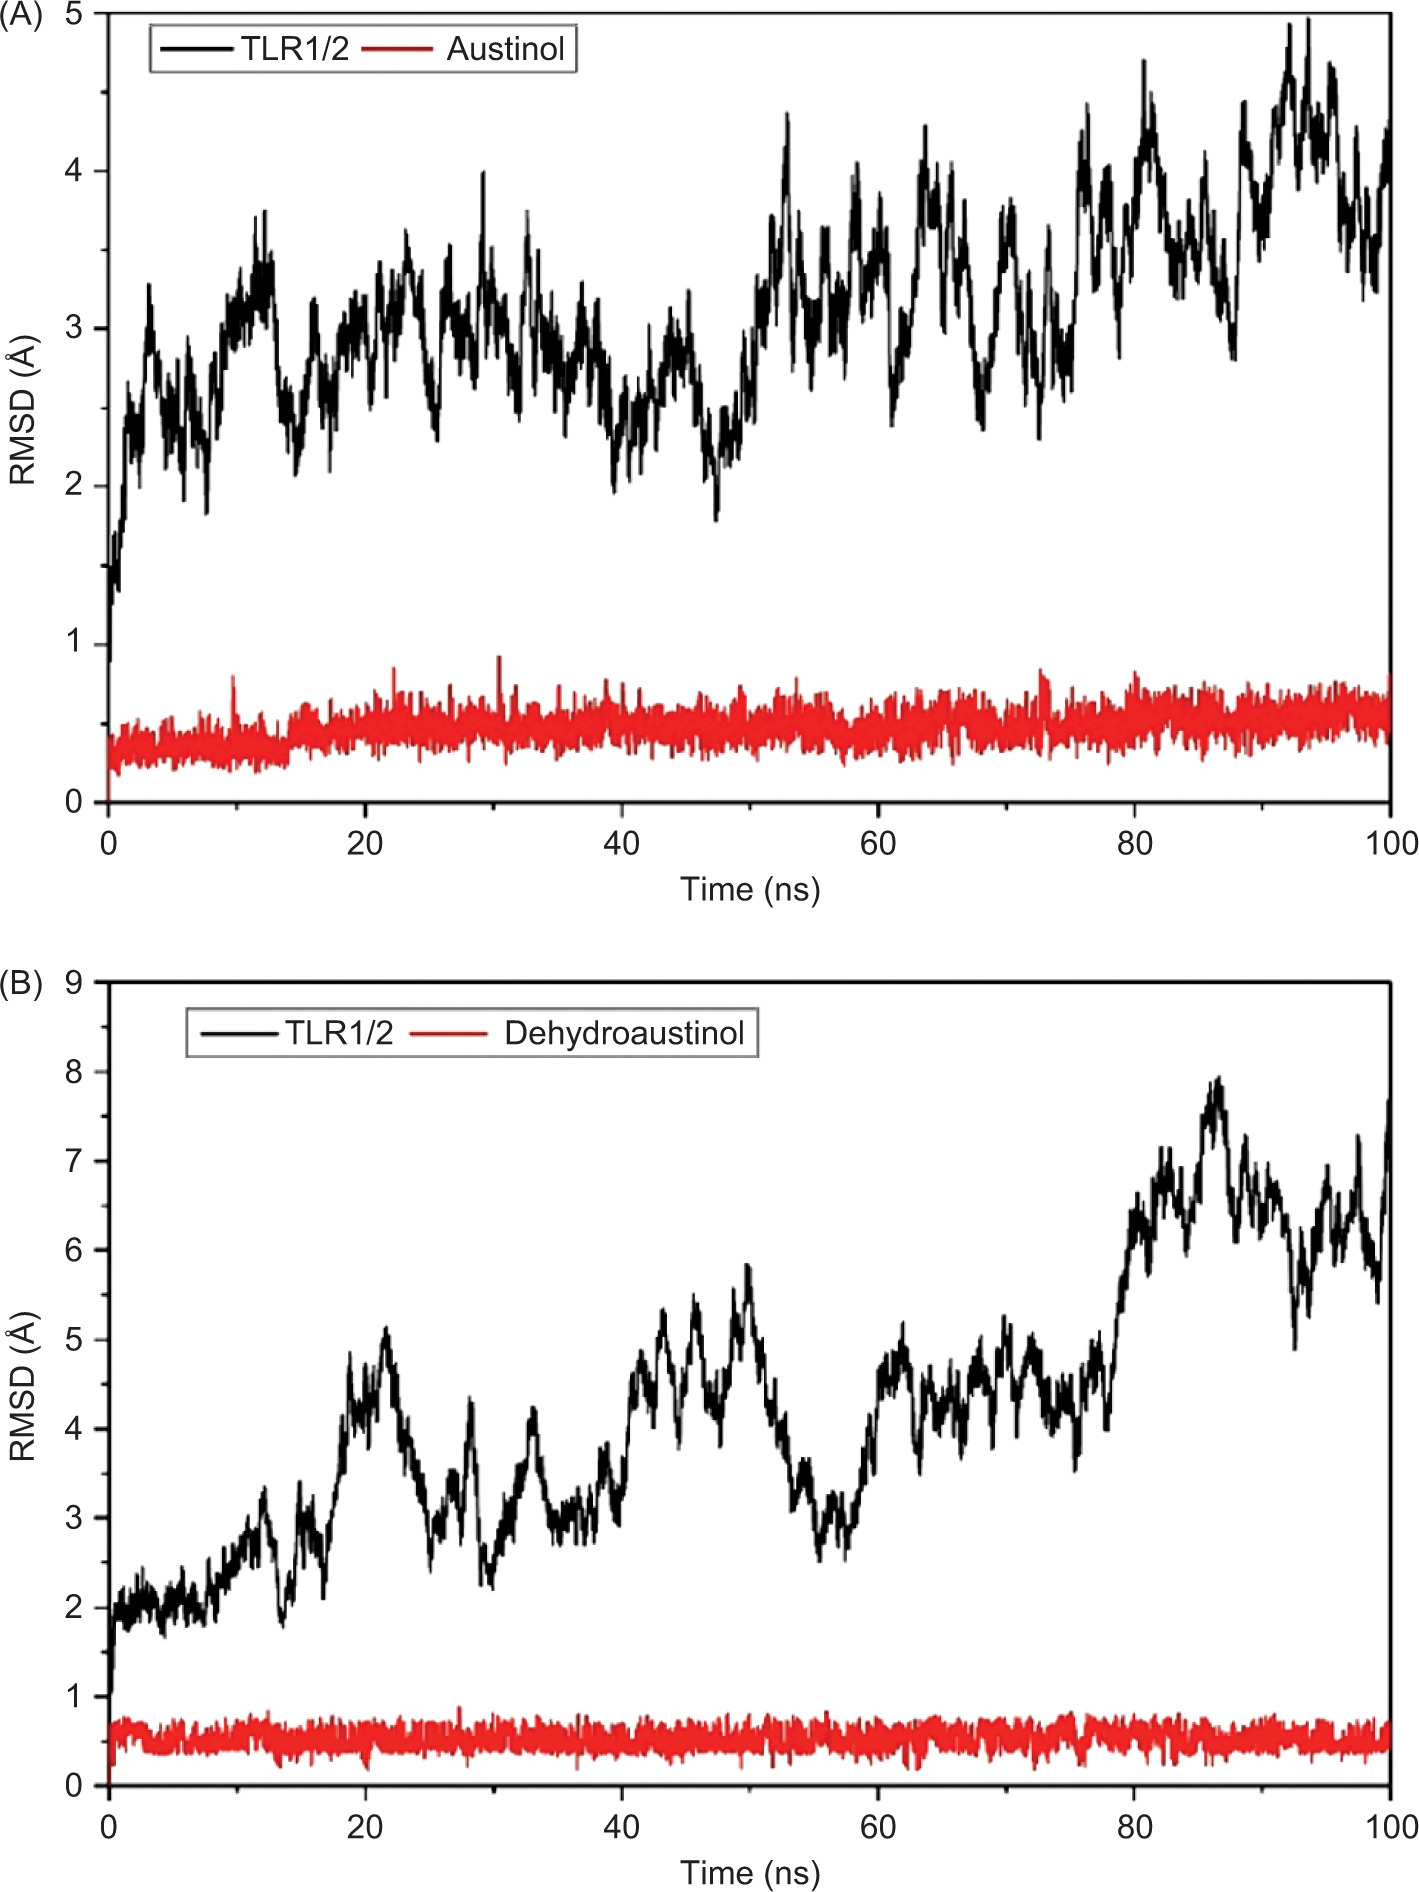
As a result, the RMSD analysis revealed the structural dynamics of the TLR2-TLR1 complex with austinol, as shown in Figure 5A. The black curve represents the RMSD of the heterodimer protein, while the red curve shows the RMSD of the austinol ligand. The results show that the protein experiences RMSD fluctuations in the range of 2–4.8 Å, with the fluctuations stabilizing after about 10 ns. This indicates that despite the slight conformational dynamics, the global structure of the protein remains relatively stable. Austinol, on the other hand, showed low and constant RMSD values below 1 Å throughout the simulation. This indicates that austinol remains strongly bound and stable to the TLR2-TLR1 active pocket throughout the simulation. In contrast, in Figure 5B, which shows the TLR2-TLR1 complex with dehydroaustinol, the RMSD of the protein shows larger fluctuations, reaching up to 7.8 Å at the end of the simulation. This suggests that the protein structure undergoes a more significant conformational change than the complex with austinol. Nonetheless, the RMSD of the dehydroaustinol ligand remains below 1 Å, indicating that this ligand also has a stable interaction with the binding site. The larger protein RMSD fluctuations may reflect the conformational influence of dehydroaustinol on the global structure of the protein or stronger allosteric interactions.
Compared to the previous studies, such as that conducted by Jin et al. (2007), TLR2-TLR1 heterodimers that bind to natural lipopeptides showed backbone RMSD stability below 4 Å during 100 ns of simulation. In this context, austinol exhibits a behavior consistent with natural agonist compounds, whereas dehydroaustinol gives rise to greater structural instability, although it retains high affinity to the active pocket. This difference suggests that austinol potentially has a better conformational fit and interaction with TLR2-TLR1, making it a more promising candidate for the development of TLR2 ligands or modulators.
4.1.5. ADMET analysis
The ADMET study is one of the most essential parts of computational drug design. This method is critical for the evaluation of the pharmacokinetic and toxicological properties of small molecules for further processing. Pharmacokinetic assessment of a drug is related to absorption, distribution, metabolism, elimination, and toxicity. This analysis helps predict the ability of the drug to be effectively absorbed and reach the target tissues (Belahcene et al., 2024; Flores-Holguin et al., 2021).
Inadequate ADMET profiles are the major problem and failure of drug molecules during the clinical trial stage. Therefore, the in silico approach can effectively reduce drug safety failure rate and improve efficacy prediction, thereby increasing the success rate of drug development (Fu & Chen, 2025). This study predicted the in silico ADMET characteristics of compounds 1 and 2 using the SwissADME and pkCSM servers, as shown in Tables 2 and 3.
Table 2
Drug-likeness prediction of compounds using SwissADME.
| Compound | Molecular weight (g/mol) | Log P | HBD | HBA |
|---|---|---|---|---|
| 1 | 458.40 | 2.76 | 2 | 8 |
| 2 | 456.49 | 2.71 | 1 | 8 |
| Criteria | ≤ 500 | ≤ 5 | ≤ 5 | ≤ 10 |
Table 3
Predicted properties ADMET in silico for compounds 1 and 2.
The physicochemical properties were calculated using the Swiss-ADME tool to predict the drug-likeness of the compounds based on Lipinski’s “rule of five.” The concept of drug-like rules is suggested by Lipinski (2004), known as the rule-of-five, which contains four simple physicochemical parameter definitions (MW ≤ 500, log P ≤ 5, H-bond donors ≤ 5, H-bond acceptors ≤ 10). This is important to predict whether a compound can become an oral drug candidate or not. Based on the obtained results in Table 2, compounds 1 and 2 comply with Lipinski’s rule of 5 for drug-likeness features and are considered orally active drugs (Lipinski, 2004).
The screening of pharmacokinetic properties such as absorption, distribution, metabolism, excretion, and toxicity parameters was evaluated using the pkCSM web. The analysis indicated that compounds 1 and 2 generally exhibited a favorable pharmacokinetic profile. The results of the ADMET properties prediction are presented in Table 3.
The absorption of the compounds was predicted via three properties: human intestinal absorption, Caco-2 permeability and skin permeability. Table 3 displays compounds 1 and 2 with human intestinal absorption above 30%, indicating that the compounds can be absorbed by the intestine and circulate in the bloodstream (Sindhu et al., 2022). As for the ability to cross cell membranes, represented by permeability in Caco-2 cells, compound 1 was classified as having a low permeability (log Papp in 10−6 cm s−1 < 1), while compound 2 was considered as moderately permeable (1 < log Papp in 10−6 cm s−1 < 10) (Dos Santos et al., 2024). All tested compounds have a skin permeability value of log Kp < –2.5,, which means that they have a good skin permeability.
The potential distribution of the tested compounds was assessed using the parameters of volume of distribution (VDss) and BBB permeability. The VDss determines whether the compound distributes more through the plasma (Log VDss < −0.15), or the tissues (Log VDss > 0.45). From the result of the distribution prediction, compounds 1 and 2 have a high distribution volume and are well distributed by tissues (Dos Santos et al., 2024). Regarding brain distribution, indicated by the ability to cross the blood–brain barrier, compounds 1 and 2 are predicted to be poorly distributed to the brain (Log BB < −1) (Sulistyowaty et al., 2021).
For metabolism parameters, the results show that compound 1 becomes an inhibitor of CYP2C9 and compound 2 becomes a CYP3A4 substrate. Drugs as inhibitors or substrates of cytochrome P450 involved in metabolism influence the potency and duration of many drugs and lead to various hazardous drug interactions (Cordeiro et al., 2022).
The excretion parameters showed that compound 2 has a low total clearance rate compared to compound 1. The greater the total clearance, the faster the drug is excreted by the body (Sulistyowaty et al., 2021). Toxicity prediction revealed that all compounds did not show toxicity to hepatotoxicity, skin sensitization, or Ames toxicity. Furthermore, the LD50 results of the compounds 1 and 2 are less than 3 mol/kg, indicating that the compounds seem to be suitably safe (Kawsar et al., 2021). Overall, the pharmacokinetic profiles of compounds 1 and 2 were fit for further investigations, with promising absorption, distribution, and bioavailability characteristics.
4.1.6. Experimental validation and future perspectives
While molecular docking provides valuable insights, experimental validation is essential to confirm the agonistic activity of austinol and dehydroaustinol on TLR2. Further research should include in vitro assays, such as cytokine production analysis and TLR2 reporter assays, to evaluate their immunostimulatory potential. In vivo studies using animal models will be necessary to determine their ability to modulate immune responses. Structural characterization using techniques such as X-ray crystallography or NMR spectroscopy is crucial for elucidating the precise binding mode of these compounds within TLR2.
The molecular docking and molecular dynamics results strongly suggest that austinol interacts with TLR2 in a biologically relevant manner, potentially mimicking Pam3CSK4 in activating immune responses. These findings underscore the therapeutic significance of these natural products and highlight their potential in the development of novel immunomodulatory agents. Further experimental investigations is essential to fully understand their pharmacological potential and possible applications in immunotherapy and infectious disease treatment.
CONCLUSION
This study elucidated the biosynthetic pathway of austinol and dehydroaustinol in the endosymbiotic marine fungus A. nidulans, isolated from the Indonesian marine sponge P. simplex. Spectroscopic analysis confirmed the presence of austinol (1) and dehydroaustinol (2), both belonging to the meroterpenoid class. The biosynthesis involves distinct gene clusters for polyketide synthases and terpenoid cyclases, along with a series of enzymatic reactions, including oxidation facilitated by Aus genes. In silico investigation indicated that austinol interacts with Toll-like receptor 2 (TLR2), potentially acting as agonists, which underscores their potential therapeutic applications. Additionally, ADME prediction studies showed that 1 and 2 had good pharmacokinetic properties. These findings enhance the understanding of fungal metabolic pathways and their potential in biotechnological and pharmaceutical applications.