

1. INTRODUCTION
Iron plays a critical role in numerous metabolic processes, including oxygen transport, deoxyribonucleic acid (DNA) synthesis, and energy production; essential for maintaining cardiovascular health, erythrocyte production, immune function, brain development, and cognitive performance; and indispensable for erythropoiesis, enzymatic functions, and mitochondrial energy utilization (Abbaspour et al., 2014; Funk et al., 2022). Iron deficiency, marked by depleted iron stores and iron overload which can lead to cytotoxicity, underscores the necessity of maintaining precise iron homeostasis. Advanced regulatory mechanisms are therefore crucial for balancing iron levels and preventing toxicity. For nearly three centuries, iron has been used to treat anemia, primarily through oral supplementation. While oral iron therapy is cost-effective and widely used, it is often limited by gastrointestinal side effects and the prolonged treatment required to effectively restore iron levels (Silverstein et al., 2004). Early attempts at intravenous iron administration revealed significant risks, particularly with unprotected inorganic ferric iron formulations, such as colloidal ferric hydroxide, which could cause severe adverse effects. These challenges highlighted the need for safer, more advanced iron formulations that ensured controlled release and minimized oxidative stress. To address these concerns, iron-carbohydrate complexes that stabilize colloidal ferric hydroxide particles through carbohydrate chelation were developed, significantly improving the safety of parenteral iron administration (Geisser and Burckhardt, 2011). Intravenous iron complexes are absorbed by macrophages in the reticuloendothelial system (RES), including in the bone marrow, spleen, and liver, enabling efficient iron distribution and utilization (Zou et al., 2017). These complexes consist of a Fe(III) oxyhydroxide core surrounded by a carbohydrate shell composed of polymers such as sucrose, dextran, gluconate, or carboxymaltose, forming spheroidal nanoparticles typically ranging from 8 nm to 30 nm in size (Mühlebach and Flühmann, 2015). The carbohydrate shell prevents aggregation and maintains colloidal stability, ensuring prolonged solubility and bioavailability. Modern intravenous iron formulations are designed to deliver high iron concentrations rapidly while at the same time making sure that it is safe, nontoxic, and stable. The structural arrangement of carbohydrate polymers in iron-carbohydrate complexes is crucial for their functionality, preventing iron colloid aggregation and precipitation. This stability ensures effective delivery and controlled iron release, avoiding rapid release into the bloodstream which could cause toxicity. Unlike the fast-releasing iron formulations that runs the risk of adverse effects or anaphylaxis, iron-carbohydrate complexes balance safety and efficacy. Regulatory agencies like the EU’s European Medicines Agency (EMA) and US Food and Drug Administration (FDA) classify them as nonbiological complex drugs (NBCDs) due to their interdependent structures, where the entire complex acts as the active pharmaceutical ingredient (Danielson, 2004). Functioning as prodrugs, these complexes undergo metabolic transformation to release iron in a regulated manner, aligning with natural iron regulation mechanisms involving transferrin and ferritin. These properties make intravenous iron-carbohydrate complexes a safer, more effective option for treating iron deficiency anemia (IDA).
The physicochemical properties of iron colloids, such as molecular weight (Mp) distribution, particle size, iron colloid stability, and free/labile iron content, significantly impact their safety, efficacy, iron release kinetics, and tissue distribution. Iron core morphology and size influence macrophage uptake and tissue penetration, whereas core stability, iron release, and toxicity depend on factors like iron valence, spin state, coordination, and ligand binding. The carbohydrate shell and its interaction with the iron core further affect colloid stability and biodistribution. Thus, the quality of iron complexes depends on the iron core, carbohydrate shell, and their combined properties, necessitating comprehensive evaluation. Iron sucrose (IS), a widely used iron complex, has numerous global variants with potentially nonequivalent properties. This study focuses on physicochemical techniques to compare IS formulations and establish quality tests for batch release, with findings applicable to other iron-based drugs.
IS contains polynuclear iron(III) hydroxide as an iron core and sucrose as a ligand that covers the inner core of iron to form iron saccharate. The suggested basic formula—Na2Fe5O8(OH) ·3(H2O) n ·m(C12H22O11)—has an average Mw of 34,000–60,000 Da where the number of sucrose molecules associated with iron(III) hydroxide is denoted by “m” and the degree of iron polymerization by “n” (Venofer® [iron sucrose injection]_Labeling).
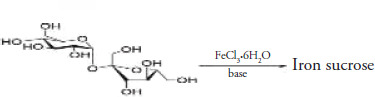
Preparing an iron-sucrose complex involves reacting ferric chloride with sodium hydroxide to obtain ferric hydroxide, which reacts with sucrose in an aqueous reaction at a selected molar ratio, time, temperature, and pH (potential of hydrogen). The obtained product was isolated as iron(III) hydroxide sucrose, a hygroscopic dark reddish powder easily soluble in water and an active ingredient (Kumar Abvderrcmsprgcsvksmas).
General synthetic route representation of iron sucrose.
IS is a sterile, nonpyrogenic solution composed of ferric hydroxide and sucrose dissolved in water for injection. It is a dark, viscous liquid with a pH ranging from 10.5 to 11.0 and an osmolarity between 1150 and 1350 mOsmol/L. To adjust the pH, sodium hydroxide was added. There were no antibacterial agents, chelating agents, dextrans, gluconates, or any other compounds. The solution had a concentration of 20 mg of elemental iron per milliliter of the drug product, roughly equivalent to 30% sucrose w/v (weight in volume) (300 mg/mL) (Monographs USP [Iron Sucrose Injection]). IS quickly dissociates into iron and sucrose via the RES and mostly taken up by transferrin to target cells, including erythroid precursor cells and other proteins, whereas reticuloendothelial macrophages endocytose the iron core (Danielson, 2004; Shah et al., 2014; Venofer® [iron sucrose injection]_Labeling). The iron present in the precursor cells is assimilated into hemoglobin as the cells undergo maturation and transform into red blood cells.
2. MATERIALS AND METHODS
2.1. Materials
Sodium thiosulfate pentahydrate from FINAR; deferoxamine mesylate and iron(III) chloride hexahydrate from Sigma Aldrich; potassium dichromate from Certipur®; hydrochloric acid, calcium chloride, potassium iodide, sodium chloride, tris buffer, methanol, acetonitrile, sodium chloride, and potassium bromide from Merck; 50% NaOH solution (sodium hydroxide solution) from Lobachem; and the Pullulan kit (P-82) from Shodex were procured. The following IV iron preparations with IS were purchased from a pharmacy or directly from the supplier: Orofer® from Emcure, Irorich from Lupin, Biofer-S from Microlabs, and Imax-S from ARISTO from India. Because four lots were utilized, the lot numbers were listed individually for each technique.
2.2. Methods
2.2.1. Total iron determination
Redox iodometry by potentiometric determination with Metrohm Auto titrator instrument (2.095.0010), a validated method, was used to estimate the total iron content (Kamisetty et al. 2023) in the ISSs. This method overcomes the limitations of other techniques such as atomic absorption spectrometry (AAS) (Monographs USP [Iron Dextran Injection]; Monographs USP [Iron Sucrose Injection]; Tabasi et al., 2021), inductively coupled plasma mass spectrometry (ICP-MS) (Brandis et al., 2021; Matta et al., 2018; Sun et al., 2018), polarography (Barot et al., 2014; Merli et al., 2012), and colorimetric methods (Abbasi et al., 2021; Geisser et al., 1992; Gupta et al., 2016; Qi et al., 2011; Pharmacopoeia B).
2.2.2. Carbohydrate content
Carbohydrate content was determined on the ISSs using ion chromatography (IC) with optimized conditions. A 10 μL sample was separated on a Carbopac PA1 column (4 mm × 250 mm) and guard column (4 mm × 50 mm) with a 100 mM NaOH mobile phase in a 15-minute run. The Thermo Scientific Dionex ICS 5000+ system, equipped with Chromeleon software 7, was used with high-performance anion exchange chromatography and pulsed amperometric detection. The flow rate was 1 mL/minute with the detector, column, and autosampler set at 30°C, 25°C, and 25°C, respectively. Standard sucrose and sample solutions were analyzed using a gold working electrode and an Ag/AgCl (silver/silver chloride) reference electrode.
2.2.3. Dynamic light scattering
Diluted ISS hydrodynamic diameters were measured using a Zetasizer ZSP (Malvern Instruments, Worcestershire, UK) and analyzed with Zetasizer software 7.11 (Brandis et al., 2021). Measurements were based on Brownian motion and performed in a single-use cuvette. Backscattering data were collected at 173° using a 633 nm He-Ne laser. Refractive index and viscosity were set to 1.330 and 0.8872 cP (centipoise), respectively. The optimum position was determined with a 120-second equilibration time at 25.0°C. Results were averaged from three subruns each with ≥ 12 measurements and interpreted using intensity-based Z-average. System suitability was verified before each experiment using a 60 nm (± 3 nm) polystyrene nanosphere standard.
2.2.4. Size exclusion chromatography
The Mp of ISSs complexes were analyzed using size exclusion chromatography (SEC) adapted from the USP (United States pharmacopeia) IS monograph with modifications. Samples (25 μL) were separated on two Shodex columns (300 × 7.8 mm, 13 μm particle size) composed of hydrophilic polyhydroxymethacrylate gel particles connected in series. A pullulan polysaccharide standard kit (5000–800,000 Da) was used for calibration. Standards (1 mg/mL) and samples (5 mg/mL) were prepared in ultrapure water. The analysis was performed on a Waters Alliance HPLC (high-performance liquid chromatography) system with a refractive index detector, column, and autosampler set at 45°C, 45°C and 25°C, respectively, using Empower 3.6.1.1 software at a flow rate of 0.5 mL/minute. A calibration curve was constructed by plotting retention times against peak top Mp with a correlation coefficient ≥ 0.98. Mp of ISS complexes were determined by comparing their retention times to the calibration curve.
2.2.5. Reduction kinetics
Kinetic analysis of the reduction method was proposed by Shah (Mandal SSPDDKSVPK, 2018). The ISSs were analyzed by colorimetric determination using a SpectraMax® i3x Multi-Mode Microplate reader (Molecular Devices, Silicon Valley, CA, USA) at 450 nm with SoftMax Pro7.0.3 GxP. The kinetics of IS were measured for 80 minutes and the data points were collected at intervals of 5 minutes. The adopted method met the following criteria: a T75 reduction time. The reduction kinetics data points were plotted for “log (percentage of trivalent iron concentration) versus time” (Mandal SSPDDKSVPK, 2010; Mary Jane Helenek RAL, 2013).
2.2.6. Chelatable iron determination
The validated analytical method was adopted from Tesoro et al. (2005) and Pai et al. (2017, 2018). Thechromatographic conditions were modified to improve the resolution of the intact complex with the chelated iron-deferoxamine (Fe-DFO) complex, feroxamine (FO), and the DFO. Each 20 μL sample was subjected to chromatographic separation using a C8 column composed of dimethyl-n-octyl silane with Rx-SIL (small diameter porous silica particle) bonding, 150 mm × 4.6 mm dimensions and a 3.5 μm particle size. The experiment was conducted with solvent A (Tris-HCl [tris{hydroxymethyl}aminomethane hydrochloride]) and solvent B (methanol) as the mobile phase using a gradient of 0–10 minutes (75% A), 15–20 minutes (25% A), and 21–30 minutes (75% A) at a 0.5 mL/minute flow rate on a Waters Alliance HPLC system with a photodiode array detector set at 430 nm and column and autosampler set at 30°C and 25°C with a run time of 30 minutes using Empower 3.6.1.1 software.
2.2.7. X-ray diffraction
X-ray diffraction (XRD) measurements were conducted on ISSs using a Bruker D8 Advance powder X-ray diffractometer with Cu Kα (copper K-alpha) radiation (1.54060 Å [Angstrom]) and a LYNXEYE XE-T detector. Liquid samples were dried for three hours to prevent breakage of the material. The diffractometer was calibrated using a corundum standard sample and data analysis was performed using DIFFRAC.EVA Version 4.3.1.2 and the Bruker TOPAS software. The parameters for the slow-scan measurements were primary soller slit 2.5°; air scatter automatic, divergence slit 0.3°; antiscatter slit 8 mm; secondary soller slit 2.5°; 2° range 5–90°; step size 0.03°; time/step 2.5 seconds; and measurement time 2 hours. The GOF (goodness of fit) parameter was used to assess the pact between the model and data, with a GOF of 1.0 indicating a perfect fit.
2.2.8. Transmission electron microscopy
ISSs complex nanoparticle size and morphology were examined at ambient temperature using a JEOL JEM F200 transmission electron microscope. Diluted samples of Milli-Q water were dried with nitrogen using a Lacey C Film 400 copper mesh grid. Electron micrographs were captured with bright and dark fields at the exact locations where SAED (Selected Area Electron Diffraction) patterns were recorded. The samples were analyzed using the EMSIS software where the geometrical mean particle diameter (dg) was determined.
2.2.9. UV-visible absorption spectroscopy
ISS samples absorbance was measured in the range of 800–200 nm wavelength to collect spectral data. The absorption spectra were measured using a Perkin-Elmer Lambda 800 UV/VIS spectrophotometer with UV Win Lab 3.00.03. Milli-Q water was used as a blank and the path length was measured to be 1 cm. The molar extinction coefficients were calculated by measuring the absorbance at wavelengths of 300 nm and 470 nm, considering the molar quantity of iron in each sample.
2.2.10. Fourier transform infrared spectroscopy
The ISS injection sample was freeze-dried using a freeze-dry lyophilizer (Labconco, Model: Triad). An established iron-leaching process was used in both IS formulations to remove iron, and the corresponding iron-free liquid supernatants (carbohydrate syrups) were further freeze-dried. A homogenous fine mixture was obtained by pulverizing 3 mg of freeze-dried IS samples and iron-leached sucrose at a ratio of 1:100 with 300 mg of potassium bromide (KBr). The mixture was pelleted using a mechanical press, subjected to infrared analysis using an FTIR spectrometer (Shimadzu, Kyoto, Japan) and analyzed using the IR Affinity-1 software where 45 accumulations were counted. The 4000–400cm-1 range was used for sample scanning with a resolution of 4cm-1. As a blank, KBr FT-IR spectrum was also obtained.
2.2.11. Nuclear magnetic resonance spectroscopy
The ISSs sample was dissolved in deuterium oxide (D2O) with 0.05 weight percentage 3-(trimethylsilyl)-2,2,3,3-tetradeuteropropionic acid (TSP-d4) and transferred to a 5 mm NMR (Nuclear Magnetic Resonance Spectroscopy) tube. NMR spectra were acquired for protons and carbon at 27°C using a JEOL (600 MHz) NMR spectrometer (Model: ECZR) with delta-processing software version 5.3.3. 13C spectra for the IS sample were acquired as such. For 1H spectra, IS samples were processed by leaching iron where sucrose alone was analyzed (used from the FT-IR).
3. RESULTS AND DISCUSSION
3.1. Total iron determination
The average iron content measured using redox potentiometry and AAS ranged from 20 mg/mL to 21 mg/mL (Labeled claim of IS 20 mg/mL). Details are presented in Table 1. IS products, such as Irorich (20 ± 0.1 mg/mL) and Biofer-S (20 ± 0.3 mg/mL), align closely with the labeled claim of 20 mg/mL. However, minor deviations were observed in Orofer® (21 ± 0.3 mg/mL) and Imax-S (21 ± 0.3 mg/mL), which are within acceptable limits (± 5%). The low standard deviations (from ± 0.1 to ± 0.3 mg/mL) across batches highlight the robustness of the analytical method used. These results show that the results obtained from redox potentiometry and AAS methodologies for ISSs are acceptable according to the predetermined criteria outlined in the IS monograph of the USP (Brasted, 1952; Swift, 1929). Therefore, the redox potentiometry results were similar to those of advanced techniques, such as AAS. Hence, the use of redox potentiometry to quantify total iron is a reliable technique that can be implemented in quality control laboratories (Kamisetty et al., 2023).
Table 1
Results of total iron and carbohydrate content.
3.2. Carbohydrate content
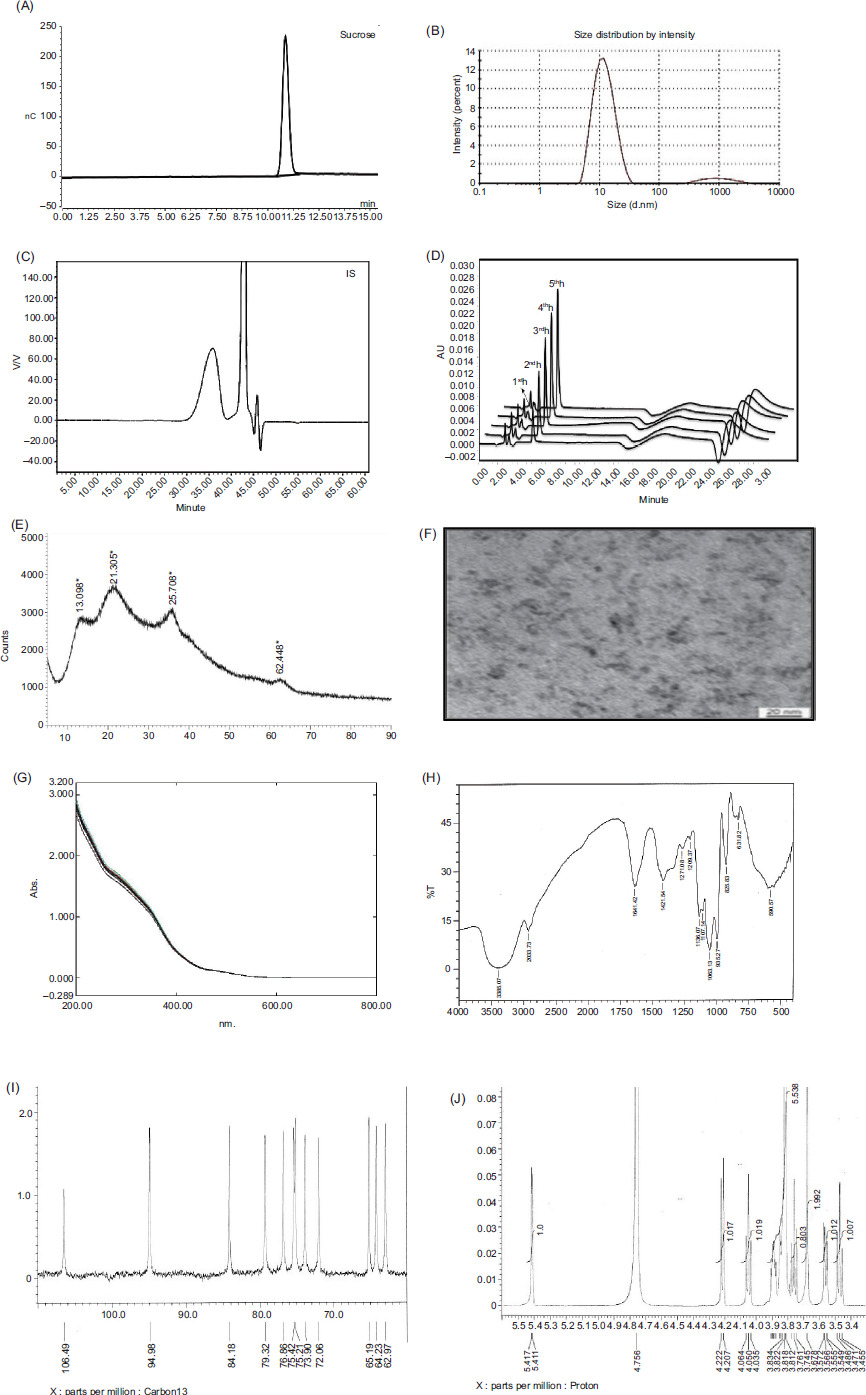
The carbohydrate content determined using IC for the ISSs ranged from 295 mg/mL to 305 mg/mL. Chromatographic details and results are provided in Figure 1A and Table 1, respectively. These results meet the USP’s proposed batch release acceptability limit for IS (260–340 mg/mL) (Funk, 2022; Monographs USP [Iron Sucrose Injection]). Based on these findings, IS requires 15 times more saccharides than iron. The carbohydrate assay results were previously determined using anthrone reagent with a spectrophotometer (Geisser et al., 1992) and an HPLC system with a refractive index detector (Monographs USP [Iron Sucrose Injection]).Colorimetric techniques are more variable and less sensitive. Refractive index detectors are less sensitive, interfere with temperature and pressure fluctuations, and require a longer detector stabilization time. For a more advanced approach, chromatography can be utilized because it has better matrix tolerance and is more sensitive. The determination of carbohydrates by anthrone for the IS drug product was 318–392 mg/mL in three lots (Funk et al., 2022). The results obtained using the current IC method align with the reported values for IS (Geisser et al., 1992).
Figure 1
(A) Typical chromatogram of iron sucrose (B) Distribution of size by intensity for IS (C) SEC chromatogram of IS (D) Representative chromatogram showing the release of labile iron from IS (E) PXRD pattern of IS (F) TEM image of the IS (G) Absorption spectra of overlayed ISS (H) FT-IR spectra of IS. (I)13C spectrum of IS (J) lH spectrum of iron-leached sucrose.
3.3. Dynamic light scattering
ISSs size was determined using dynamic light scattering (DLS). The Z-average values of the ISSs ranged from 10.5 nm to 11.7 nm (Table 2). The results were in accordance with the previously reported Z-average sizes of 11.4 nm (Wu et al., 2016), 11.6nm, 12.2nm, 12.4nm (Di Francesco and Borchard, 2018), 10.1 nm (Shah et al., 2014; Zou et al., 2017), 11.9 nm (Using DLS, ELS and SAXS to Study Ferric Nanoparticles), and 10.1 nm (Di Francesco et al., 2017; Venofer® [iron sucrose injection]_Labeling). The FDA recommends DLS as a critical in vitro study for evaluating colloidal iron drugs due to its ability to provide precise data on particle size and size distribution. DLS is particularly effective for analyzing smaller, homogeneously distributed particles (Barot et al., 2014). The polydispersity index (PDI) is a key parameter for quantifying particle size variability, with values ranging from 0 to 1. A PDI < 0.1 indicates monodisperse particles, while values > 0.1 suggest polydisperse distributions. For ISSs, a polydisperse distribution was observed with a primary size of 11 d.nm and a PDI of 0.21 (Di Francesco and Borchard, 2018). The results are provided in Table 2, and the second peak detected by the instrument in the IS may be a carbohydrate contamination with a lower percentage (Di Francesco and Borchard, 2018). A diagram of the IS sample size distribution is shown in Figure 1B.
Table 2
SEC-HPLC and DLS data.
3.4. Size exclusion chromatography
The Mw of ISSs were determined using SEC-HPLC, ranging from 41 kDa to 43 kDa (Table 2). Mp is critical for the safety and efficacy of iron-sucrose formulations, as it influences pharmacodynamic properties (Barot et al., 2014). Chromatographic retention times reflected ferric oxyhydroxide polymerization (Shah et al., 2014) and showed a homogenous distribution (Barot et al., 2014). Key parameters (Mw [weight average molecular weight], Mn [number average molecular weight], Mw/Mn) in Table 2 confirmed compliance with IS specifications, validating the method’s effectiveness. Chromatograms revealed two peaks post-solvent: a larger peak (sucrose and chloride) and a smaller peak (carbonate and hydroxide mixture) (Neiser et al., 2015). The initial high molecular weight fraction corresponded to iron-carbohydrate nanoparticles (Figure 1C). Although Mp are not absolute, they did enable relative comparisons of hydrodynamic volumes (Inventors Zhang et al., 2021).
3.5. Reduction kinetics
UV/Vis spectrophotometry is a quick technique for determining the bioequivalence of iron reduction kinetics of iron (III) to iron (II) in the ISSs. The rate at which ascorbic acid converts iron (III) to iron (II) according to the kinetics was determined. The T75 values obtained for all ISSs of 23.9 ± 0.3 minutes with a correlation greater than 0.98 agree with the previously reported data. Assessing iron supplement bioequivalence requires comprehensive physicochemical characterization beyond iron kinetics. Key parameters include iron core properties (crystalline structure, environment, size), particle morphology, carbohydrate shell composition, surface characteristics, and labile iron detection.
3.6. Chelatable iron determination
Paffetti and Nilsson defined “free” iron as low molecular weight iron not bound by high-affinity plasma proteins or biomolecules in bodily fluids, representing the fraction dissolvable without reductive or complex agents. Labile iron, bound to the iron-carbohydrate matrix, circulates in the blood and resists dialysis. Plasma proteins and chelation agents can increase dialyzable iron by mobilizing labile iron. Chelation assays cannot distinguish free from labile iron, making “chelatable iron” a more accurate term. The amounts of chelatable iron (free and labile iron) obtained from the ISSs were in the range from 0.33% to 0.61% under in vitro conditions. A earlier study reported that 3.8% of iron was chelatable via EDTA (ethylenediaminetetraacetic acid) chelation (Zou et al., 2018), and this study used DFO chelation. Different chelators yield varying absolute quantities but similar profiles. Labile iron comparisons between iron colloid products under identical conditions of their iron release kinetics are shown in Figure 1D.
3.7. X-ray diffraction
XRD analysis revealed distinct patterns for iron oxyhydroxide and iron oxide crystallites in IS. The IS diffractogram exhibited peaks at 13.0°, 21.3°, 35.7°, and 62.4°, with 13.0° and 21.3° attributed to amorphous sucrose, potentially masking iron-carbohydrate cores (Barot et al., 2014; Barot et al., 2014; Gutiérrez et al., 2005; Kudasheva et al., 2004; Zou et al., 2018). The peak at 35.7° indicated iron oxides, aligning with akageneite-like structures, whereas the 62.4° peak suggested Cl– anions (Barot et al., 2014; Barot et al., 2014; Jahnet al., 2011; Kudasheva et al., 2004), consistent with akageneite’s tunnel structure. Supported by SAED data, comparisons with ferrihydrite patterns at 2° values of 36° and 62° indicated a shift of iron ions toward oxygen planes. Previous studies identified IS as a mix of goethite-akaganeite, ferrihydrite, lepidocrocite, or akageneite, with recent findings highlighting ferroxyhyte (δ-FeOOH) as the major phase. Reported crystallite sizes ranged from 1 nm to 5 nm, with this study confirming an iron core diameter of 3.3 nm (Figure 1E). Due to IS cores’ low crystallinity and small size, XRD alone is insufficient, necessitating complementary techniques like TEM, and Mössbauer spectroscopy for comprehensive characterization.
3.8. Transmission electron microscopy
Bead-like structures were observed in the IS TEM image in Figure 1F. The core size distribution for IS was 1.0–6.0 nm, and the average size of the iron core determined in this study was 3.6 ± 2.2 nm (n = 20). These data are similar to the previously reported data of 3 ± 2 nm (Balakrishnan et al., 2009; Kudasheva et al., 2004), 2.92 ± 0.01 nm, 2.77 ± 0.63 nm (Barot et al., 2014). These differences in size may be due to inconsistencies in the concentration of samples, preparation, instruments, parameters, and data processing. Additional evaluations using appropriate methods are required.
3.9. UV-visible absorption spectroscopy
The molar extinction coefficients for IS were determined at 300 nm (from 3132.9 ± 6.45 to 3215.4 ± 4.68 M–¹ cm–¹) and 470 nm (from 378.6 ± 0.21 to 401.7 ± 0.75 M–¹ cm–¹), corresponding to oxymetal charge transfer and d-d (d-orbital to d-orbital) transitions, respectively (Barot et al., 2014; Kudasheva et al., 2004). The spectra are characteristic of high-spin Fe (III) complexes with octahedral geometry and a d5 configuration. The 300/470 nm extinction coefficient ratio of ~8 aligns with the reported values for IS, confirming the presence of a ferric oxyhydroxide core (Koralewski et al., 2013). These results, consistent with the literature (2600–3000 M–¹ cm–¹ at 300 nm and 300–400 M–¹ cm–¹ at 470 nm), validate the structural and electronic properties of the complex (the corresponding data are provided in Table 3 and the spectra in Figure 1G).
Table 3
Results of the IS average absorbance spectra molar extinction coefficients.
3.10. Fourier transform infrared spectroscopy
The structure of the carbohydrate shell and iron core interactions in iron formulations were analyzed using the Fourier transform infrared spectroscopy (FT-IR), a technique effective in distinguishing oxidized from nonoxidized substances. Group frequencies (above 1500 cm–¹) and fingerprint bands (below 1500 cm–¹) provide distinct absorption patterns for characterizing polysaccharides. FT-IR spectra of IS revealed significant differences from pure sucrose, indicating complex formation (Figure 1H). Key peaks included 3385 cm–¹ (OH [hydroxyl] groups), 2933 cm–¹ (intermolecular hydrogen bonds), 2890 cm–¹ (C-H [carbon-hydrogen] stretching), and 1400–1000 cm–¹ (C-O [carbon-oxygen] stretching). Owing to the Fe-O vibrations, the compound displays six bending vibrations of water molecules at 1641 cm-1 and bands in the 580 cm-1 region, with the bands matching those previously reported by Venofer (Venofer® [iron sucrose injection]_Labeling). FT-IR spectra of iron-carbohydrate formulations such as IS and iron dextran were analyzed under identical conditions. The overlay spectra showed similar profiles with minor differences in peak shape and intensity within the 1500–500 cm–¹ fingerprint region. The purity index between IS and iron dextran was 0.6589, confirming FT-IR’s ability to differentiate iron-carbohydrate complexes, as their correlation was below 0.99. The complexity of polysaccharide characterization via FT-IR is due to the structural similarities and band overlap, requiring analysis of multiple spectral regions (4000–2500 cm–¹, 1800–1500 cm–¹, 1500–1200 cm–¹, 1200–800 cm–¹, and below 800 cm–¹) for accurate interpretation.
3.11. Nuclear magnetic resonance spectroscopy
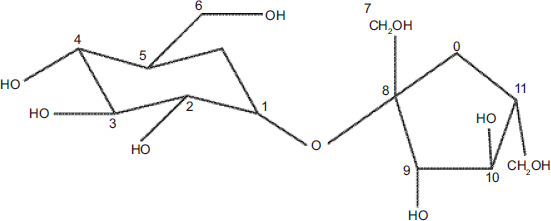
Functional groups can be used to classify carbohydrates as stabilizers in ferric preparations. Sucrose-containing preparations may serve as ligands or interact with the ferric (hydr)oxide particles. Iron (III)-containing preparations’ 13C NMR signals were cancelled out by the paramagnetic center’s binding, and only the nonmetal-bonded molecules were detected by the Evans effect in NMR spectroscopy. Along with being downfield-shifted and widened, the signals are also affected by the iron content (Kästele et al., 2014). The chemical shifts obtained from 13C NMR of IS are C1-94.98, C2-73.90, C3-75.42, C4-72.06, C5-75.21, C6-62.97, C7-64.23, C8-106.49, C9-79.32, C10-76.86, C11-84.18, and C12-65.19; 1H NMR was attributed to H1-5.41(d), H2-3.55(dd), H3-3.75(t), H4-3.45(t), H5-3.82(m), H6-3.81(m), H7-3.67(m), H9-4.20 (d), H10-4.03(t), H11-3.83(m), and H12-3.81(m), which suggested iron molecule complexation and matched with the previously reported chemical shifts (Barot et al., 2014; Inventors Zhang et al., 2021) (Figure 1I and 1J). Carbon signals expand in the presence of iron, whereas proton signals do not (Barot et al., 2014; Inventors Zhang et al., 2021). The structure of the IS is shown in Figure 2.
4. CONCLUSION
Multiple analytical techniques were employed to characterize ISS complexes, examining their complete structure (iron core + carbohydrate shell) as well as individual components quantitatively. The measured iron and carbohydrate contents matched label claims, with method validation confirming accuracy. DLS measurements of particle size, Mw, and T75 values correlated well with the published data, though minor batch-to-batch variations in chelatable iron content were observed. UV-Vis and TEM analysis confirmed consistent ferric octahedral coordination and core morphology across samples. XRD analysis revealed crystallinity uncertainties due to data limitations, with phase identifications that included various iron oxyhydroxides. Complementary TEM-XRD proved valuable for analyzing low-crystallinity nanomaterials. FT-IR and NMR spectroscopy elucidated carbohydrate-specific interactions with the iron core, verifying a sucrose-stabilized polynuclear Fe (III) oxyhydroxide structure in all ISS formulations. These comprehensive characterizations revealed how variations in nanoparticle properties (size, morphology, core-shell interactions) influence therapeutic performance. Characterization of iron colloids is a complicated and variable process that requires many approaches to obtain accurate and reliable information. A head-to-head comparison study helps minimize variations in the methods; however, it is important to note that the quality of the data and conclusions can be influenced by factors such as sample preparation, experimental settings, and data interpretation. Both the proposed qualitative characterization and quality-impacting quantitative methodology approaches have the potential to be appropriate for evaluating colloidal iron medicines.
ACKNOWLEDGMENTS
The authors express their gratitude to GITAM (Deemed to be University) for providing support for the research activity and Biological E. Limited for data analysis.
AUTHOR CONTRIBUTIONS
Research concept and design: K.R., M.K.K.; Collection and/or assembly of data: S.P., K.J.; Data analysis and interpretation: M.K.K.; Writing the article: S.P.; Critical revision of the article, K.R., R.M.; Final approval of the article, K.R.. All authors have read and agreed to the published version of the manuscript.