

Introduction
Plastics are low-cost, lightweight, robust, long-lasting, and corrosion-resistant materials. In the past 75 years, plastic has increasingly replaced natural materials in various fields and has become an essential part of everyday life (Elahi, Bukhari, Shamim, & Rehman, 2021). Plastic waste can break into smaller fragments through various mechanisms such as wave action, hydrolysis, and photodegradation when entering the atmosphere, which can be classified as macroplastics (>5 mm), microplastics, (0.1 µm to 5 mm) and nanoplastics (< 0.1 µm) (Gilani, Sayadi, Zouari, & Al-Ghouti, 2023; Rochman & Hoellein, 2020; Veerasingam et al., 2021). Agricultural lands receive 14% of all plastics discharged into the environment. MP contamination of agroecosystems tends to originate from agricultural practices such as using plastic mulches, spreading sewage sludge, and irrigation of land contributing to its MPs accumulation in soils (Nizzetto, Futter, & Langaas, 2016; Peng, Wang, & Cai, 2017; Steinmetz et al., 2016). While some MPs are constantly replenished in the food chain, a sizable portion of plastic particles contribute to forming many MPs in the soil through physical, chemical, and biological processes (Doan et al., 2023).
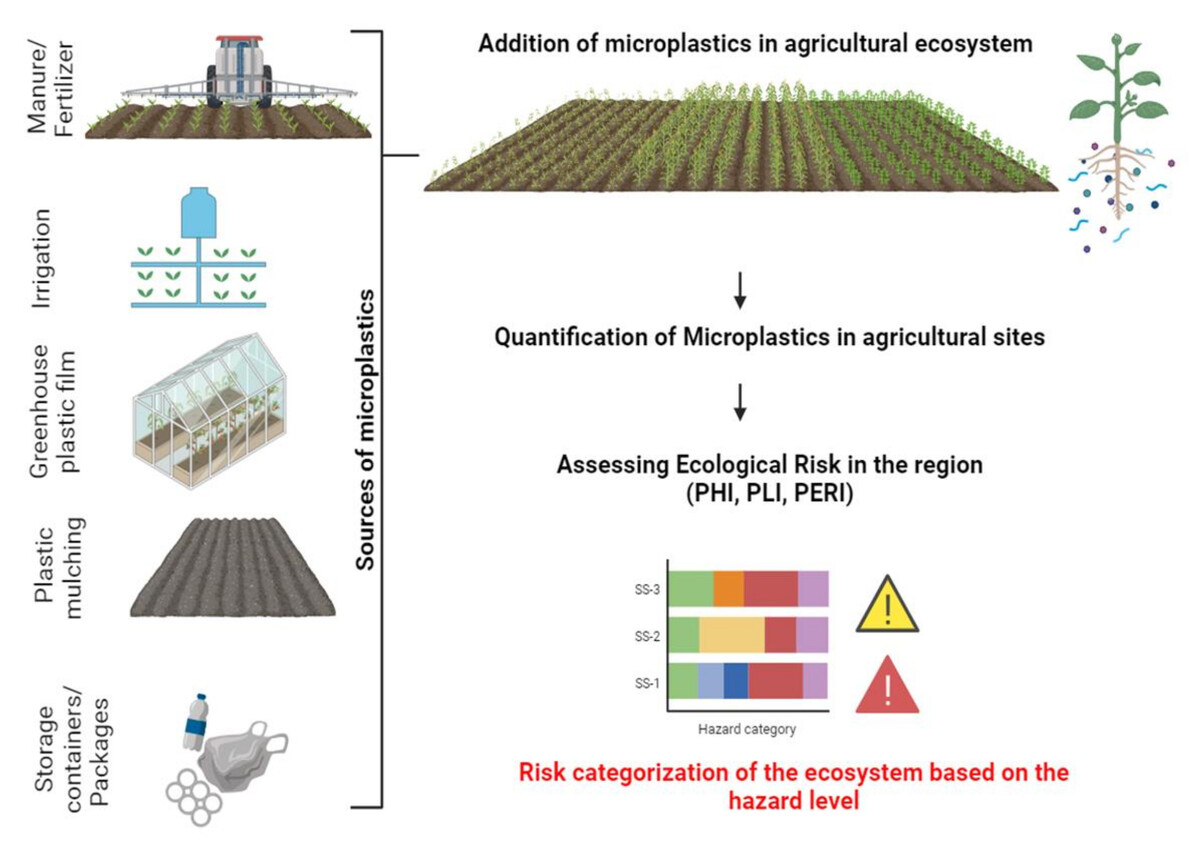
The wide distribution of MPs in agricultural soils is through various factors such as application of fertilizers, sources of irrigation, agronomic practices like plastic mulching, greenhouse films and plastic storages, and atmospheric deposition (Bläsing & Amelung, 2018; Weithmann et al., 2018). Sadia et al. (2023) observed that microplastics generated in terrestrial environment leads to depositions in the ocean through rivers, streams, sewer systems, and stormwater drains. The mean abundance of MPs of coastal sediments in India is 80 ± 72 items kg-1 in Thoothukudi (Keerthika et al., 2022), 403 items kg-1 in Rameshwaram (Vidyasakar et al., 2018), 720.30 ± 191.60 items kg-1 in Puducherry (Dowarah & Devipriya, 2019), 258.7 ± 90.0 items kg-1 in Odisha beaches (Patchaiyappan, Ahmed, Dowarah, Jayakumar, & Devipriya, 2020), 50±29 to 103.8±87 items kg-1 in Tuticorin and Vembar, Gulf of Mannar (Patterson, Jeyasanta, Sathish, Edward, & Booth, 2020) and 407 items kg-1 in estuaries along the southwest coast of Kerala (Radhakrishnan et al., 2023). Meanwhile, marine surface water on the Indian coast was recorded with 12.14 ± 3.11 to 31.05 ± 2.12 items l-1 in the Tuticorin region (Patterson, Jeyasanta, Sathish, Booth, & Edward, 2019) and 60± 54 to 126.6 ± 97 items l-1 in Tuticorin and Vembar islands (Patterson et al., 2020). The MP pollution in marine, freshwater, biological organisms (fishes), and urban and high-altitude regions has been studied and reported in many regions in India. However, terrestrial reservoirs, particularly agricultural lands, need further attention and investigation. The uptake of MPs and NPs is assessed in plants and soil fauna, which indicates the immediate need for understanding their ecological risk in the contaminated regions to raise awareness of MPs in agroecosystems, as MPs are highly distributed in farmlands than urban lands (Yu, Zhang, Tan, & Zhang, 2022).
Microplastics have permeated the environment, severely altered ecosystems, and posed environmental risks. In this study, we assessed the potential ecological risk index (PERI), polymer hazard index (PHI), and pollution load index (PLI) of MPs in various agricultural fields, which is crucial for understanding the potential health consequences of MP consumption.
Materials and methods
Study site
The study sites were chosen based on the crop history followed in agricultural sites to understand the distribution pattern of MPs and identify the possible risk of uptake by food and feed crops from agricultural soils. Five of the six agricultural sites chosen for this study, are in Tamil Nadu Agricultural University, Coimbatore, and one in Horticultural Research Station, Udhagamandalam. Both districts are located in Tamil Nadu, a southern state in India. Each site receives distinct agricultural inputs and irrigation practices with a crop history for at least five years. Besides the intentional addition of plastics such as mulching films, the unintentional addition through agronomic inputs such as fertilizers, manures and irrigation sources could possibly increase MP concentration in the studied sites (Tang, 2023). The details of agricultural sites chosen is given in Table 1.
Sample analysis
The soil samples were collected at 12 points in each agricultural site at a depth of 15 cm by random sampling method. The samples from each site were mixed to acquire a homogenous sample and air-dried in a clean room and assessed in replications. The clods in soil samples were broken using a wooden hammer for easy sieving and digestion (Yang et al., 2021). A 5 mm brass sieve was used to sieve soil samples for further analysis. Organic carbon (OC) was measured using chromic acid wet digestion method (Walkley & Black, 1934) and organic matter content was derived from the OC level.
Extraction and quantification of MPs
The soil sample (20 g) was added with 100 ml of MilliQ water and kept in the shaker for an hour. Wet peroxide oxidation method was used for digestion of soil by adding 30 ml of Fenton reagent (30% Hydrogen peroxide + Iron catalyst @1:1) followed by density separation (30 ml Saturated Sodium Chloride) at 60 °C (Cao et al., 2020). Further, 30% hydrogen peroxide was added and left for 24 hours of reaction under 60 °C and kept at room temperature for another 48 hours. The solution was filtered using glass fibre filter paper (47 mm) and stored in a clean Petri plate. Using a stereo microscope (Supreme E5 coupled with LED illuminator of 3.5W-3V, Optscopes, Germany), the mean abundance of polymers was assessed for all the agricultural sites and characterized using ATR-FTIR (Agilent Cary 630). The spectra were recorded with eight co-scans.
Table 1
Details of the sampling sites
Risk assessment
The ecological risk assessment of MPs was commonly assessed in coastal sediments (Castillo, El-Azhary, Sorino, & Levay, 2024; Keerthika et al., 2022), marine water (Covernton et al., 2019), estuaries (Nithin et al., 2023), lakes (Laju et al., 2022) and rivers (Peng, Xu, Zhu, Bai, & Li, 2018). This study attempted to evaluate the risk due to MP contamination in agricultural sites to speculate the ecological hazard using the PHI, PLI and PERI based on the categories given in Table 2.
Polymer Hazard Index (PHI)
PHI is calculated based on hazard score i.e., chemical toxicity of polymers which causes ecological harm (Lithner, Larsson, & Dave, 2011). The concentration and chemical composition of the polymers are considered for evaluation of the potential risk of MPs in our study area (Xu et al., 2018). The PHI values were calculated based on (1).
where Pn is the polymer proportion of MPs polymers identified in agricultural sites. Sn value is derived from the hazard score. The hazard scores of Polyethylene (PE), polystyrene (PS), Polyvinyl chloride (PVC), polyacrylonitrile (PAN), and polyacrylamide (PAA), identified in the agricultural soils are 11, 30, 10001, 11521, and 12379 respectively (Lithner et al., 2011).
Pollution Load Index (PLI)
An integrated pollution load index (PLI) was calculated based on the degree of MP contamination in soil samples (Ranjani et al., 2021; Tomlinson, Wilson, Harris, & Jeffrey, 1980). PLI at each agricultural site relates to the corresponding CFi (concentration factor) which is calculated by (2) where Ci is MP concentration at each sampling point and Coi is the lowest concentration observed in the sample. The square root value of CFi provides the PLI value of a particular site (Formula 3), while the PLI of the zone (Coimbatore region) can be obtained from the 6th square root of PLI. The 6th root is applied to the formula (4) as we have six sampling sites and MP concentration in all sites are multiplied together.
Potential Ecological Risk Index (PERI)
The assessment of Ei (single polymer hazard) and RI (combined polymer hazard) gives the PERI value (Peng et al., 2018). Ti is the toxicity response factor derived from the multiplication of the percent composition of MP type in each sampling site (Pn) and hazard score of each MP polymer (Sn) (Lithner et al., 2011). The ecological risk RI is calculated from the sum of ecological hazards caused by the single polymer (Ei) and Ei is derived by multiplying Ti and CFi values. The values are calculated using formulae (5-7).
Quality control
The quality control was possibly maintained from sampling to characterization as MPs from the atmosphere or any other source could cause major errors in calculating MP concentration. Milli-Q water was filtered before being used to digest samples and glassware was washed thoroughly using filtered Milli-Q water. Cotton white lab coats and gloves were worn in the clean room during the analysis to prevent cross-contamination. The blank experiments with filtered Milli-Q water in a pre-washed beaker were carried out to reduce the background contamination.
Table 2
Ecological risk indices and their categories
Table 3
Hazardous MPs and their hazard scores
Results and discussion
Concentration of MPs in agricultural sites
The concentration and chemical composition of MPs were assessed to identify the polymers which are reported with hazard scores due to their primary hazard levels and risk category (Lithner et al., 2011). The percent concentration of PE, PS, PAN, PAA, PP, and PVC in agricultural sites out of other MPs is given in Figure 1 with PE as the most prevalent polymer in all sites: SS-6 (56.67%) > SS-1 (55%) > SS-5 (28.13%) > SS-2 (21.95%) > SS-4 (15.15) > SS-3 (8%). The hazard scores of PP (1), PE (11), and PS (30) are comparatively lesser than PVC (10001), PAN (11521), and PAA (12379) but the contamination level in the agricultural sites decides the toxicity caused in the region.
PE in agricultural systems enters as mulch or foil to protect crops, regulate temperature, control weeds, and retain moisturizer, which embrittles to form microplastics due to sunlight and other agricultural activities (Liu et al., 2018). The second prevalent hazardous MP type was assessed to be PS, which is deposited in agricultural soils through greenhouses, mulching, fertilizers, and sludge containing PS (Piehl et al., 2018). The uptake and incorporation of PS MPs and NPs into human cells through the food chain and the release of toxic monomers from PS MPs caused mutagenicity, reproductive toxicity, and carcinogenicity (Chen, Feng, & Wang, 2020; Kik, Bukowska, & Sicińska, 2020). Similar to PE and PS, PP is widely used in agriculture and has proven to alter ammonium and phosphorous content in the soil, which indicates the impact of MPs on soil fertility (Li & Liu, 2022). PAN is reported to be an unattended pollutant contributing to 5.88% of MPs concentration in dewatered sludge in Shanxi, Chin (Flores-Ocampo & Armstrong-Altrin, 2023; Ren et al., 2020). Whereas PAA, a highly environmentally toxic polymer that is mostly used in wastewater treatment and erosion control agents in farmlands has rarely been reported for impacts on agriculture ecosystem (Sadeghi et al., 2020; Xiong et al., 2018).
Risk Assessment of MPs
The ecological risks in the agricultural sites are evaluated using the adopted models for this study: PHI, PLI, and PERI. The values derived were categorized according to the ranges given in Table 2. The overall PHI value (5234.02) was obtained from the total mean MPs composition in six studied sites and their corresponding hazard score, which indicates the highest hazard category level V and PHI values of each site are given in Figure 2a. The lowest PHI value was recorded in SS-3 (3.88) with II categories while the highest was in SS-5. Although SS-3 and SS-6 are located parallel to the same road network, the variation in the agronomic inputs may have influenced the contamination hazard level. The ecological risk in coastal regions of Tamil Nadu and Kerala (coasts near the study area) have high levels of PHI (>1000) with the presence of PP, PET, PS, PA, and PE (Ranjani et al., 2021). The run-off from agricultural sites might influence an increase in MP deposition in water ecosystems in the region.


PLI values in the agricultural sites indicate the highest degree of contamination in SS-2 (7.00) followed by SS-4 (6.41) > SS-6 (6.01) > SS-1 (5.94) > SS-5 (5.74) > SS-3 (2.00) (Figure 2b). Although SS-1 has the same irrigation source as SS-2, the inorganic fertilizers containing a higher abundance of PAN, PP and PS might have increased the hazard level in SS-2. The second highest value in SS-4 is due to the abundance of PE and PS irrespective of their polymer hazard scores. The PLI zone value for all the sites was recorded to be 5 and PLI values at each site fall under category I indicating low contamination level in zonal and site level. The PLI values assessed in coastal sediment in Tamil Nadu showed similar results with minor level (category I) while Karnataka, Maharashtra, and Vembanad Lake were assessed with medium level contamination (category II) (Keerthika et al., 2022; Ranjani et al., 2021). Although PLI levels measured in the study site are proportionate with other coastal sediment values, further research is necessary to assess the contamination level thoroughly.
The PERI values derived from the ecological hazard of each polymer exhibited varied risk categories at each site as shown in Figure 2c. The minor risk level of RI is observed in SS-3, medium in SS-6, danger in SS-4, and the other three sites with extremely dangerous risk levels, where SS-2 scored the highest among all. The risk level summed up in all sites recorded with extremely dangerous category in Coimbatore region. There is considerable variation among agricultural sites due to the polymers present in each site and their respective hazard scores. Despite the minimal quantity of some MPs, their hazard level increased the ecological risk. However, this study provides preliminary data based on microplastic concentration and values derived from polymer hazard levels. Further research in agricultural sites of South India can provide the distribution of hazardous MPs and their impact on other ecosystems.
Ecological Risk on agricultural soil biota
The abundance of MPs in farmlands has been reported to cause serious damage to the physical, chemical, and biological properties of soil. MP abundance in agricultural soils was reported as follows: Tibet, China (20–110 items kg-1); Southwestern China (7100 to 42,960 particles kg-1); Shanghai, China (78 and 62.5 items kg-1); the Swiss floodplain (593 items kg-1); Sydney, Australia (300–67,500 mg kg-1); and Yeoju, Korea (664–3440 items kg-1) (Choi, Kim, Yoon, Dickinson, & Kim, 2021; Feng et al., 2020; Fuller & Gautam, 2016; Liu et al., 2018; Liu et al., 2018; Scheurer & Bigalke, 2018). The transfer of MPs through layers of soil could affect soil-beneficial fauna such as earthworms (Naqash, Prakash, Kapoor, & Singh, 2020; Padervand, Lichtfouse, Robert, & Wang, 2020), collembolans (Maaß, Daphi, Lehmann, & Rillig, 2017), mites (Zhu et al., 2018) and isopods (Kokalj, Horvat, Skalar, & Kržan, 2018) causing severe damage to the agricultural ecosystems. Microplastics can build up in plant roots and stomata, affecting nutrient absorption and movement in the soil (Machado et al., 2019; Yin et al., 2021; Yu, Song, Xu, Ma, & Lu, 2021).
MPs and NPs affect plants' physiological and biochemical processes due to their exposure to the agricultural system. The impact and bioavailability of MPs depend on soil properties and characteristics of plants grown apart from the nature of MPs (Scherer, Brennholt, Reifferscheid, & Wagner, 2017; Yu et al., 2020). The charge of MPs (co-existence with other chemicals like heavy metals and pesticides) can enhance adsorption through roots due to electrostatic attraction, which affects photosynthesis and nutrient immobilization in plants (Lian et al., 2020; Lian et al., 2020). The biochemical processes taking place around roots play a major role in the absorption of MPs through root exudates which are exchanged with plants (cation exchange capacity) along with amino acids, sugars, and ectoenzymes. The presence of MPs is an external factor that affects the production of root exudates (Abbasi et al., 2020; Vranova, Rejsek, Skene, Janous, & Formanek, 2013).
The accumulation and uptake in agriculturally grown crops were reported to absorb MP particles through foliar and basal application. Most studies reported the uptake of NPs into the plants due to their size as large particles cannot enter through plant cell walls. The MPs further break down and interact with positively charged heavy metals, which can enter the plants through negatively charged plant mucilage and exudates (Avellan et al., 2017). The rice crop exposed to PE mulched film and biodegradable mulch film exhibited a significant reduction in crop height and dry weight, while PE mulched polymer induced oxidative stress in rice shoots and roots with an increase in reactive oxygen species (Yang & Gao, 2022). The metal availability increased with the presence of PE microplastics and uptake of Zn in edible leaves of lettuce with 9.1% (2.5% PE) and 21.1% (5% PE) (Bethanis & Golia, 2023).
The cropping pattern was also found to be one of the key factors for the accumulation of MPs in a Shanghai farmland with 469 ± 47 items kg-1 and 342 ± 49 items kg-1 in vegetable and paddy fields respectively. The cropping pattern in this study is varied and has been followed for more than 5 years justifying the variabilities in MPs distribution.Li et al. (2020) absorbed the transfer of luminescence PS beads (0.2 µm) into wheat and lettuce through cracked lateral root apex and apical meristem through immature Casparian bands, where PS beads spread to epidermis and xylem vessels in wheat. MPs were observed to affect the plant's physiological characteristics such as germination (Zea mays, Lactuca sativa), photosynthetic pigments (Arabidopsis thaliana, Lactuca sativa, Zea mays, Lolium perenne), shoot and root growth (Triticum aestivum, Arabidopsis thaliana, Lactuca sativa, Zea mays, Lolium perenne) (Azeem et al., 2021).
The soil-plant MPs interaction further leads to transfer into the terrestrial food chain and can potentially enter into humans through food. Chicken grown in a home garden had a high concentration of MPs (129.8 ± 82.3 particles g-1) in their faeces (Lwanga et al., 2017). The MPs ingestion during the average food intake of humans was evaluated to be 39,000 to 52,000 particles (Cox et al., 2019). Therefore, research gaps in the trophic transfer of MPs from agricultural systems need to be studied as still there is a dearth of data to completely assess the impact on human health.
Conclusion
This study employed the ecological risk indices (PHI, PLI, PERI) to calculate the ecological risk in agricultural sites of the Coimbatore region. The PHI values suggested the varying hazard levels in sampling sites with the highest risk level in paddy soil (Category V). Whereas PLI values suggested the highest contamination in inorganic fertilizers applied field due to the presence of PAN, PP, and PS. However, pollution load indicated a minor level of polymer contamination in sampling sites and the entire zone (5). PERI values suggested the highest contamination in the inorganic fields posing extremely dangerous risk levels followed by plastic mulched and organic manure applied sites. Therefore, the concentration of polymers and hazard scores are the key deciding factors in evaluating contamination levels in agricultural sites. Furthermore, the MP contamination in terrestrial soils has yet to be reported and included in environmental risk assessment. The distribution characteristics in agricultural soils and the development of risk assessment methods in terrestrial ecosystems like base reference data could help in understanding the ecological risk and implications on human health.
Conflicts of interest
The authors declare that they have no known competing financial interests or personal relationships that could have appeared to influence the work reported in this paper.
Funding
This research received no specific grant from funding agencies in the public, commercial, or not-for-profit sectors.
Author contributions
Karthika Sangilidurai – Conceptualization, Writing original draft, Methodology, Field sampling, Formal analysis, Data curation and editing; Sivasubramanian Karuppusamy – Conceptualization, methodology, supervision and editing; Dhevagi Periyasamy – Conceptualization and supervision; Rajkishore Subramani Krishnaraj – Conceptualization and supervision; Chitra Narayanasamy – Conceptualization and supervision; Lakshmanan Arunachalam – Supervision and validation; Dinesh Govindaraj Kamalam– Validation and suggestion.