

Introduction
The emergence of antimicrobial drugs (antibiotics, antiviral and antifungal drugs) in modern medicine has made it possible to control the development of viral and bacterial infections. From 1930 to 1962, more than 20 classes of antibiotics were developed (Coates et al., 2011), which are aimed at stopping the synthesis of proteins and metabolites, disrupting the integrity of the cell wall and the process of binary fission of bacterial microorganisms (Cheesman et al., 2017). Currently, the pace of development of new classes of antibiotics has slowed, but their consumption has increased, leading to the emergence and rapid spread of antibiotic-resistant pathogens, especially multidrug-resistant bacteria (Aminov, 2009). One of the main approaches to obtaining new antimicrobial agents is the search and adaptation of natural products, for example, plant extracts rich in phenols and flavonoids (Njimoh et al., 2015, Kothari et al., 2012). According to the literature, the World Health Organization has registered the names of more than 20,000 species of medicinal plants with various potential uses, including as antibacterial agents (Cheesman et al., 2017). The usage of plant extracts against bacteria, molds, insects, viruses and tumor cells as photosensitizers of reactive oxygen species is known (Chiode et al., 2022, Sarker & Ahn, 2022). Among the promising plant antibacterial agents, agents of plant origin stand out. One of the promising natural agents due to its potential antibacterial properties is Viburnum opulus (VO). The prospects for using extracts based on Viburnum opulus are due to the presence of such biologically active components as vitamin C, carotenoids, iridoids, essential oils and phenolic compounds. Due to this composition, VO extract has antioxidant activity, antimicrobial potential (especially against gram-positive bacteria), and has proven anti-inflammatory, anti-obesity, antidiabetic, osteogenic, cardio- and cytoprotective properties (Ozkan et al., 2022, Kajszczak et al., 2020a, Kajszczak et al., 2020b). There are many methods for screening and assessing antimicrobial activity, for example: flow cytometry, bioluminescence and various diffusion methods (Balouiri et al., 2016). Currently, optical methods for non-invasive analysis of the sensitivity of bacterial cells to antimicrobial drugs in vitro are being actively developed. One of these methods is the method of Raman scattering (RS) and its special cases, such as Surface-Enhanced Raman spectroscopy (SERS) (Jung et al., 2014). This method is non-invasive and allows you to obtain information about the chemical structure of microbial cells and biofilms without sample preparation of the samples being studied. The SERS method is based on the phenomenon of plasmon resonance, which can be observed both on rough metal surfaces (Macias et al., 2016) and on metal nanoparticles (Barbillon, 2020). By changing the parameters of nanoparticles (material, size, geometry), it is possible to control the generation of plasmon resonance and the amplification of the Raman signal, which makes it possible to increase the detection limit of the substances under study. Theoretical and experimental studies have shown that the maximum electric field strength is formed at the corners or vertices of anisotropic nanoparticles with maximum curvature (Khoury & Vo-Dinh, 2008). Nanoparticles can act as a signal amplifier for the photodynamic effect, have a photothermal effect on cells, and also enhance optical processes near their surface. Methods for obtaining gold nanoparticles (AuNPs) are based on the reduction of chloroauric acid HAuCl4. But there are several ways of synthesis. The first and most common is the Turkevich method (Turkevich et al., 1951), which consists of reducing HAuCl4 with sodium citrate Na3Cit in an aqueous medium and upon heating. Here, sodium citrate acts both as a reducing agent and as a stabilizer. The method makes it possible to obtain nanoparticles with a diameter from 5 to 150 nm. But in this case, the particle size in one solution will not be uniform with a large size distribution, and the particles will have a non-uniform shape. Another method involves the preliminary preparation of seeds (Perrault & Chan, 2009), nanoparticles that are subsequently used as seeds and using mild reducing agents such as sodium citrate. This method allows one to obtain particles with a low spread in size, but often when synthesizing gold nanospheres (AuNPs) with large diameters, rod-shaped nanoparticles are also formed. Another way to produce gold nanoparticles using seeds is to reduce HAuCl4 with ascorbic acid (AA) and use cetyltrimethylammonium bromide (CTAB) as a cationic surfactant. This method makes it possible to control the morphology of nanoparticles; purification of sols from excess CTAB is difficult. After analyzing the advantages and disadvantages of the listed methods for obtaining AuNPs, it was decided to use a multi-stage and kinetically controlled method using seeds and using Na3Cit as a stabilizer and reducing agent (Inoue et al., 2016, Bastús et al., 2011). The method was based on preparing seeds using the Turkevich method and then gradually growing the particles. The synthesis took place at a temperature of 90°C, which slowed down the growth of nanoparticles, but at the same time reduced the number of irregularly shaped nanospheres. In addition, the synthesis used available and safe reagents that can be easily removed.
This article presents the results of studies on the effects of VO extract on Escherichia Coli (E.Coli). It has been shown that the aqueous extract, when exposed to laser irradiation, produces cell growth and activation of cellular metabolism. It has been established that under the action of laser irradiation the process is pronounced. When exposed to an aqueous-alcoholic extract, it was found that when exposed to laser radiation, the intensity of phenylalanine vibrations decreases, which indicates the processes of apoptosis in the cell.
Materials and methods
The SERS experiment several stages. The first step was to take the spectral profile of E.Coli on the rough titanium surface and evaluate the background effect of the extract on the bacteria. The second step was to evaluate the effect of the extracts on bacteria when exposed to laser irradiation to generate singlet oxygen. The scheme of experiment is shown on Figure 1.

VO extracts preparation
For the experiments, aqueous and aqueous-alcoholic extracts were prepared and used in the experiments. The alcohol concentration in the solution was selected so as not to affect cell viability and was about 15%.
The preparation of an aqueous extract of viburnum berries VO was carried out as follows. Fresh viburnum berries weighing 213 g were crushed in a mortar and their juice was squeezed out. then distilled water was added, then extraction was carried out for 48 hours at room temperature. The resulting extract was mixed with the juice and then repeatedly passed through paper filters until a clear, bright red liquid was obtained. Final filtration was carried out through a filter with a pore size of 200 nm. In the extract obtained in this way, no precipitation was observed for more than 24 hours.
The preparation of aqueous-alcoholic extract of viburnum berries VO was carried out as follows. Fresh viburnum berries weighing 213 g were crushed in a mortar and their juice was squeezed out. A solution of ethanol in distilled water in a ratio of 3:7 was added to the remaining pulp, and extraction was carried out for 48 hours at room temperature. The resulting extract was mixed with the juice and then repeatedly passed through paper filters until a clear, bright red liquid was obtained. Final filtration was carried out through a filter with a pore size of 200 nm. In the extract obtained in this way, no precipitation was observed for more than 24 hours.
Bacterial preparation
For research, a strain of E.Coli (Dh5α) was used, which was provided by the «Biotechnology» Research Center of Immanuel Kant Baltic Federal University. LB broth was used as growth medium. The bacterial strain was cultured from glycerol stock at −80°C in LB broth and incubated at 250 rpm and 37 ± 0.5°C overnight in an incubator. Overnight cultures were diluted in LB broth to achieve an optical density (OD) of 0.2 at 600 nm. The liquid broth culture was then transferred to Petri dishes and grown overnight. Then the bacteria were transferred for further research to the Research Center "Fundamental and Applied Photonics. Nanophotonics" for experiments.
SERS substrates preparation
In the works carried out in Research Center "Fundamental and Applied Photonics. Nanophotonics", various methods of amplifying the RS signal to obtain spectra of various compounds were investigated. Platelet mass (A. Zyubin et al., 2020, A. Zyubin et al., 2022) was investigated using titanium surfaces, low-concentration amber extract using quartz surfaces with the use of nanoparticles (Kundalevich et al., 2023, A. Zyubin et al., 2024). Based on the work carried out, a method for working with E.Coli was determined.
Titanium based SERS substrates
As the basis for optical sensors, anodized titanium plates measuring 2.5 × 2.5 cm were synthesized. Before anodizing, they were previously degreased and washed in distilled water. The electrolyte medium was 3% potassium hydroxide solution (KOH 3%). The anodizing circuit consisted of a current source, a cathode and an anode, with titanium plates at the ends. The anodizing voltage was U = 25 V. The sample was immersed in a bath with electrolyte for 30 seconds, then washed in distilled water and dried at a temperature of 20˚C. The installation diagram was shown in Figure 2.

As a result of anodizing titanium surfaces, a blue TiO2 oxide film with a nm thickness was formed. The generation of plasmons on the surface of anodized titanium was confirmed earlier in (A. Zyubin et al., 2020), it was found that the maximum of plasmon absorption was in the region of 520-550 nm.
Quartz-based SERS substrates
For evaluation of antibiotics activity on E.Coli, optically transparent quartz glasses were used. Glass cleaning was carried out in a multi-stage manner. At the first stage, the plates were washed in an ultrasonic bath for 30 minutes, in which the liquid was replaced every 10 minutes according to the following scheme: Milli-Q - isopropyl alcohol - Milli-Q. Next, the plates were dried at 90°C until completely dry. After that, the glasses were placed vertically in a heat-resistant dish with a piranha solution (30% H2O2 and 96% H2SO4, 1:3) and heated to 70° C. After 30 minutes, the plate was washed 3 times for 10 minutes in an ultrasonic bath with Milli-Q and dried at 90°C until completely dry. Cleaned slides were placed vertically in a solution of 5% APTES and anhydrous toluene for 24 h. Next, to remove excess APTES, the samples were sequentially immersed in ultrasonic baths with anhydrous ethanol (10 min × 2 times) and ultrapure water (10 min × 3 times). After drying, synthesized gold nanoparticles were adsorbed onto the surface of APTES-modified glasses. To do this, the plates were horizontally immersed in colloidal solutions and left alone for 12 and 24 hours. After 24 hours, the glasses were washed with water and used for their intended purpose. The optical properties of such sensors have been studied in detail previously (Guo et al., 2015).
Nanorods preparation
For experiment AuNR solution was used. To prepare the AuNR seed solution, 500 μl of 0.1 M CTAB was mixed for better dissolution of CTAB, the solution was incubated in a water bath at 40°C, then cooled to room temperature with 25 μl of 0.01 M HAuCl43H2O. Then 100 µl of freshly prepared cooled NaBH4 (0.01 M) was added to this solution and shaken vigorously for one minute. The seed solution was used 2 hours after preparation.
To synthesize AuNR, 9.5 ml of 0.1 M CTAB was mixed (also heated first for better dissolution) with 200 μl of a 0.004 M aqueous solution of AgNO3. Then 500 μl of 0.01 M HAuCl4 was added. Next, 90 μl of 0.08 M ascorbic acid was added to this solution and stirred for one to two seconds. In this case, the color of the solution changed from brown-yellow to transparent. Finally, 12 μL of seed solution and 150 μL of HCl (1 mol/L) were added. The color change occurred 20 minutes after the addition of the seed solution. Next, the color of the solution gradually changed from pinkish-violet to red-violet over several hours. The solution was kept for 24 hours. Afterwards, the resulting AuNR was centrifuged for 20 min at 10,000 rpm, the supernatant with CTAB residues was removed, and the nanoparticle precipitate was diluted with distilled water. As a result, rods with a length of 2La=52 nm were obtained. Figure 3 shows a scanning electron microscopy (SEM) image (Fig. 3a), photon correlation spectroscopy data (Fig. 3a), as well as a photograph of the synthesized nanorods (Fig. 3b).
Figure 3
SEM photograph of nanorods (A), photon correlation spectroscopy data (A, inset), and optical photograph of synthesized nanorods (B).


To confirm plasmonic generation, absorption spectra were studied for the synthesized gold nanorods (Figure 4). The spectra are characterized by the presence of two absorption maxima, characteristic of rod-shaped nanoparticles. The first maximum was in the range of 510-515 nm and had a lower intensity than the second maximum in the range of 720-740 nm.

Identification of E.Coli cell death markers treated with ceftriaxone and VO extract
To study the photodynamic effect on cellular structures, experiments were carried out using a Renishaw Virsa Raman analyzer. First, a blank experiment was carried out without laser irradiation with a ceftriaxone and VO extract. Antibiotic was used to identify specific vibrational bands - markers of cell death. Then, VO extract assessment was carried out. Effects of the extract on E.Coli and the behavior of cell death markers has been studied. The water-based extract (20 µl) was mixed with E. Coli (40 µl) and the bacteria were subjected to stress for 10 min. The mixture was applied to anodized titanium manufactured using technology (Guo et al., 2015) with a drop volume of 2.5 μl to record Raman spectra. To analyze ceftriaxone effect, quartz based substrate with gold nanostars island films was used. Bacteria were placed on the surface of the resulting structure (Fig. 5a) with a smear and were visible at a hundredfold magnification (Fig. 5b).
Figure 5
Bacteria smeared onto the surface of the optical sensor (A) and an image of E. Coli cells on the surface of quartz glass at 100x magnification (B).


The experimental sample was placed on the spectrometer holder. A digital video camera was used to obtain an image of the sample on the optical table, and then the objects were selected, the samples were positioned and aligned. The computer image was displayed on the computer screen using Wire 5.4 software, where the instrument parameters were adjusted, laser irradiation source, control and data acquisition from detectors, data processing and sample imaging were performed.
After detection of bacteria spectra, spectral recording parameters were performed under the following conditions: dynamic imaging in the range of inverse wave numbers 350-3200 cm-1, 30 seconds, laser wavelength λ=785 nm, laser power varied from 30 mW to 60 mW and signal accumulation time on the detector from 30 sec to 60 sec. The selected optimal imaging conditions were determined by the factors of sample intactness and absence of detector illumination. The obtained spectra were saved in .txt format for further processing. After recording the spectra of the bacteria (control), 1 drop of 1 µl of the selected antibiotic was applied to the bacteria. Drying of the drug occurred within 5 minutes and imaging was resumed under the same conditions as the bacteria without drug. Raman spectra were measured every 5 minutes to observe the dynamics of bacterial wall changes under the influence of antibiotic. The imaging was stopped when the spectral pattern did not change during 3 changes. In the final step, spectral imaging of bacteria with extracts was carried out. The resulting graphs were saved in .txt format for further processing in OriginPro software.
As a result of the experimental part, the SERS spectra of E.Coli bacteria were obtained both before and after exposure to antibiotics and VO extract. The cumulative spectra obtained during natural drying of bacteria are presented in Figure 5.
Figure 6
Raman spectra of E.Coli recorded during natural drying of bacteria (a) and the average spectrum (b), which is their combination. E.Coli, recorded during natural drying of bacteria (a), and the average spectrum (b), which is their combination.


Figure 6a shows a gradual increase in the intensity of spectral bands of Raman light scattering of E. Coli (spectrum #1 - spectrum #3). These spectra were obtained under the following imaging conditions: laser power - 60 mW, accumulation time - 60 sec. At registration of spectra No.4 - No.13 experimental conditions were changed (laser power - 30 mW, accumulation time - 30 sec) because of sharp amplification of Raman signal due to approaching (drying) of the investigated sample to the surface of anodized titanium. For better identification of spectral modes, data averaging was carried out for thirteen spectra (Fig. 6b). To further investigate the antibacterial effect of the squeeze of VO extract, spectral bands in which amino acids and purine derivatives (adenine, guanine, hypoxanthine, xanthine) are observed were identified (A. Yu. Zyubin et al., 2022, Ea et al., 2018), which are presented in Table 1.
Table 1
Spectral bands (spectral profile) observed in the averaged spectrum of E. Coli and their interpretation.
Inactivation of bacterial microorganisms was difficult to analyze by comparing changes in individual spectral bands. Depending on the mode of exposure (UV irradiation, alcohols, temperature, antibiotics (A. Yu. Zyubin et al., 2022, Teng et al., 2016, Moritz et al., 2010, Li et al., 2019), etc.) and time of exposure, there is a different pattern of changes in the intensity of modes corresponding to nucleic acids, proteins, and lipids observed in the Raman spectra of E.Coli cultures. In the case of the study of the effect of VO extracts on bacterial microorganisms by the Raman spectroscopy, no literature data are presented. However, comparison of spectra obtained from living and dead bacteria is characterized by both a general decrease in the intensity of the spectrum and specific spectral bands (Zhou et al., 2015).
Figure 7 shows the Raman spectrum of VO extract, E.Coli spectra and E.Coli spectra under VO treatment. Due to the overlap of spectral bands characteristic of both the extract and E.Coli, it is difficult to analyze changes in all modes of E.Coli related modes. However, the averaged spectrum of E. Coli after exposure to the VO extract, modes (853 cm-1, 965 cm-1, 1003 cm-1, 1031 cm-1, 1410 cm-1, 1450 cm-1, 1658 cm-1) were identified that do not appear on the spectrum of E.Coli after exposure to VO extract. When comparing the modes 853 cm-1, 1003 cm-1, 1410 cm-1, 1450 cm-1, 1658 cm-1 on the spectra of E.Coli before and after exposure to the extract, there is a decrease in the intensity of spectral bands related to purine metabolites, amino acids, which tentatively indicates the inactivation of bacterial activity due to the effects of flavonoid quercetin.
Figure 7
SERS spectra of VO extract (blue), averaged SERS spectra of E.Coli before exposure (green) and after exposure to VO extract (red). All spectra are registered on anodized titanium.
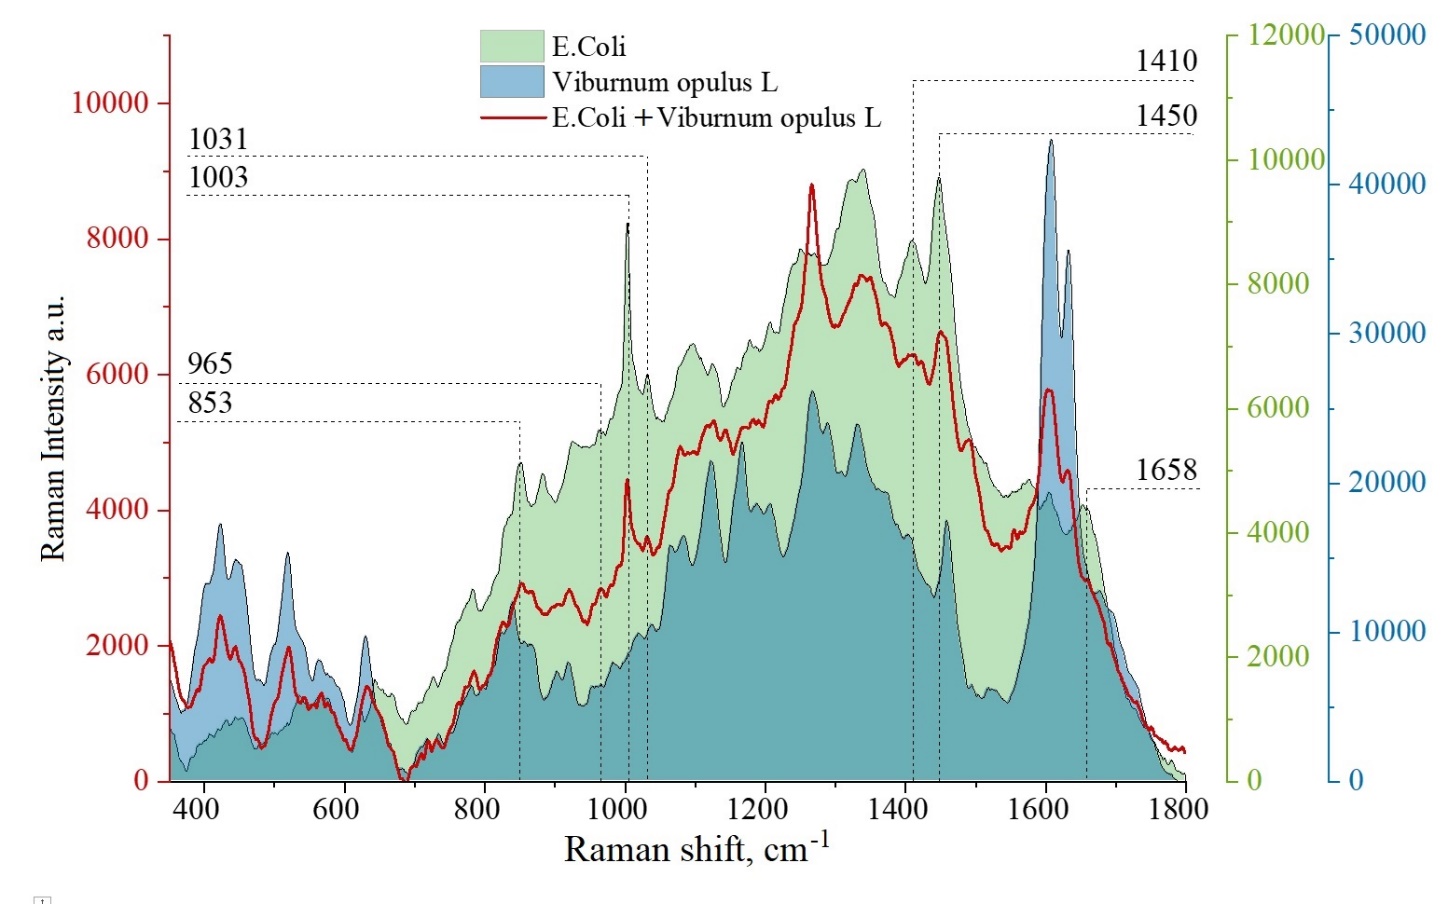
Figure 8
SERS spectra of E.Coli bacteria and the antibiotic ceftriaxone. Black spectrum - experimental spectrum of the sensitive bacterial strain. Red spectrum - experimental spectrum of the antibiotic concentration of 7.5 mg/mL. Blue spectrum - experimental spectrum of the sensitive bacterial strain after interaction with the drug. The inset graph shows the comparison of the spectra of the sensitive strain and the sensitive strain under the influence of bacteria.
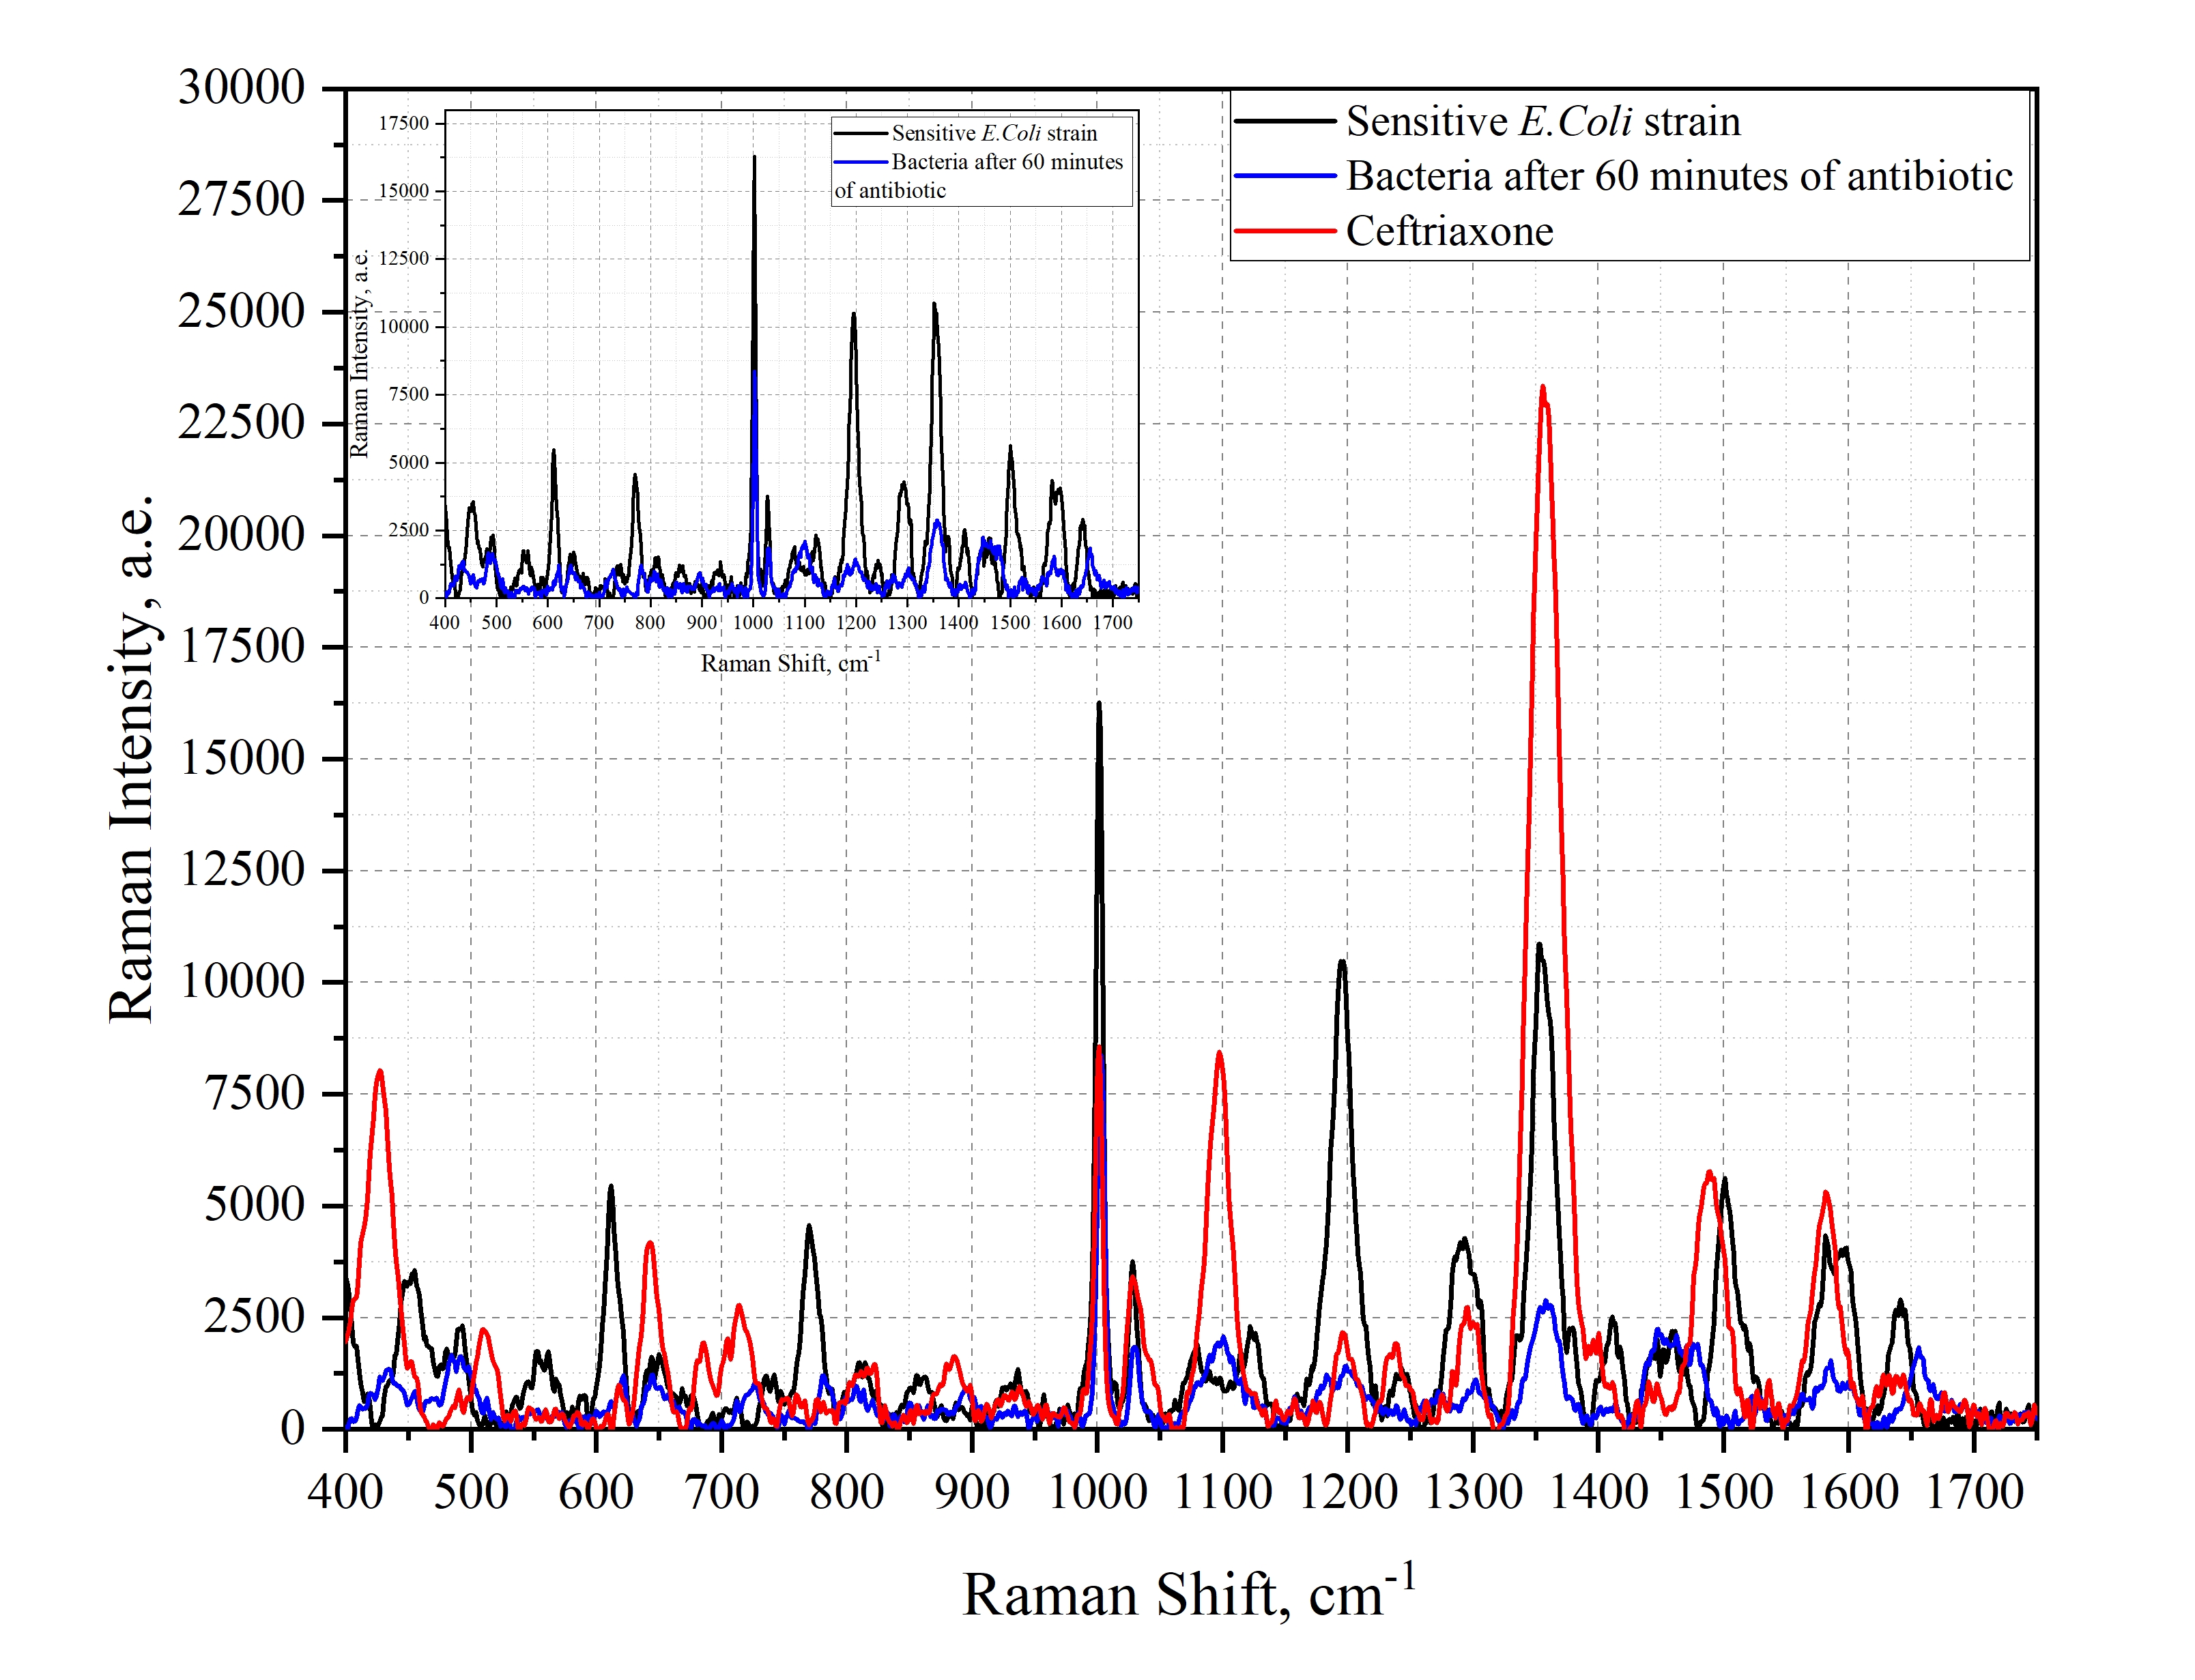
Analyzing the obtained graphs, one can notice several characteristic features of ceftriaxone effect on the sensitive strain of E.Coli for organic compounds forming the bacterial wall. For nucleic acids, a shift of maxima from 735 cm-1 to 727 cm-1, from 771 cm-1 to 785 cm-1 were registered, a decrease in the intensity of nucleic acid maxima at 672 cm-1, 812 cm-1 and 1575 cm-1 can be observed, but an increase in intensity at 1483 cm-1 can be observed. For the protein bands, a decrease in the intensity of the maxima at 855 cm-1, 1003 cm-1, 1031 cm-1, and 1246 cm-1 can be observed. For the lipid band, a decrease in intensity at 1064 cm-1, a decrease in intensity and a shift from 1295 cm-1 to 1300 cm-1 were determined.
The identification of spectral modes observed in the averaged Raman spectrum of Escherichia coli bacterial colonies was carried out. The identification of spectral modes of Escherichia coli bacterial colonies after exposure to VO extract was performed. A decrease in the intensity of spectral bands related to purine metabolites, amino acids, which indicates the inactivation of bacterial activity and testifies to the effective antibacterial activity of VO extract was successfully performed. According to the results of the study, it was found that the phenylalanine band at 1003 cm-1 reverse shift frequency and bands at 855 cm-1, 1031 cm-1, 1246 cm-1 could be a marker of cell death.
VO extract effect on E.Coli irradiated with laser excitation in the visible wavelength range.
After establishing the characteristic cell death bands, the main study was carried out in the presence of laser irradiation at a wavelength of 532 nm. To do this, several colonies of E.Coli bacteria were placed in an Eppendorf tube and diluted with distilled water. Then, in a separate test tube, 50 μl of the resulting bacteria were mixed with distilled water and 10 μl of VO ethanolic extract. The resulting bacterial solutions were placed in an incubator for 25 minutes at a temperature of 37 °C. Then, after incubation, the resulting bacterial solution with the extract was placed on an anodized titanium surface in a volume of 2.5 μl and dried at room temperature.
Table 2
Flowchart of Raman experiment with VO extracts
SERS spectra of the studied analyses were obtained using a Virsa Raman analyzer (Renishaw) in the range of 350-1800 cm-1. The experiment was carried out twice (Table 2). In the first case, spectra were obtained before irradiation with a laser with a wavelength of λ = 532 nm, then the same point was irradiated for 5 min, 10 min, 30 min, 60 min, and after each irradiation the spectrum was recorded. Then a new drop of bacteria with the extract was again applied to the surface and spectra were obtained after waiting 5 min, 10 min, 30 min and 60 min without laser irradiation. All spectra were obtained under the same conditions: accumulation time 30 sec and laser power 61 mW; The wavelength of the exciting irradiation was λ=785 nm. Next, experiments were carried out with an aqueous solution of VO. In an Eppendorf tube, 50 μl of bacteria diluted in distilled water and 10 μl of an aqueous solution of VO were mixed. The solution was incubated at 37 °C for 25 minutes. Then, after incubation, the resulting solution of bacteria with the extract was placed on an anodized titanium surface in a volume of 2.5 μl and dried at room temperature. After this, experiments were carried out with water-ethanol extracts of VO solutions with NPs.
Several colonies of E.Coli bacteria were placed in an Eppendorf tube and diluted with distilled water. Then, in a separate test tube, 50 μl of the resulting bacteria were mixed with distilled water, 10 μl of VO ethanolic extract, and 5 μl of gold nanorods (AuNR). The resulting bacterial solutions were placed in an incubator for 25 minutes at a temperature of 37 °C. Then, after incubation, the resulting solution of bacteria with the extract was placed on an anodized titanium surface in a volume of 2.5 μl and dried at room temperature. At the final stage, a study of aqueous extracts of bacteria with NPs was carried out. Several colonies of E.Coli bacteria were placed in an Eppendorf tube and diluted with distilled water. Then, in a separate test tube, 50 μl of the resulting bacteria were mixed with distilled water, 10 μl of aqueous Viburnum extract, and 5 μl of gold nanorods (AuNRs). The solution was incubated at 37 °C for 25 minutes. Then, after incubation, the resulting bacterial solution with the extract was placed on an anodized titanium surface in a volume of 2.5 μl and dried at room temperature. Analyzing experiments, we have focused on phenylalanine band phenylalanine band at 1003 cm-1, as the main cell death marker.
Results and Discussion
To compare the data “bacteria + extract with NPs with and without irradiation,” normalization was carried out relative to the control. The comparison was carried out at the same time of irradiation and without it.
Figure 9
SERS spectrum of bacteria and extract with nanoparticles with and without irradiation, 0 minutes. Moreover, after 30 minutes of irradiation, the intensity of the maximum at 1450 cm-1 decreases relative to the spectrum without radiation.
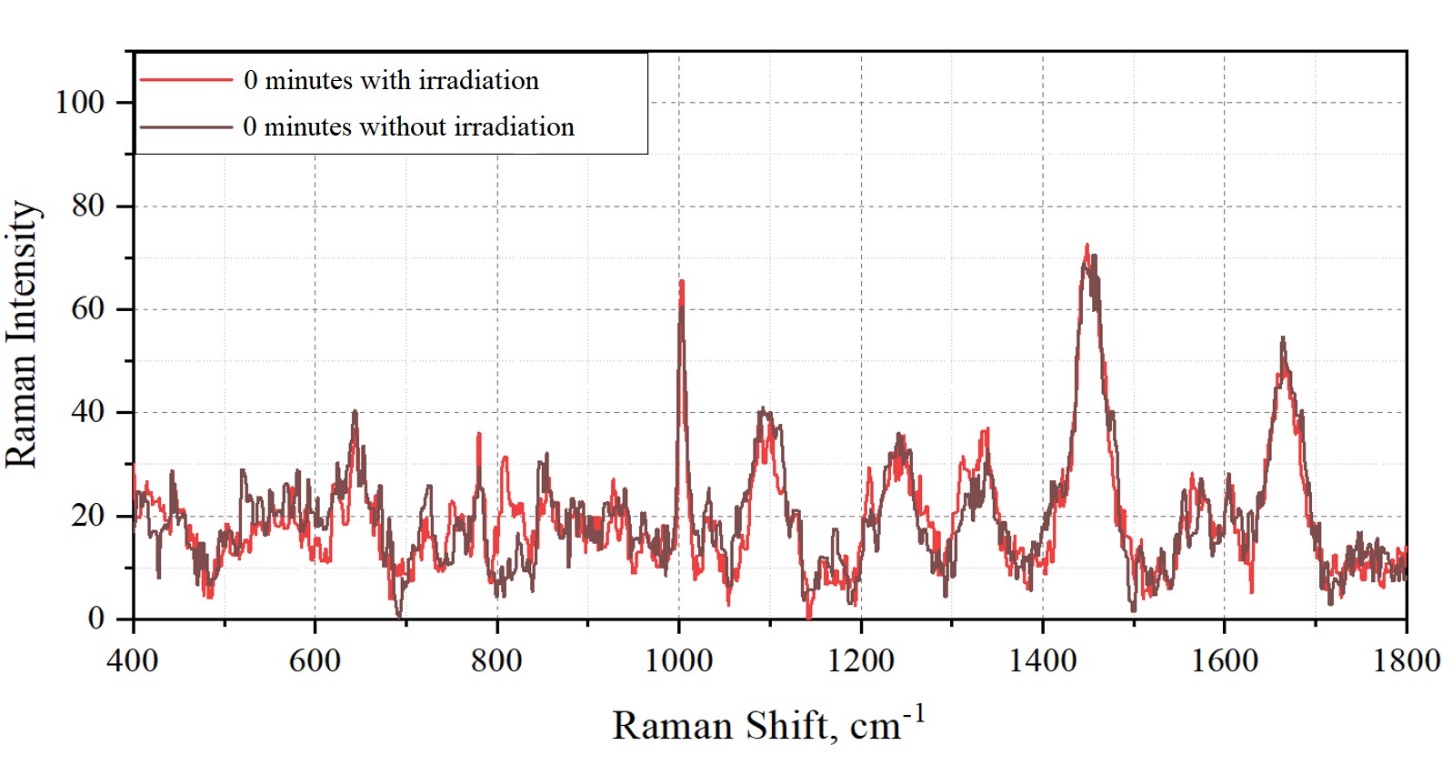
A spectral shift of the maximum is observed from 1567 cm-1 to 1582 cm-1 during irradiation. No other changes were found. The data obtained were taken into account when interpreting the results.
Table 3
Bands intensity change during experiment for water VO extract
According to the results of the study, it was found that when E.Coli is exposed to laser irradiation and water VO extract, stable cell growth is observed, which is confirmed (Karu et al., 1983). This effect is caused by the initiation of DNA replication when laser irradiation acts on bacteria. It was found that incubation with nanorods somewhat slows down cell growth. This may be due to the photothermal effect of laser radiation through heating the nanorods and the activity of the nanorod-stabilizer complex (Ashmore et al., 2018).
Table 4
Bands intensity change during experiment for water-ethanol VO extract
Results from studies of the water-ethanol extract show that no bacterial growth was detected. A decrease in the intensity of all markers was found. The vibrational mode at 1003 cm-1 decreases upon irradiation in the presence of VO water-ethanol extract, which indicates cell apoptosis. Since the work established that the water-ethanol extract does not have dark toxicity, we can conclude that singlet oxygen is generated in the system. The fact that singlet oxygen is generated by flavonoid molecules for the extract was confirmed in previous work by the group (Tsibulnikova et al., 2024). Luminescence of singlet oxygen was recorded at a wavelength of 1272 nm. It is known that the generation of singlet oxygen should be enhanced in the presence of nanoparticles (Clement et al., 2017). Despite the presence of nanorods, sources of local enhancement of the electric field, no decrease in the intensity of the phenylalanine maximum was recorded. This may be due to the use of a wavelength of Γ = 532 nm, which correlates with the absorption maximum of viburnum extract, but does not correlate with the plasmon generation maximum for nanorods at Γ = 740 nm.
Conclusions
The results of studies of the VO extract effect of extracts in relation to model cells of E.Coli bacteria up to 100 microns in size in the presence of nanorods and anodized titanium surfaces were obtained. The influence of the VO extract effect on cellular structures when irradiated with visible light with a wavelength of 532 nm was studied. Aqueous and aqueous-alcoholic extracts of viburnum with and without NPs were studied in the presence of irradiation and without it. It was established that in the presence of an aqueous extract, both with and without NPs, an increase in the spectral maxima of 1662 cm-1, 1003 cm-1, 850 cm-1, 1450 cm-1, characterizing the vital activity of the cell, is observed. It has been established that laser irradiation stimulates cell growth in the presence of an aqueous extract of viburnum. When using an aqueous-ethanol extract without NPs, a decrease in the maximum of the phenylalanine band by 1003 cm-1 was noted, which indicates apoptosis and cell death.