

INTRODUCTION
Malaria is one of the world's most severe parasitic infections, impacting millions of people. Although the worldwide malaria burden has decreased significantly in recent years, 91 countries and territories continue to have active malaria transmission, and approximately 3.2 billion people continue to be at risk of malaria (Batista et al., 2018). Malaria is Cameroon's leading cause of morbidity and mortality, especially among children under the age of five (Mbenda, Awasthi, Singh, Gouado, & Das, 2014). It is estimated that 90% of Cameroon's population is at risk for malaria, and that over 41% experience at least one episode per year, according to Cameroon's Ministry of Health (Antonio-Nkondjio et al., 2008; Ndo, Menze-Djantio, & Antonio-Nkondjio, 2011). A similar scenario exists in Ethiopia, where malaria caused by Plasmodium falciparum and Plasmodium vivax is a severe impediment to public health and socioeconomic development. Three-quarters of the country's landmass is designated malaria-endemic, putting 68 percent of the entire population at increased risk of infection (Beyene, Gelana, & Gebresilassie, 2018). Malaria exacts a severe toll due to the rising resistance of Plasmodium species to routinely used medications (Blayneh & Mohammed-Awel, 2014). These observations make it critical to identify novel antimalarial lead compounds. Natural product structures are critical in identifying leads for developing medications used to treat human ailments (Newman & Cragg, 2020). The two most effective antimalarial lead compounds, quinine and artemisinin, were identified in medicinal plants Cinchona sp. and Artemesia sp., respectively, and have since led to the synthesis of more active molecules like chloroquine and artesunate. In the Fabaceae family, Pseudarthria hookeri Wight & Arn. (also known as hookeri) is an Afrotropical plant used in Central and East Africa to treat various diseases, including malaria (Stangeland, Alele, Katuura, & Lye, 2011). However, despite the widespread use of this plant in traditional medicine to treat malaria, no previous research has focused on its antiplasmodial capabilities. The isolation and characterization of flavonoids from this plant's CH2Cl2/MeOH (1:1) extract were previously reported in a prior study by the same group (Tchamgoue et al., 2016). Some of the isolated flavonoids have been shown to have promising antimalarial effects in vitro, according to the literature (Ajaiyeoba, Ashidi, Okpako, Houghton, & Wright, 2008; Attioua et al., 2011; Kraft et al., 2000; Lehane & Saliba, 2008; Nogueira & Lopes, 2011). In light of the widespread use of this plant for the treatment of malaria, as well as the previously reported antiplasmodial properties of some flavonoids derived from it, the current study investigates the in vivo antiplasmodial activity of solvent fractions and flavonoids isolated from P. hookeri in mice infected with chloroquine-sensitive Plasmodium berghei.
MATERIALS AND METHODS
Plant material and compounds isolation
P. hookeri was collected in Dschang, Western Region, Cameroon, in December 2012. A voucher specimen (No. 43234 HNC) was deposited at the National Herbarium of Yaoundé, Cameroon. At room temperature, the dried and whole powdered plant (8.30 kg) was extracted three times (20 L each) with a CH2Cl2/MeOH (1:1) mixture. After filtering the solution, the solvent was removed under vacuum, yielding 310.6 g of crude extract (a greenish solid). To obtain the evaluated compounds, 300 g of the crude extract was subjected to successive column chromatography (Tchamgoue et al., 2016). A part of this greenish solid (10.0 g) was extracted with n-hexane (100 mL), the insoluble portion was taken up in ethyl acetate and methanol (100 mL/each), respectively. The organic solvent-soluble fractions were lyophilized, weighed, and kept at 4°C until use (Melaku et al., 2017).
In vivo acute toxicity assay
The acute toxicity investigations followed OECD standards 425 (OECD, 2001). Female Swiss albino mice aged 8–12 weeks and weighing 23–29 g were procured from the Animal House of the College of Natural Sciences, Addis Ababa University. The mice were kept in typical lab conditions with free access to food and water. Twenty-four mice were separated into four groups of six and given a week to acclimate. Treatment and control mice were fasted three (03) hours before and two (02) hours after oral administration of crude extract and vehicle (only food was withheld, while water was given ad libitum). A dose of 500, 1500 or 2500 mg/kg body weight of crude extract was given orally. The control group received 0.28 mL of vehicle (3 percent tween 80). After treatment, animals were examined for mortality and toxicity for 30 minutes, every hour for 24 hours, and once daily for 14 days. On day 14, the surviving mice were weighed. The major indicators utilised to assess acute oral toxicity in mice were body weights and behavioural alterations (conditions to adopt humane endpoints). Every effort was made to avoid or minimise mouse death or severe pain and misery.
Malaria parasite and inoculation
The in vivo antiplasmodial assay used CQ sensitive P. berghei strain ANKA. To preserve strain variety, parasites were passed weekly from infected to non-infected mice. Each experiment used blood from donor mice with a parasitaemia of 30–40%, diluted in 0.9 percent physiological saline to contain 1 x 10⁷ P. berghei parasitized erythrocytes per 0.2 mL. We used male Swiss albino mice from Addis Ababa University’s Animal House. Each mouse received 0.2 mL of 1 x10⁷ P. berghei infected RBCs intraperitoneally (Fidock, Rosenthal, Croft, Brun, & Nwaka, 2004).

In vivo antiplasmodial assay
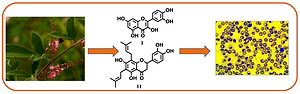
Antiplasmodial efficacy of fractions and pure substances from the whole plant of P. hookeri (Figure 1) was assessed in vivo on early P. berghei infection using the method described by Peters et al., 1975. Sixty-three male Swiss albino mice (6–11 weeks, 20–27 grammes) were separated into treatment and control groups and given a week to acclimate. The groups used for the antiplasmodial assessment of compounds and fractions constituted three and five mice, respectively. The animals were then inoculated with 0.2 mL of 1 x10⁷ P. berghei infected red blood cells intraperitoneally. Therefore, treatment groups received daily dosages of 500 mg/kg of fractions and 15–35 mg/kg of compounds, based on the amount available and reported cut off or threshold values for in vivo compound testing. Chloroquine at a dose of 25 mg/kg and a vehicle at a dose of 1 mL/100 g (3 percent Tween 80) were used as positive and negative controls, respectively. Extracts and compounds were given intragastrically 3 hours after infection on day zero (D0) and for 4 consecutive days. Five days later, thin smears of each mouse's tail blood were fixed in methanol and stained with 10% Giemsa. Five identical fields from the tailed region of each stained slide were viewed using a 100X oil immersion objective to assess each sample's percent suppression compared to the negative control group.Muluye, Melese, and Adinew (2015) computed % parasitaemia and percent suppression as follows:
Each mouse was watched to see how much weight they lost and how long they lived. On D0 and D4, their weights were recorded. The MST of the groups were computed as follows:
On D0 and D4, blood was drawn from each mouse's tail using heparinized capillary tubes. The tubes were filled to three-quarters of their volume with blood and sealed with sealing clay. The tubes were then centrifuged for 5 minutes with the sealed end outwards. The following formula was used to determine the PCV (Amelo, Nagpal, & Makonnen, 2014).
The mice showed no evidence of toxicity at the end of the experiment, so they were left to die naturally.
LC-MS analysis
The EtOAc fraction was diluted in HPLC grade methanol (5 mg/ml) and filtered. Five microlitre aliquots were injected into the LC–DAD/MS Dionex Ultimate 3000 HPLC (Germany) for analysis. HRESI-QTOF Spectrometer (Bruker, Germany) acquired high-resolution mass spectra with a UV–vis absorbance detector. Using Na Formate as a calibrant, the spectrometer was set to the positive mode of operation (mass range: 100-1500, scan rate: 1.00 Hz). Positive ionisation electrospray mass spectra were collected simultaneously. The spray voltage was 4.5 kV, the capillary temperature was 200 °C, and the sheath gas was nitrogen (10 l/min). UV spectra between 190 and 600 nm were recorded using a UV spectrometer. The spectrometer was connected to a Thermo Fisher Ultimate 3000 HPLC system equipped with an LC-pump, an autosampler (injection volume 5 μl), and a column oven (35.0 °C). Separation of solutes was accomplished using a Synergi MAX-RP 100A (50 x 2 mm, 2.5 m particle size) gradient of H2O (A)/acetonitrile (B) (flow rate 500 L/min). The following program was used to analyse samples: for 1.5 min, 95% of A was used, and the polarity was gradually increased to 100% of B. The system recovered to its initial condition (90 percent A) and was equilibrated for 1 minute. All compounds were identified using HPLC–MS and comparing UV and HRMS data from sample peaks to pure compound data.
Statistical analysis
SPSS version 20 was used to analyse data, expressed as mean followed by the standard error of the mean. The Tukey post hoc test and paired sample t-test (two-tailed) were used to compare the means of measured parameters. We considered P values equal to or less than 0.05 as statistically significant. The experimental groups were not excluded.
Results
The yield of extraction and structural characterization of compounds
The highest yield of extraction was obtained with methanol (3.51 g), followed by n-hexane (2.47 g) and ethyl acetate (1.65 g). The assessed flavonoids (Figure 1) were previously isolated from the CH2Cl2/MeOH (1:1) crude extract of the whole plant of P. hookeri employing repeated silica gel and Sephadex LH 20 column chromatography. Compounds 6 and 7 resulted from chemical transformations on 6-prenylpinocembrin (8) (Tchamgoue et al., 2016). The structures of the compounds were determined using their spectroscopic data.
Table 1
Antimalarial activity of fractions and compounds and mean survival time of infected mice#.
[i] Values are presented as M ± SEM; #5 and 3 infected mice were used for fractions and compounds respectively; chloroquine: positive control; 3% tween 80: negative control; a,b,c,d,e means of % suppression are significantly different (P≤0.05); *values are significantly different (p≤0.05) from that of the negative control; (-) not determined.
Metabolite profiling of the ethyl acetate fraction
Chromatographic profiling of the EtOAc fraction using liquid chromatography-mass spectrometry (LC-MS) led to the identification of nine flavonoids, of which compounds 8 (Rt 4.932 min) and 11 (Rt 4.898 min) were the major components (Figure 2). Compounds 1, 2, 4, 5 and 10 stood out clearly on the chromatogram at retention times of 3.566, 3.771, 3.600, 5.155 and 4.386 min, respectively, whereas compounds 9 (Rt 3.634 min) and 3 (Rt 4.215 min) had low peak intensities.

In vivo acute toxicity test
The crude extract's acute oral toxicity was determined, and no toxic symptoms or death were found in any experimental animals. The rats survived for more than 14 days following oral administration of a single dosage of the CH2Cl2/MeOH crude extract of the entire plant (up to 2500 mg/kg body weight). We investigated physical and behavioural changes in the animals and found no significant differences between the vehicle (Tween 80) and extract-treated groups.
Effect of fractions and compounds on parasitaemia and mean survival time
The 4-day suppressive test findings showed that Hex and EtOAc fractions had significant in vivo antiplasmodial activity Table 1, but the MeOH fraction had no activity at the tested dose. The fractions, as mentioned above, reduced parasite burden significantly (p ≤ 0.05) at the tested dose compared to the negative control. Moreover, the EtOAc fraction considerably extended the mean survival time (p ≤ 0.05) of infected mice compared to non-treated mice, supporting its antiplasmodial effect Table 1. Chemosuppression of 97.76 percent was observed with chloroquine (the standard medication), higher than the tested fractions.
The assessed flavonoids exhibited mild to significant in vivo antiplasmodial activity against the chloroquine-sensitive strain of P. berghei with % parasitaemia suppression ranging from 13 to 85% Table 1. As per the literature, any compound is considered active when percent suppression in parasitaemia is 30% or more (Muluye et al., 2015). Thus, eight (1–3, 5–8 and 11) out of the eleven assessed compounds showed chemosuppressive activity against P. berghei with percent suppression in parasitaemia greater than 30% by the end of the four days dosage period. Parasitaemia reduction of these active compounds was statistically significant (p ≤ 0.05) compared to their respective negative controls. Moreover, compounds 1 (15 mg/kg/day) and 11 (35 mg/kg/day) exhibited the highest percentage suppressions, these are, 85.01% and 70.39%, respectively. Compound 11 dose-dependently reduced the parasite load of the infected mice. Comparison of survival rates Table 1 between groups revealed a significant effect (p ≤ 0.05) of compounds 1, 6 and 11 on suival time of P. berghei infected mice. Almost all flavonoid-treated mice lived longer than the respective negative controls. However, the chloroquine treated mice displayed the highest mean survival time.
Table 2
Effect of fractions and compounds on body weights and PCV of P. berghei infected mice#.
[i] Values are presented as M ± SEM; #5 and 3 infected mice were used for fractions and compounds respectively; chloroquine: positive control; 3% tween 80: negative control; a,bmeans of % suppression are significantly different (P≤0.05); comparison of mean PCV and body weight difference was done across each treatment group; *difference between day 0 and day 4 is significant (p ≤0.05).
Effect of fractions and compounds on PCV and body weights
A significant (p ≤ 0.05) body weight loss was observed between D0 and D4 in mice treated with MeOH fraction and the vehicle (3% tween 80) (Table 2). At the same time, no bodyweight reduction was perceived in mice treated with Hex and EtOAc fractions. The effect of the EtOAc fraction in preventing body weight loss of P. berghei infected mice was comparable to that of chloroquine and might be due to the observed activity of this fraction. Analysis of PCV change between D0 and D4 showed that the EtOAc fraction of P. hookeri significantly reduced PCV compared to the negative control. Neither body weight loss nor PCV reduction was observed in the chloroquine treated group.
Unlike compounds 4, 9, 10 and 11 (at lower doses), all the tested flavonoids prevented body weight loss associated with the infection (Table 2). The observed effects of these compounds in preventing body weight loss are in accord with their respective in vivo antiplasmodial activities. Compounds 1 and 11 at a single dose of 15 and 35 mg/kg, respectively, significantly prevented parasite-induced body weight reduction in infected mice compared to the vehicle-treated mice. The latter caused a significant attenuation of body weight loss of infected mice in a dose-dependent manner. Furthermore, all the active compounds (% suppression of parasitaemia ≥ 30%) reverted the reduction of PCV to a variable extent compared to the vehicle treated mice, which showed significant PCV reduction between D0 and D4. Further analysis of the percent PCV change revealed no PCV reduction in infected mice treated with compounds 1, 6 and 11 at the doses of 15, 20, and 35 mg/kg, respectively.
Discussion
After oral administration of the crude extract of the whole plant of P. hookeri at a dose of 2500 mg/kg body weight, there was no death nor evidence of behavioural changes consistent with acute toxicity in experimental mice. Thus, this extract was determined to be non-toxic orally by the OECD (Organization for Economic Co-operation and Development) rules (OECD, 2001). This paper establishes for the first time the acute safety of the crude extract of this plant, which may support its widespread use in traditional medicine.
A high concentration of compounds in the plant that is better dissolved in EtOAc solvent might justify this fraction provided the best yield. Flavonoid molecules are moderately polar and are generally abundant in plants’ EtOAc fractions (Micelia et al., 2015). The observed antiplasmodial activity of Hex and EtOAc fractions at 500 mg/kg (percent suppression of 21.70 and 32.53, respectively) might be attributed to their high content of active components. According to Amponsah et al. (2012), less polar solvent fractions of cocoa powder (a rich food source of flavonoids) had stronger antiplasmodial activity. The high concentration in flavonoids of P. hookeri fractions may explain their activity. However, the polar MeOH fraction was discovered inactive, which might be due to its low concentration in phenolic compounds, including flavonoids.
The eleven assessed flavonoids (Figure 1) were allocated into four groups viz. two flavones (3 and 9), one flavonol (1), two isoflavones (2 and 4) and six flavanones (5-8, 10 and 11). The cut-off value for suppression of parasitaemia was taken as greater than 30% to consider any effective antimalarial agent (Muluye et al., 2015). Thus, except compounds 4, 9 and 10, all the assessed flavonoids were effective against P. berghei ANKA. In line with these results, several flavonoids isolated from plants have demonstrated in vitro and in vivo antiplasmodial activities (Atilaw et al., 2017; Nogueira et al., 2011). Quercetin (1) exhibited the highest antiplasmodial activity with % parasitaemia suppression of 85.01% at 15 mg/kg, which corroborates with previous findings of the in vitro antiplasmodial activity of this compound with an IC50 of 19.2 µM (Nogueira et al., 2011). It is worth mentioning that the benzylated (6) and acetylated (7) derivatives of 6-prenylpinocembrin (8) induced a drastic reduction of parasitaemia level in mice as compared to the parent compound (8). This finding indicates that further chemical modification of these compounds might lead to potentially useful antiplasmodial agents.
The mean survival time of mice treated with EtOAc and Hex fractions as well as the active compounds (1, 2, 3, 5, 6, 7, 8 and 11) was longer than that of the negative control, confirming their ability in suppressing P. berghei and probably reducing the overall pathogenic effect of the parasite in the studied mice. Among the tested compounds, the highest survival time (11.33 ± 0.88) was observed in mice treated with compound 1. This could be attributable to the ability of this compound to reduce the parasitaemia load of the infected mice.
The fractions were evaluated for their ability to prevent hemolysis and body weight loss caused by parasitaemia. Antimalarials should prevent parasitaemia-induced weight loss and PCV drop in infected mice (Tarkang, Okalebo, Ayong, Agbor, & Guantai, 2013). The lack of considerable weight loss in the groups treated with EtOAc and Hex fractions and compounds 1, 2, 3, 5, 6, 7, 8, and 11 confirmed their antiplasmodial activity. Compounds 6 and 11 at 20 and 35 mg/kg, respectively, increased mice's body weight. These chemicals may also have appetite-stimulating properties, contributing to weight gain (Muluye et al., 2015). The PCV reduction in P. berghei infected mice was not substantial except for compounds 3 and 5, possibly due to their hemolysis protective function.
Preliminary qualitative analysis was focused on the EtOAc fraction as it exhibited the highest in vivo antiplasmodial activity. The LC-MS analysis of this fraction led to the identification of nine of the eleven assessed compounds, which further confirmed its flavonoid-rich nature. Hence, the observed therapeutic effect of this fraction might be imputed to its flavonoid content. A similar method was used byDjova, Nyegue, Messi, Afagnigni, and Etoa (2019) andMelaku et al. (2017) to identify some bioactive flavonoids in Ochna schweinfurthiana and Dodonaea angustifolia, respectively.
Furthermore, some flavonoids such as quercetin and apigenin are known to interfere with readouts through interaction with unrelated biological targets (unselective interaction) and can appear as apparent active biomolecules (‘bad’ molecules or false hits) (Baell & Walters, 2014; Glaser & Holzgrabe, 2015; Heinrich et al., 2020). Such compounds (commonly called pan-assay interference compounds, PAINS) interfere in readouts in multiple ways, including non-selective reactivity with proteins, fluorescence, aggregation, cysteine oxidation, membrane disruption, and chelation, among others (Santos, Chin, & M, 2015). However, the combination of knowledge-based (substructure filters, computational calculations, etc.) and experimental methods (direct detection by HPLC-MS/LC-MS; compound-target dilution, redox-assays, etc.) contribute to the search of ‘bad’ molecules, which can be removed from pharmacological investigations.
In the present study, LC-MS analysis was used to identify bioactive antimalarial compounds of P. hooheri extract. Thus, it is not unreasonable to speculate that the antiplasmodial activity of P. hooheri could be ascribed to the presence of the flavonoids 1 and 11, which were identified through LC-MS analysis. It is worth noting that even with PAINS characteristics, compounds with promising potencies should be considered for chemical probe discovery to help and improve our understanding of drug targets/transporters and pathways (Baell & Nissink, 2018). Nevertheless, more vigorous investigations of the antiplasmodial activity of P. hooheri extract and compounds using two or more experimental methods to avoid false results are recommended (Santos et al., 2015). While previous chemical and biological studies on this plant identified flavonoids with intriguing in vitro antibacterial, antiproliferative, and antidiabetic properties (Dzoyem et al., 2018; Tchamgoue et al., 2016), the in vivo antiplasmodial activity of fractions and compounds derived from this plant, as well as the toxicity of its crude extract, were unknown. Additional antimalarial experiments, both curative and prophylactic, as well as sub-acute toxicity studies of P. hooheri extracts and flavonoids, should be considered. MS/MS analysis of the resultant LC-MS peaks should be performed to confirm the identity of the detected chemicals.
CONCLUSION
This study examines the antiplasmodial activity of P. hookeri fractions and flavonoid components in vivo. As a result of this discovery, the EtOAc fraction exhibited significant antiplasmodial activity, and compounds 1, 6, and 11 were identified as prospective candidates for creating novel antiplasmodial medicines. The LC-MS analysis of this fraction indicated the presence of numerous flavonoids that may contribute to the fraction's reported activity. Furthermore, the crude extract of this plant was determined to be non-toxic, confirming its use in folk medicine. This is the first study to demonstrate P. hookeri's antiplasmodial action and the nontoxic nature of its crude extract.
Ethical approval
The Institutional Ethics Review authorised the experimental study process and protocol. The Ethics Committee authorised all mouse research (IRB/032/2018).
Author contributions
Research concept and design: Joseph Tchamgoue, Yalemtsehay Mekonnen; Collection and/or assembly of data: Amelework N. Eyado, Joseph Tchamgoue; Data analysis and interpretation: Boniface P. Kamdem, Joseph Tchamgoue, Yalemtsehay Mekonnen; Writing the article: Yvan Anderson T. Ngandjui, Boniface P. Kamdem, Joseph Tchamgoue Critical revision and Final approval of the article: Jean Claude Tchouankeu, Simeon F. Kouam, Yalemtsehay Mekonnen.